Connect with us

SEO

Looking for Affordable SEO Services? Here’s What You Need to Know

Published

on

Looking for Affordable SEO Services? Here’s What You Need to Know

Good SEO is not cheap. The expertise of the professional and the use of industry tools are just some of the factors that give quality SEO work its price tag. In fact, our studies indicate the average cost of a monthly SEO retainer is as much as $1,500.

For someone starting a new business, this figure could be way outside your reach. So how do you find a truly affordable SEO solution that can fit any budget? Well, it comes down to asking yourself three simple questions:

  • What SEO services does your website need?
  • Can you do it yourself?
  • If not, how can you find an affordable SEO service provider to do it for you?

In this article, we will answer all these questions and give you everything you need to know when looking for affordable SEO services. 

There are four main SEO services you need to take into consideration: on-page, off-page (mainly link building), technical, and local. Although all of these aspects play a role in every website, you may not need help in every area.

Here’s the thing. If you go directly to an agency and sign up for a standard retainer, you will be paying for work in all of these areas. But the fact is you may already have killer links and just need some on-page optimizations, or vice versa. 

This means that even if the retainer is within your budget, you could be paying for work you don’t really need.

So with that in mind, let’s take a more detailed look at what each service is, how you can figure out if you need it, and which aspects (if any) you can manage yourself.

On-page optimization

On-page optimization is where you improve content to help you rank higher. Sometimes, even the smallest changes can be the difference between your website being on the first or third page of Google. 

It’s good to start your evaluation with on-page because these are the aspects you can control. Examples of some common on-page optimizations include:

Do I need it?

The easiest way is to look at the SERP overview in Ahrefs’ Keywords Explorer for the keyword you want to rank for. First, are you ranking? And if so, are you ranking as high as you’d like? 
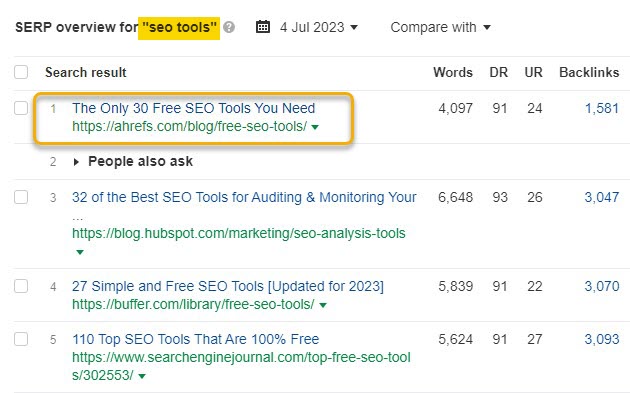
SERP overview for "seo tools," via Ahrefs' Keywords Explorer

You need to do this on a page-by-page basis rather than sitewise to analyze which pages need improvement. 

Can I do it myself?

The key here is to focus on search intent. If your page is not ranking as highly as you’d like, check to see whether it aligns with what people want. Example: Is your page a how-to guide, but all of the top-ranking articles are listicles?

If it aligns, the next thing is to check if your page misses important points that your competitors cover. One way to fill potential content gaps in your existing pages is to use Ahrefs’ Content Gap tool.

When using the SERP overview, select the competitors that are performing better than you and open with Content Gap.
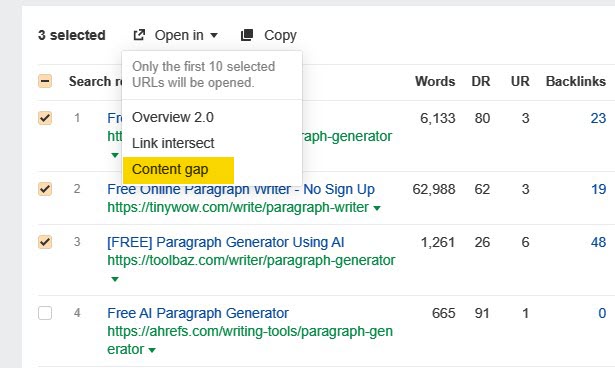
"Open in content gap" feature, via Ahrefs' Keywords Explorer

In the Content Gap report, add your page for comparison.
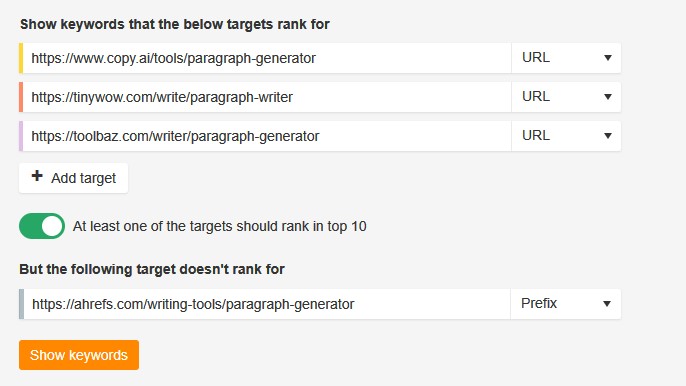
Content Gap targets

This will show all of the keywords your competitors’ articles rank for that yours do not. Some of those keywords may indicate points or subtopics that your content is missing. 
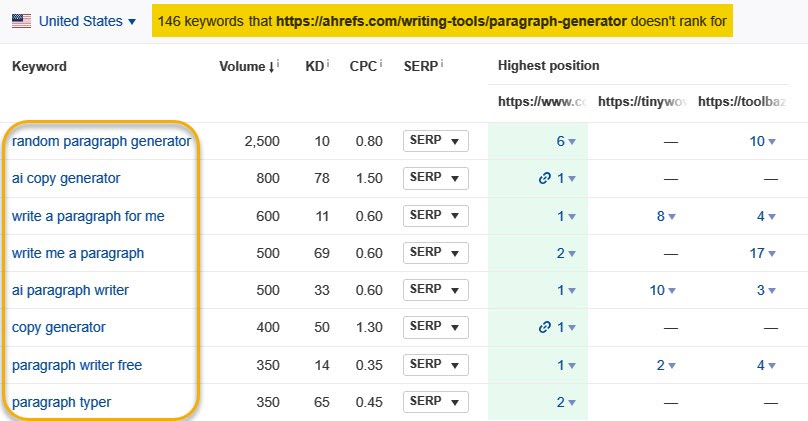
Finding missing keywords using Ahrefs' Content Gap tool

Link building services

Link building is all about getting other websites to link to pages on your site. In 2016, Google’s Andrey Lipattsev confirmed backlinks are one of Google’s strongest ranking factors. So if you want your pages to rank highly on the SERPs, you’re going to need quality links. 

Popular link building techniques include:

Do I need it?

As a general rule, you’re always going to need link building. If you’re pretty sure your on-page SEO is on point, checking the SERP overview in Keywords Explorer can also give you insights into whether a lack of backlinks is the issue. 

Ahrefs’ URL Rating (UR) works on the same basic principles as Google’s PageRank. Therefore, the UR on your own page can give you an idea of its strength compared to your ranking competitors.

If your UR is lower than competing pages and you have fewer backlinks, you probably need to do some link building. 

Can I do it myself?

The question is not necessarily if you can do link building for your site but more of whether you want to. 

Quality link building is hard work and takes a lot of time and dedication. If you want real results, it’s not something you can do here and there; it’s a full-time commitment. 

If you want to learn more about how to do link building yourself, you can check out our free link building for beginners and advanced link building courses. 

For the most part, it may be better to let the professionals handle this one. Especially if link building is a new concept to you, it will probably take you a lot of time with very few results.

Technical optimization

Technical SEO is where you optimize pages to make sure search engines can find, crawl, and index them. It involves things like having a sitemap, logical site architecture, and using schema markup.

Do I need it?

The ins and outs of what technical optimizations you need can be difficult to determine. Even good SEOs aren’t necessarily technical specialists, so it can be very confusing for someone with less SEO experience. 

The best way to determine if you’ll need technical help is to use Ahrefs’ Site Audit. When the tool has finished crawling your site, you will be given a top-level view of your website’s on-page and technical SEO issues with an overall Health Score out of 100. 

If the score is low, like in the example below, there are likely some issues you will need assistance with. 
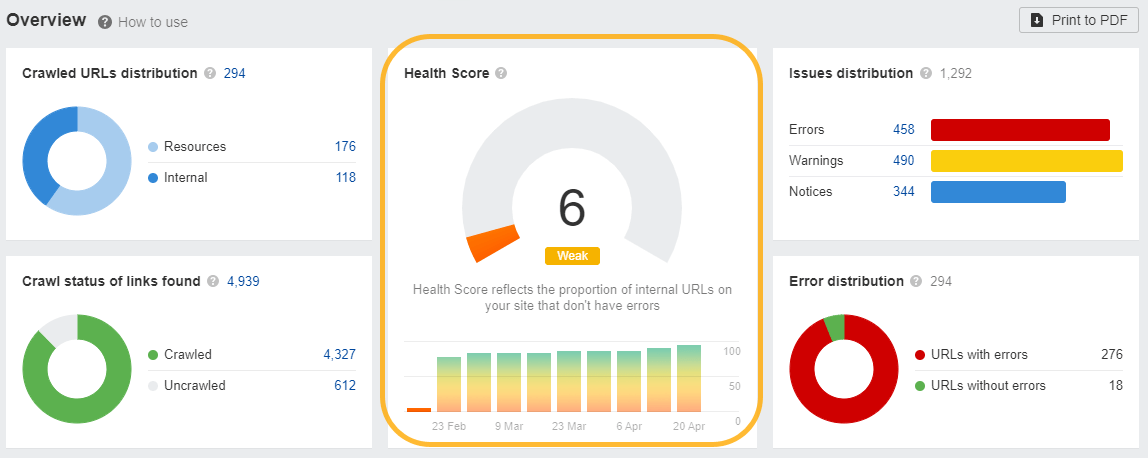
Low Health Score, via Ahrefs' Site Audit

To get a better idea of what needs your attention, head to the All Issues tab in the left-hand menu and look at the problems.

If most of your issues fall under “Content,” these are on-page problems that you can most likely fix yourself with a little time. However, if most issues fall under “Indexability,” “Localization,” “Performance,” or “Sitemaps,” you may need technical assistance. 

Technical SEO can make or break your website. Although you may be able to rectify a couple of unruly 404 pages easily, the technical stuff should only ever be dealt with by professionals. 
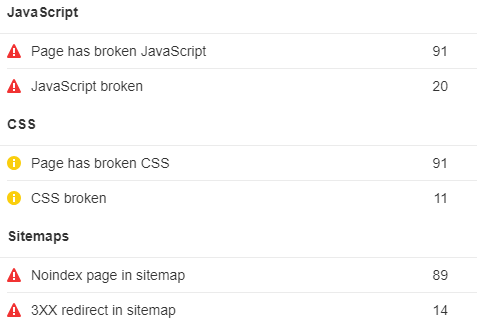
Site Audit issues

Can I do it myself?

Improper implementation of aspects like hreflang tags, schema, and canonical tags can completely break your site. Plus, you can accidentally prevent your entire site from being indexed with the touch of a button, so it’s best left to the pros.

WordPress search engine visibility

Local SEO services

Local SEO is optimizing your online presence to get more business from local searches. It should be your priority if your business serves a local area.

Do I need it?

Determining whether you need local SEO is pretty simple. Do you appear in the search results for your primary keywords and location? Do you have a Google Business Profile? If not, then you will need local SEO.
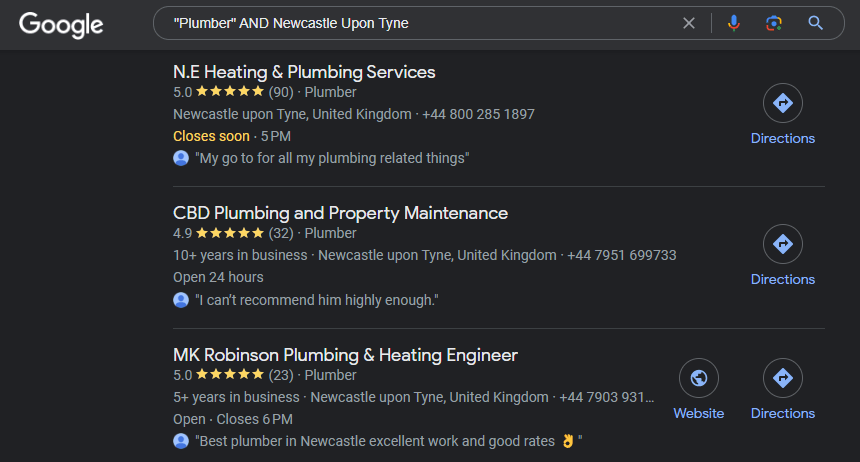
Local search example

Can I do it myself?

Yes, you can do the basics yourself. For example, setting up a Google Business Profile, which can be done in as little as 30 minutes. You can also easily build local citations. By using Ahrefs’ Link Intersect tool, you can see which directories your competitors are listed on.
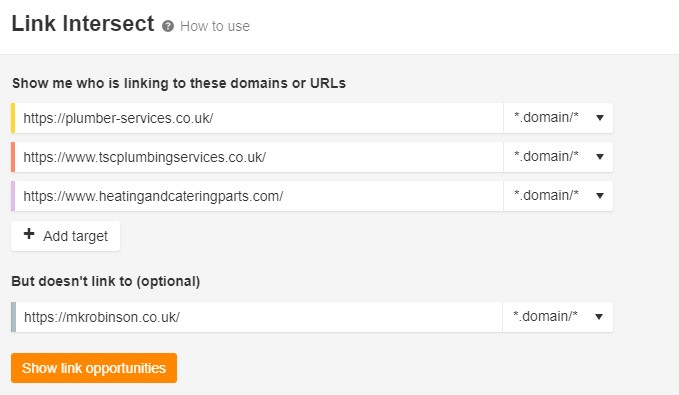
Ahrefs' Link Intersect tool

However, beyond that, you will want a specialist to help you.

What to look for in an affordable SEO provider

Now that you have figured out which services you need and that you are probably going to need some help implementing them, it’s time to look for a service provider within your budget.

Both agencies and freelancers usually offer three different options for pricing, including:

  • Hourly rates.
  • Monthly retainers.
  • One-off project with agreed-on fees.

Which one you go with will depend on your budget, the service you need, and your chosen provider. 

I’d like to add a quick note on what makes a service provider affordable. It is important to remember that the price of a service doesn’t always indicate the quality of work. For the most part, how a service is priced will heavily depend on where the provider is based. 

Our studies have shown that the average hourly rate of an SEO freelancer in India is under $30 per hour. At the same time, those based in the U.K. and U.S. charge $75 per hour on average.
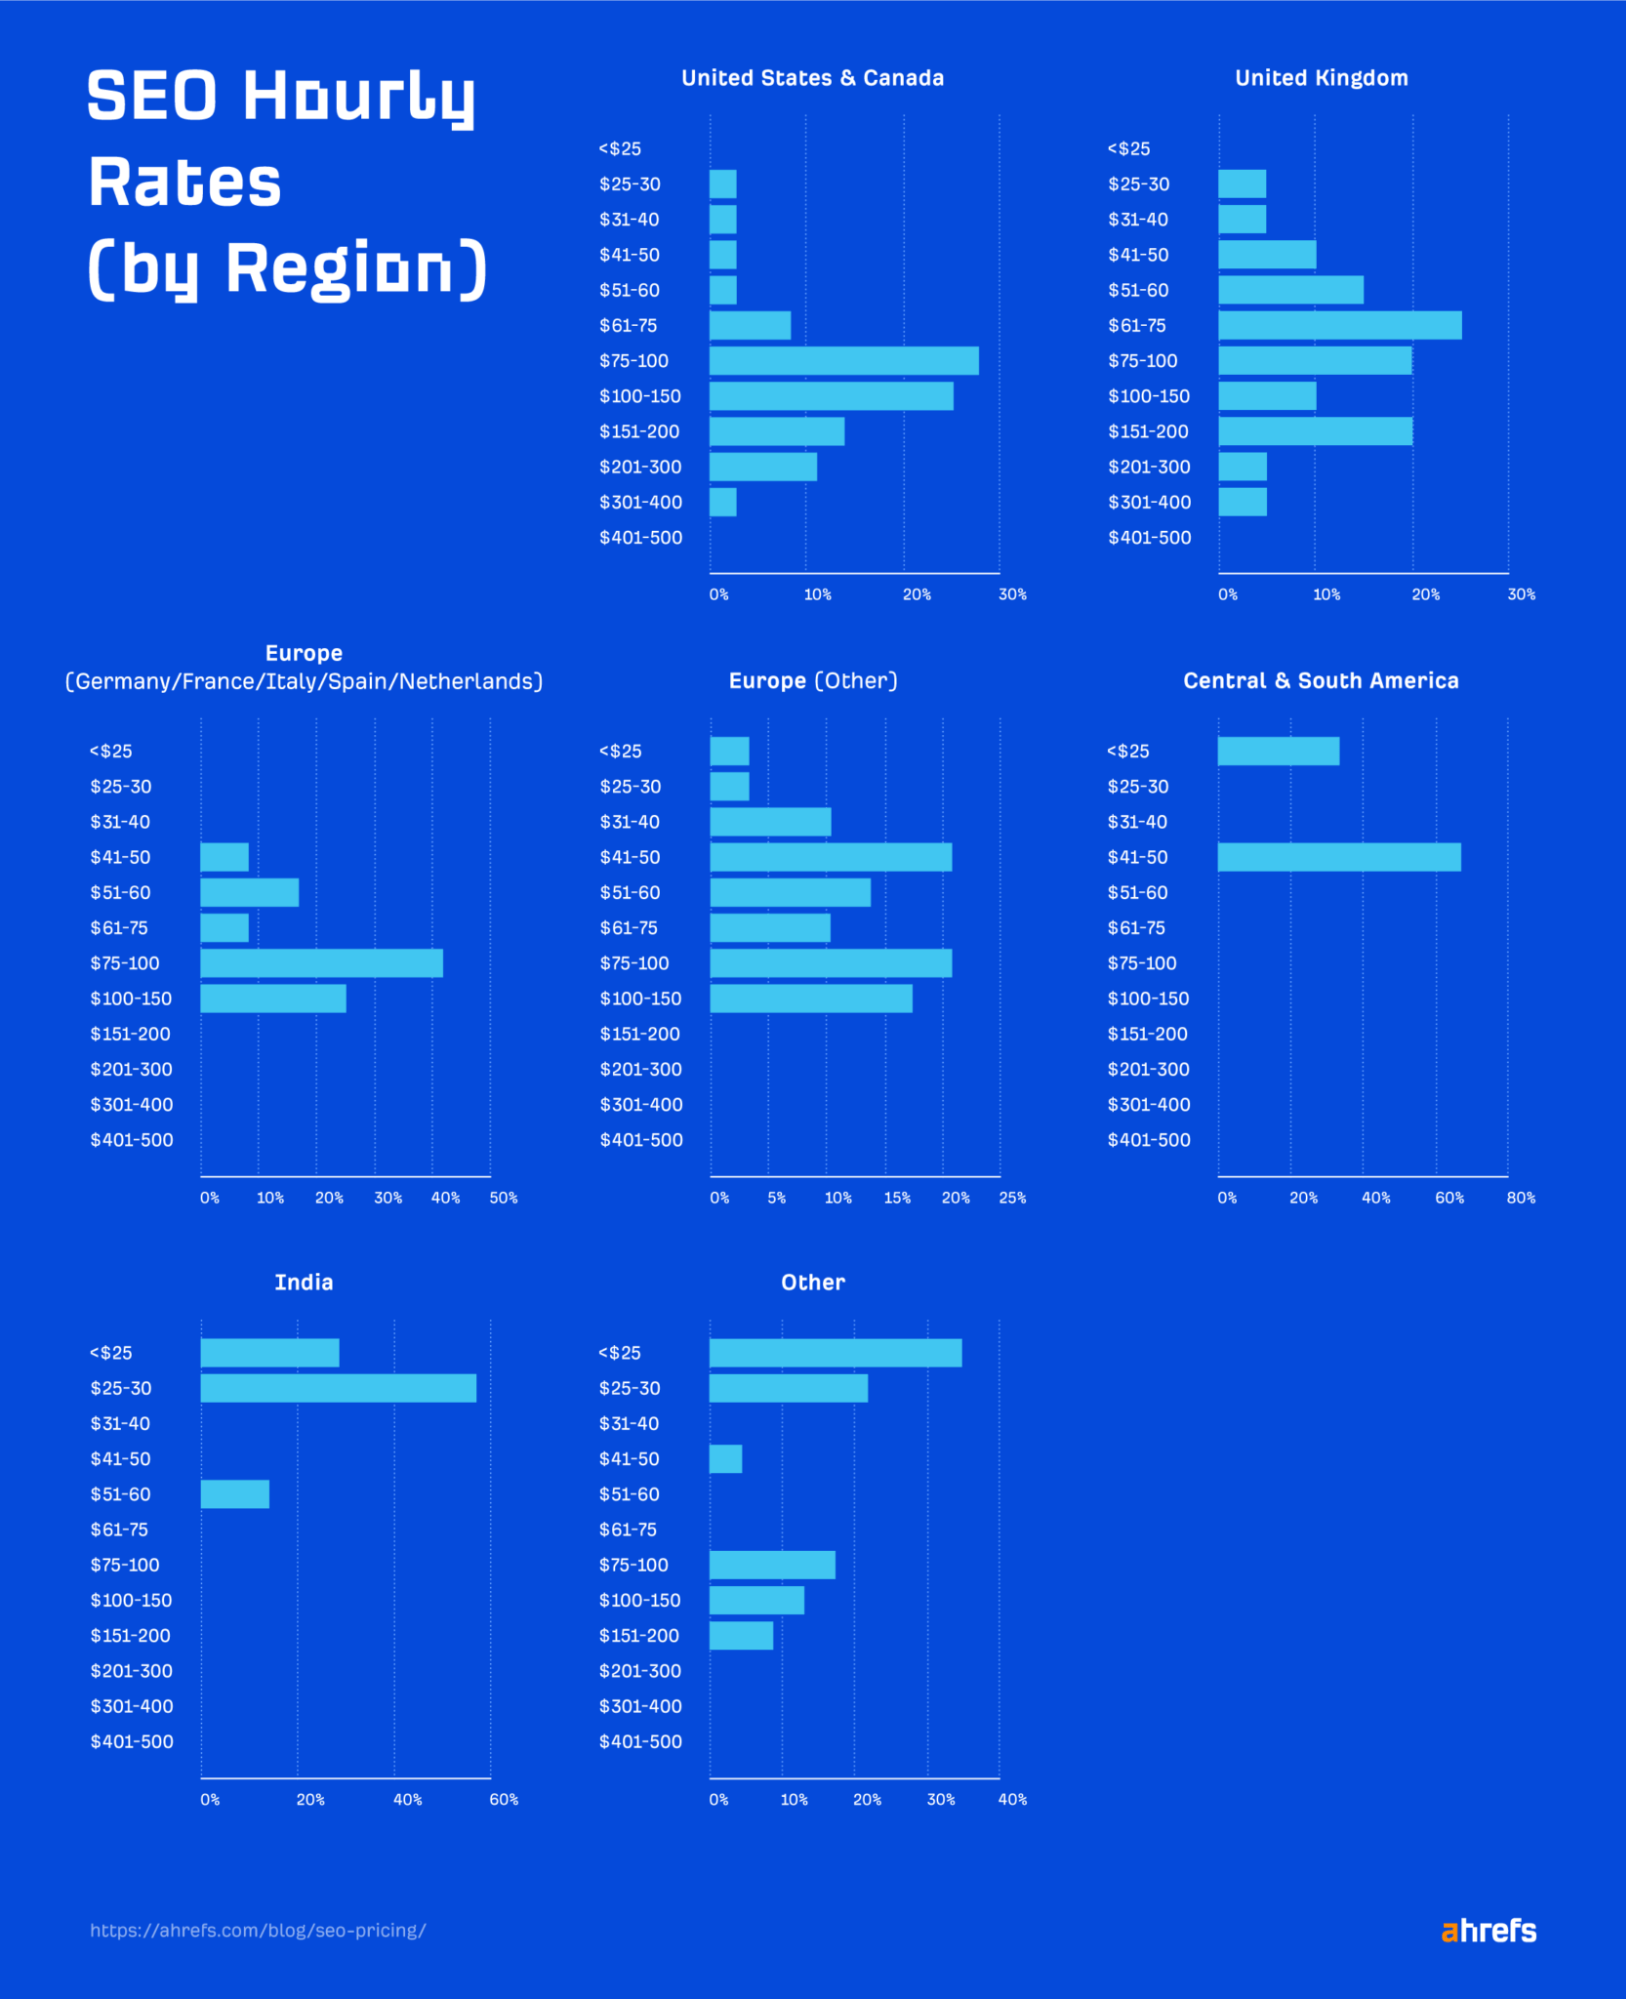
Bar graphs showing SEO hourly rates by region

There are some unavoidable base costs in SEO, such as professional tools, that every agency and freelancer will need to cover. But beyond that, a higher price may simply be due to the location rather than the fact the work is actually better. 

Just remember that while it’s possible to get quality work at a lower cost (depending on the provider’s location), if something seems too good to be true, it likely is. If you’re quoted $30 for 100 links, this is probably one to avoid.

Let’s look at what you should look for in a quality provider.

Good communication

If an agency’s or freelancer’s communication sucks to begin with, keep looking. It’s likely to get worse over time, and no one wants to spend their time chasing people for updates. 

Transparency

No SEO service provider is going to give away their “secret sauce” in a discovery call, but they should at least be willing to give you a high-level view of what they’ll do for you. 

If they just say they will “build links” and refuse to tell you their strategies or approach, run a mile. 

Quality of service

You need a provider who has expertise in the field and can provide you with reliable results.

Many SEO agencies will list brands and companies they have previously worked with on their websites. This can give you an idea of the quality of their clientele. After all, well-known companies aren’t going to work with anyone producing subpar results.

Example of clients listed on an agency website
Example of former clients listed on an agency website.

Reputation and expertise

Don’t be afraid to check out references from previous clients when evaluating an agency or freelancer. This will also help you understand the quality of work the provider does, as well as whether they have a good reputation.

You can also look for additional indicators of their experience on their website, such as awards and case studies.

Example of awards listed on an agency site
Example of awards listed on an agency website.

Realistic goals and timelines

The last thing you want is to be sold on the promise of quick results that can’t be delivered. Any professional should be able to give you an expected time frame they think is needed for your project and whether they foresee any potential issues that could arise along the way. 

Choosing a provider who will keep you updated with regular reports on the progress is important so you can track how well the project is going. 
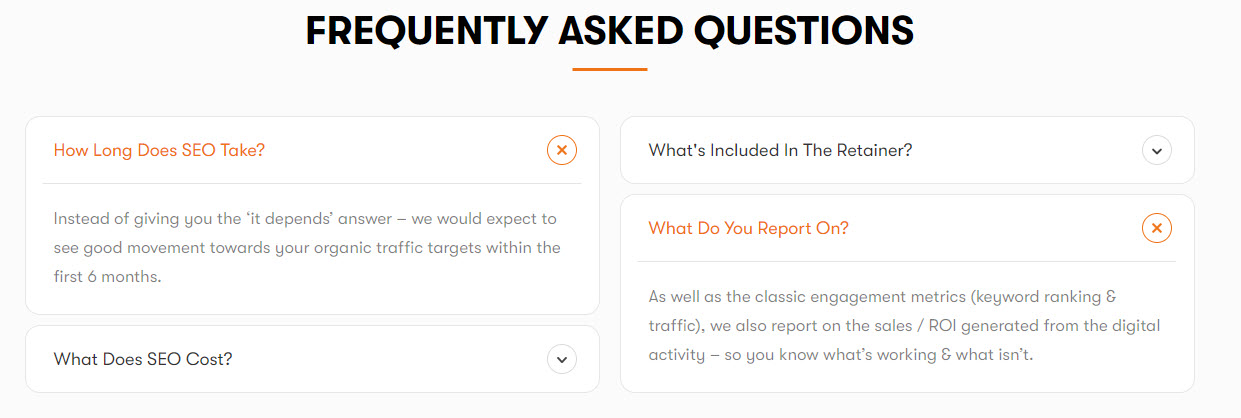
Timelines and reporting details on an agency website
Example of timelines and what is reported from a U.K.-based agency website.

Final thoughts

Quality SEO services aren’t cheap. But you can keep them budget-friendly by identifying what areas your website actually needs help with, doing the work you can yourself, and choosing an affordable provider for everything else. 

Got questions? Ping me on Twitter.


Source link

Keep an eye on what we are doing
Be the first to get latest updates and exclusive content straight to your email inbox.
We promise not to spam you. You can unsubscribe at any time.
Invalid email address

SEO

No Algorithmic Actions For Site Reputation Abuse Yet

Published

on

By

Looking up at an angle at the Google sign on the Head Office for Canada

Google’s Search Liaison, Danny Sullivan, has confirmed that the search engine hasn’t launched algorithmic actions targeting site reputation abuse.

This clarification addresses speculation within the SEO community that recent traffic drops are related to Google’s previously announced policy update.

Sullivan Says No Update Rolled Out

Lily Ray, an SEO professional, shared a screenshot on Twitter showing a significant drop in traffic for the website Groupon starting on May 6.

Ray suggested this was evidence that Google had begun rolling out algorithmic penalties for sites violating the company’s site reputation abuse policy.

However, Sullivan quickly stepped in, stating:

“We have not gone live with algorithmic actions on site reputation abuse. I well imagine when we do, we’ll be very clear about that. Publishers seeing changes and thinking it’s this — it’s not — results change all the time for all types of reasons.”

Sullivan added that when the actions are rolled out, they will only impact specific content, not entire websites.

This is an important distinction, as it suggests that even if a site has some pages manually penalized, the rest of the domain can rank normally.

Background On Google’s Site Reputation Abuse Policy

Earlier this year, Google announced a new policy to combat what it calls “site reputation abuse.”

This refers to situations where third-party content is published on authoritative domains with little oversight or involvement from the host site.

Examples include sponsored posts, advertorials, and partner content that is loosely related to or unrelated to a site’s primary purpose.

Under the new policy, Google is taking manual action against offending pages and plans to incorporate algorithmic detection.

What This Means For Publishers & SEOs

While Google hasn’t launched any algorithmic updates related to site reputation abuse, the manual actions have publishers on high alert.

Those who rely heavily on sponsored content or partner posts to drive traffic should audit their sites and remove any potential policy violations.

Sullivan’s confirmation that algorithmic changes haven’t occurred may provide temporary relief.

Additionally, his statements also serve as a reminder that significant ranking fluctuations can happen at any time due to various factors, not just specific policy rollouts.


FAQ

Will Google’s future algorithmic actions impact entire websites or specific content?

When Google eventually rolls out algorithmic actions for site reputation abuse, these actions will target specific content rather than the entire website.

This means that if certain pages are found to be in violation, only those pages will be affected, allowing other parts of the site to continue ranking normally.

What should publishers and SEOs do in light of Google’s site reputation abuse policy?

Publishers and SEO professionals should audit their sites to identify and remove any content that may violate Google’s site reputation abuse policy.

This includes sponsored posts and partner content that doesn’t align with the site’s primary purpose. Taking these steps can mitigate the risk of manual penalties from Google.

What is the context of the recent traffic drops seen in the SEO community?

Google claims the recent drops for coupon sites aren’t linked to any algorithmic actions for site reputation abuse. Traffic fluctuations can occur for various reasons and aren’t always linked to a specific algorithm update.


Featured Image: sockagphoto/Shutterstock


Source link

Keep an eye on what we are doing
Be the first to get latest updates and exclusive content straight to your email inbox.
We promise not to spam you. You can unsubscribe at any time.
Invalid email address
Continue Reading

SEO

WP Rocket WordPress Plugin Now Optimizes LCP Core Web Vitals Metric

Published

on

By

WP Rocket WordPress Plugin Now Optimizes LCP Core Web Vitals Metric

WP Rocket, the WordPress page speed performance plugin, just announced the release of a new version that will help publishers optimize for Largest Contentful Paint (LCP), an important Core Web Vitals metric.

Large Contentful Paint (LCP)

LCP is a page speed metric that’s designed to show how fast it takes for a user to perceive that the page is loaded and read to be interacted with. This metric measures the time it takes for the main content elements has fully loaded. This gives an idea of how usable a webpage is. The faster the LCP the better the user experience will be.

WP Rocket 3.16

WP Rocket is a caching plugin that helps a site perform faster. The way page caching generally works is that the website will store frequently accessed webpages and resources so that when someone visits the page the website doesn’t have to fetch the data from the database, which takes time, but instead will serve the webpage from the cache. This is super important when a website has a lot of site visitors because that can use a lot of server resources to fetch and build the same website over and over for every visitor.

The lastest version of WP Rocket (3.16) now contains Automatic LCP optimization, which means that it will optimize the on-page elements from the main content so that they are served first thereby raising the LCP scores and providing a better user experience.

Because it’s automatic there’s really nothing to fiddle around with or fine tune.

According to WP Rocket:

  • Automatic LCP Optimization: Optimizes the Largest Contentful Paint, a critical metric for website speed, automatically enhancing overall PageSpeed scores.
  • Smart Management of Above-the-Fold Images: Automatically detects and prioritizes critical above-the-fold images, loading them immediately to improve user experience and performance metrics.

All new functionalities operate seamlessly in the background, requiring no direct intervention from the user. Upon installing or upgrading to WP Rocket 3.16, these optimizations are automatically enabled, though customization options remain accessible for those who prefer manual control.”

Read the official announcement:

WP Rocket 3.16: Improving LCP and PageSpeed Score Automatically

Featured Image by Shutterstock/ICONMAN66

Source link

Keep an eye on what we are doing
Be the first to get latest updates and exclusive content straight to your email inbox.
We promise not to spam you. You can unsubscribe at any time.
Invalid email address
Continue Reading

SEO

Optimizing Interaction To Next Paint: A Step-By-Step Guide

Published

on

By

Optimizing Interaction To Next Paint: A Step-By-Step Guide

This post was sponsored by DebugBear. The opinions expressed in this article are the sponsor’s own.

Keeping your website fast is important for user experience and SEO.

The Core Web Vitals initiative by Google provides a set of metrics to help you understand the performance of your website.

The three Core Web Vitals metrics are:

This post focuses on the recently introduced INP metric and what you can do to improve it.

How Is Interaction To Next Paint Measured?

INP measures how quickly your website responds to user interactions – for example, a click on a button. More specifically, INP measures the time in milliseconds between the user input and when the browser has finished processing the interaction and is ready to display any visual updates on the page.

Your website needs to complete this process in under 200 milliseconds to get a “Good” score. Values over half a second are considered “Poor”. A poor score in a Core Web Vitals metric can negatively impact your search engine rankings.

Google collects INP data from real visitors on your website as part of the Chrome User Experience Report (CrUX). This CrUX data is what ultimately impacts rankings.

Image created by DebugBear, May 2024

How To Identify & Fix Slow INP Times

The factors causing poor Interaction to Next Paint can often be complex and hard to figure out. Follow this step-by-step guide to understand slow interactions on your website and find potential optimizations.

1. How To Identify A Page With Slow INP Times

Different pages on your website will have different Core Web Vitals scores. So you need to identify a slow page and then investigate what’s causing it to be slow.

Using Google Search Console

One easy way to check your INP scores is using the Core Web Vitals section in Google Search Console, which reports data based on the Google CrUX data we’ve discussed before.

By default, page URLs are grouped into URL groups that cover many different pages. Be careful here – not all pages might have the problem that Google is reporting. Instead, click on each URL group to see if URL-specific data is available for some pages and then focus on those.

1716368164 358 Optimizing Interaction To Next Paint A Step By Step GuideScreenshot of Google Search Console, May 2024

Using A Real-User Monitoring (RUM) Service

Google won’t report Core Web Vitals data for every page on your website, and it only provides the raw measurements without any details to help you understand and fix the issues. To get that you can use a real-user monitoring tool like DebugBear.

Real-user monitoring works by installing an analytics snippet on your website that measures how fast your website is for your visitors. Once that’s set up you’ll have access to an Interaction to Next Paint dashboard like this:

1716368164 404 Optimizing Interaction To Next Paint A Step By Step GuideScreenshot of the DebugBear Interaction to Next Paint dashboard, May 2024

You can identify pages you want to optimize in the list, hover over the URL, and click the funnel icon to look at data for that specific page only.

1716368164 975 Optimizing Interaction To Next Paint A Step By Step GuideImage created by DebugBear, May 2024

2. Figure Out What Element Interactions Are Slow

Different visitors on the same page will have different experiences. A lot of that depends on how they interact with the page: if they click on a background image there’s no risk of the page suddenly freezing, but if they click on a button that starts some heavy processing then that’s more likely. And users in that second scenario will experience much higher INP.

To help with that, RUM data provides a breakdown of what page elements users interacted with and how big the interaction delays were.

1716368164 348 Optimizing Interaction To Next Paint A Step By Step GuideScreenshot of the DebugBear INP Elements view, May 2024

The screenshot above shows different INP interactions sorted by how frequent these user interactions are. To make optimizations as easy as possible you’ll want to focus on a slow interaction that affects many users.

In DebugBear, you can click on the page element to add it to your filters and continue your investigation.

3. Identify What INP Component Contributes The Most To Slow Interactions

INP delays can be broken down into three different components:

  • Input Delay: Background code that blocks the interaction from being processed.
  • Processing Time: The time spent directly handling the interaction.
  • Presentation Delay: Displaying the visual updates to the screen.

You should focus on which INP component is the biggest contributor to the slow INP time, and ensure you keep that in mind during your investigation.

1716368164 193 Optimizing Interaction To Next Paint A Step By Step GuideScreenshot of the DebugBear INP Components, May 2024

In this scenario, Processing Time is the biggest contributor to the slow INP time for the set of pages you’re looking at, but you need to dig deeper to understand why.

High processing time indicates that there is code intercepting the user interaction and running slow performing code. If instead you saw a high input delay, that suggests that there are background tasks blocking the interaction from being processed, for example due to third-party scripts.

4. Check Which Scripts Are Contributing To Slow INP

Sometimes browsers report specific scripts that are contributing to a slow interaction. Your website likely contains both first-party and third-party scripts, both of which can contribute to slow INP times.

A RUM tool like DebugBear can collect and surface this data. The main thing you want to look at is whether you mostly see your own website code or code from third parties.

1716368164 369 Optimizing Interaction To Next Paint A Step By Step GuideScreenshot of the INP Primary Script Domain Grouping in DebugBear, May 2024

Tip: When you see a script, or source code function marked as “N/A”, this can indicate that the script comes from a different origin and has additional security restrictions that prevent RUM tools from capturing more detailed information.

This now begins to tell a story: it appears that analytics/third-party scripts are the biggest contributors to the slow INP times.

5. Identify Why Those Scripts Are Running

At this point, you now have a strong suspicion that most of the INP delay, at least on the pages and elements you’re looking at, is due to third-party scripts. But how can you tell whether those are general tracking scripts or if they actually have a role in handling the interaction?

DebugBear offers a breakdown that helps see why the code is running, called the INP Primary Script Invoker breakdown. That’s a bit of a mouthful – multiple different scripts can be involved in slowing down an interaction, and here you just see the biggest contributor. The “Invoker” is just a value that the browser reports about what caused this code to run.

1716368165 263 Optimizing Interaction To Next Paint A Step By Step GuideScreenshot of the INP Primary Script Invoker Grouping in DebugBear, May 2024

The following invoker names are examples of page-wide event handlers:

  • onclick
  • onmousedown
  • onpointerup

You can see those a lot in the screenshot above, which tells you that the analytics script is tracking clicks anywhere on the page.

In contrast, if you saw invoker names like these that would indicate event handlers for a specific element on the page:

  • .load_more.onclick
  • #logo.onclick

6. Review Specific Page Views

A lot of the data you’ve seen so far is aggregated. It’s now time to look at the individual INP events, to form a definitive conclusion about what’s causing slow INP in this example.

Real user monitoring tools like DebugBear generally offer a way to review specific user experiences. For example, you can see what browser they used, how big their screen is, and what element led to the slowest interaction.

1716368165 545 Optimizing Interaction To Next Paint A Step By Step GuideScreenshot of a Page View in DebugBear Real User Monitoring, May 2024

As mentioned before, multiple scripts can contribute to overall slow INP. The INP Scripts section shows you the scripts that were run during the INP interaction:

1716368165 981 Optimizing Interaction To Next Paint A Step By Step GuideScreenshot of the DebugBear INP script breakdown, May 2024

You can review each of these scripts in more detail to understand why they run and what’s causing them to take longer to finish.

7. Use The DevTools Profiler For More Information

Real user monitoring tools have access to a lot of data, but for performance and security reasons they can access nowhere near all the available data. That’s why it’s a good idea to also use Chrome DevTools to measure your page performance.

To debug INP in DevTools you can measure how the browser processes one of the slow interactions you’ve identified before. DevTools then shows you exactly how the browser is spending its time handling the interaction.

1716368165 526 Optimizing Interaction To Next Paint A Step By Step GuideScreenshot of a performance profile in Chrome DevTools, May 2024

How You Might Resolve This Issue

In this example, you or your development team could resolve this issue by:

  • Working with the third-party script provider to optimize their script.
  • Removing the script if it is not essential to the website, or finding an alternative provider.
  • Adjusting how your own code interacts with the script

How To Investigate High Input Delay

In the previous example most of the INP time was spent running code in response to the interaction. But often the browser is already busy running other code when a user interaction happens. When investigating the INP components you’ll then see a high input delay value.

This can happen for various reasons, for example:

  • The user interacted with the website while it was still loading.
  • A scheduled task is running on the page, for example an ongoing animation.
  • The page is loading and rendering new content.

To understand what’s happening, you can review the invoker name and the INP scripts section of individual user experiences.

1716368165 86 Optimizing Interaction To Next Paint A Step By Step GuideScreenshot of the INP Component breakdown within DebugBear, May 2024

In this screenshot, you can see that a timer is running code that coincides with the start of a user interaction.

The script can be opened to reveal the exact code that is run:

1716368165 114 Optimizing Interaction To Next Paint A Step By Step GuideScreenshot of INP script details in DebugBear, May 2024

The source code shown in the previous screenshot comes from a third-party user tracking script that is running on the page.

At this stage, you and your development team can continue with the INP workflow presented earlier in this article. For example, debugging with browser DevTools or contacting the third-party provider for support.

How To Investigate High Presentation Delay

Presentation delay tends to be more difficult to debug than input delay or processing time. Often it’s caused by browser behavior rather than a specific script. But as before, you still start by identifying a specific page and a specific interaction.

You can see an example interaction with high presentation delay here:

1716368165 665 Optimizing Interaction To Next Paint A Step By Step GuideScreenshot of the an interaction with high presentation delay, May 2024

You see that this happens when the user enters text into a form field. In this example, many visitors pasted large amounts of text that the browser had to process.

Here the fix was to delay the processing, show a “Waiting…” message to the user, and then complete the processing later on. You can see how the INP score improves from May 3:

1716368165 845 Optimizing Interaction To Next Paint A Step By Step GuideScreenshot of an Interaction to Next Paint timeline in DebugBear, May 2024

Get The Data You Need To Improve Interaction To Next Paint

Setting up real user monitoring helps you understand how users experience your website and what you can do to improve it. Try DebugBear now by signing up for a free 14-day trial.

1716368165 494 Optimizing Interaction To Next Paint A Step By Step GuideScreenshot of the DebugBear Core Web Vitals dashboard, May 2024

Google’s CrUX data is aggregated over a 28-day period, which means that it’ll take a while before you notice a regression. With real-user monitoring you can see the impact of website changes right away and get alerted automatically when there’s a big change.

DebugBear monitors lab data, CrUX data, and real user data. That way you have all the data you need to optimize your Core Web Vitals in one place.

This article has been sponsored by DebugBear, and the views presented herein represent the sponsor’s perspective.

Ready to start optimizing your website? Sign up for DebugBear and get the data you need to deliver great user experiences.


Image Credits

Featured Image: Image by Redesign.co. Used with permission.

Source link

Keep an eye on what we are doing
Be the first to get latest updates and exclusive content straight to your email inbox.
We promise not to spam you. You can unsubscribe at any time.
Invalid email address
Continue Reading

Trending