SEO
How To Use The Speed Test Tool

With so many tools and applications available for our industry, it is impossible to know about every single one.
There are questions about what they do, how much they cost, what they are used for, and so many other questions that plague us when we’re looking for a tool to help us solve problems.
Today, we will go over GTmetrix, the speed test tool.
We will review the uses, how to use the tool, and what to do with the output.
What Is GTmetrix?
GTmetrix is a web-based tool that provides an analysis of website speed.
It will analyze a site’s load time, size, and requests happening, and then generate a score with recommendations to improve it.
This tool can be used by site owners, engineers, SEO pros, and others to measure their site’s performance and look for room for improvement.
How To Use GTmetrix
The GTmetrix tool exists on a website that you can access online.
You don’t need an account to get started – but you will need one if you want to be able to edit the location and browser type.
To use GTmetrix, plug your URL into the website.
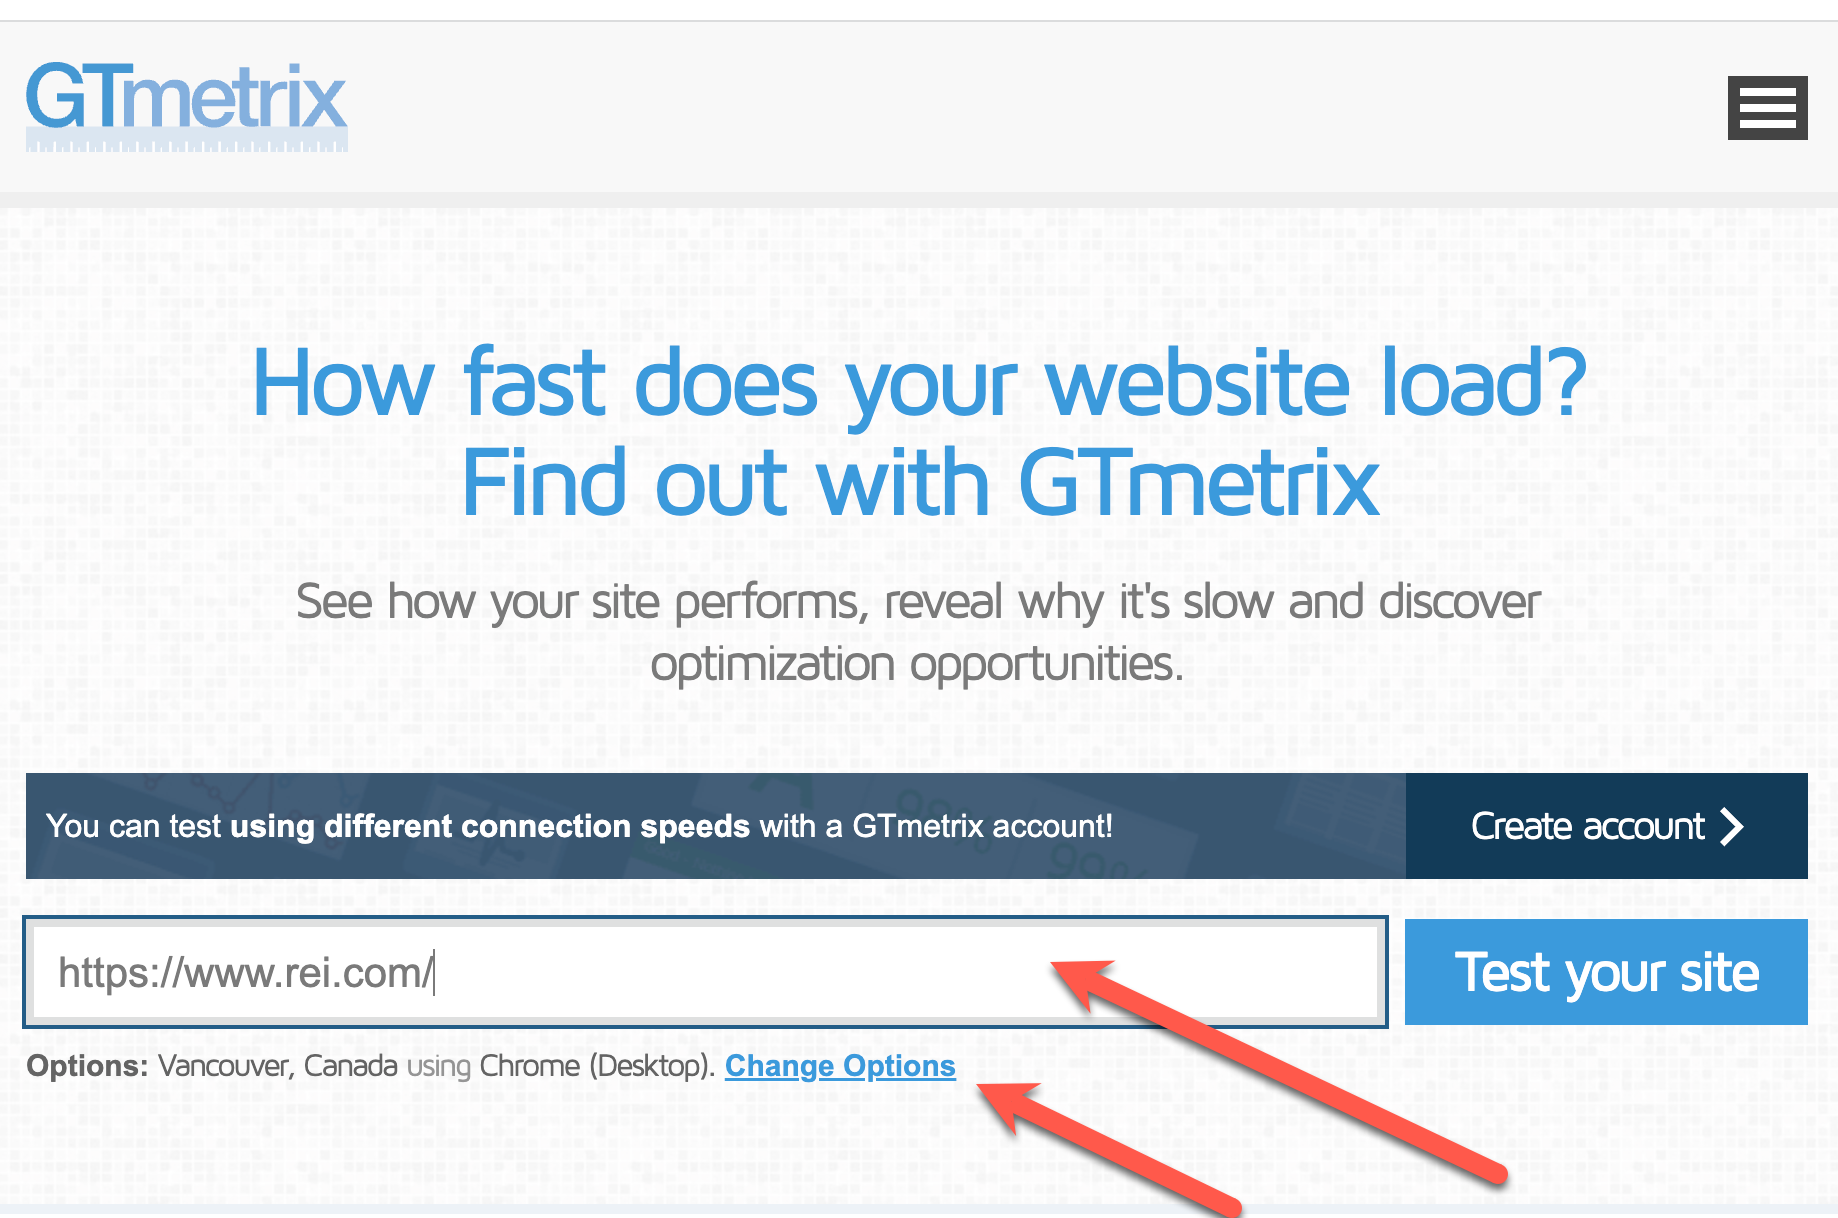 Screenshot from gtmetrix.com, February 2023
Once the report is complete, you can review the metrics provided (we will go into more detail about the meaning of those below).
You will receive an overview of the GTmetrix Grade, Web Vitals, and a summary that shows the speed visualizations.
The speed visualization is a great way to see what your website looks like as it loads, layered in with the metrics overlayed.
At the bottom, the top issues are noted and broken out by total topics: First Contentful Paint (FCP), Largest Contentful Paint (LCP), Total Blocking Time (TBT), and Cumulative Layout Shift (CLS).
It also provides the level of impact, which is helpful for prioritization.
Although these are the first available after running the test, GTmetrix recommends you focus on specific audits found in the Structure tab.
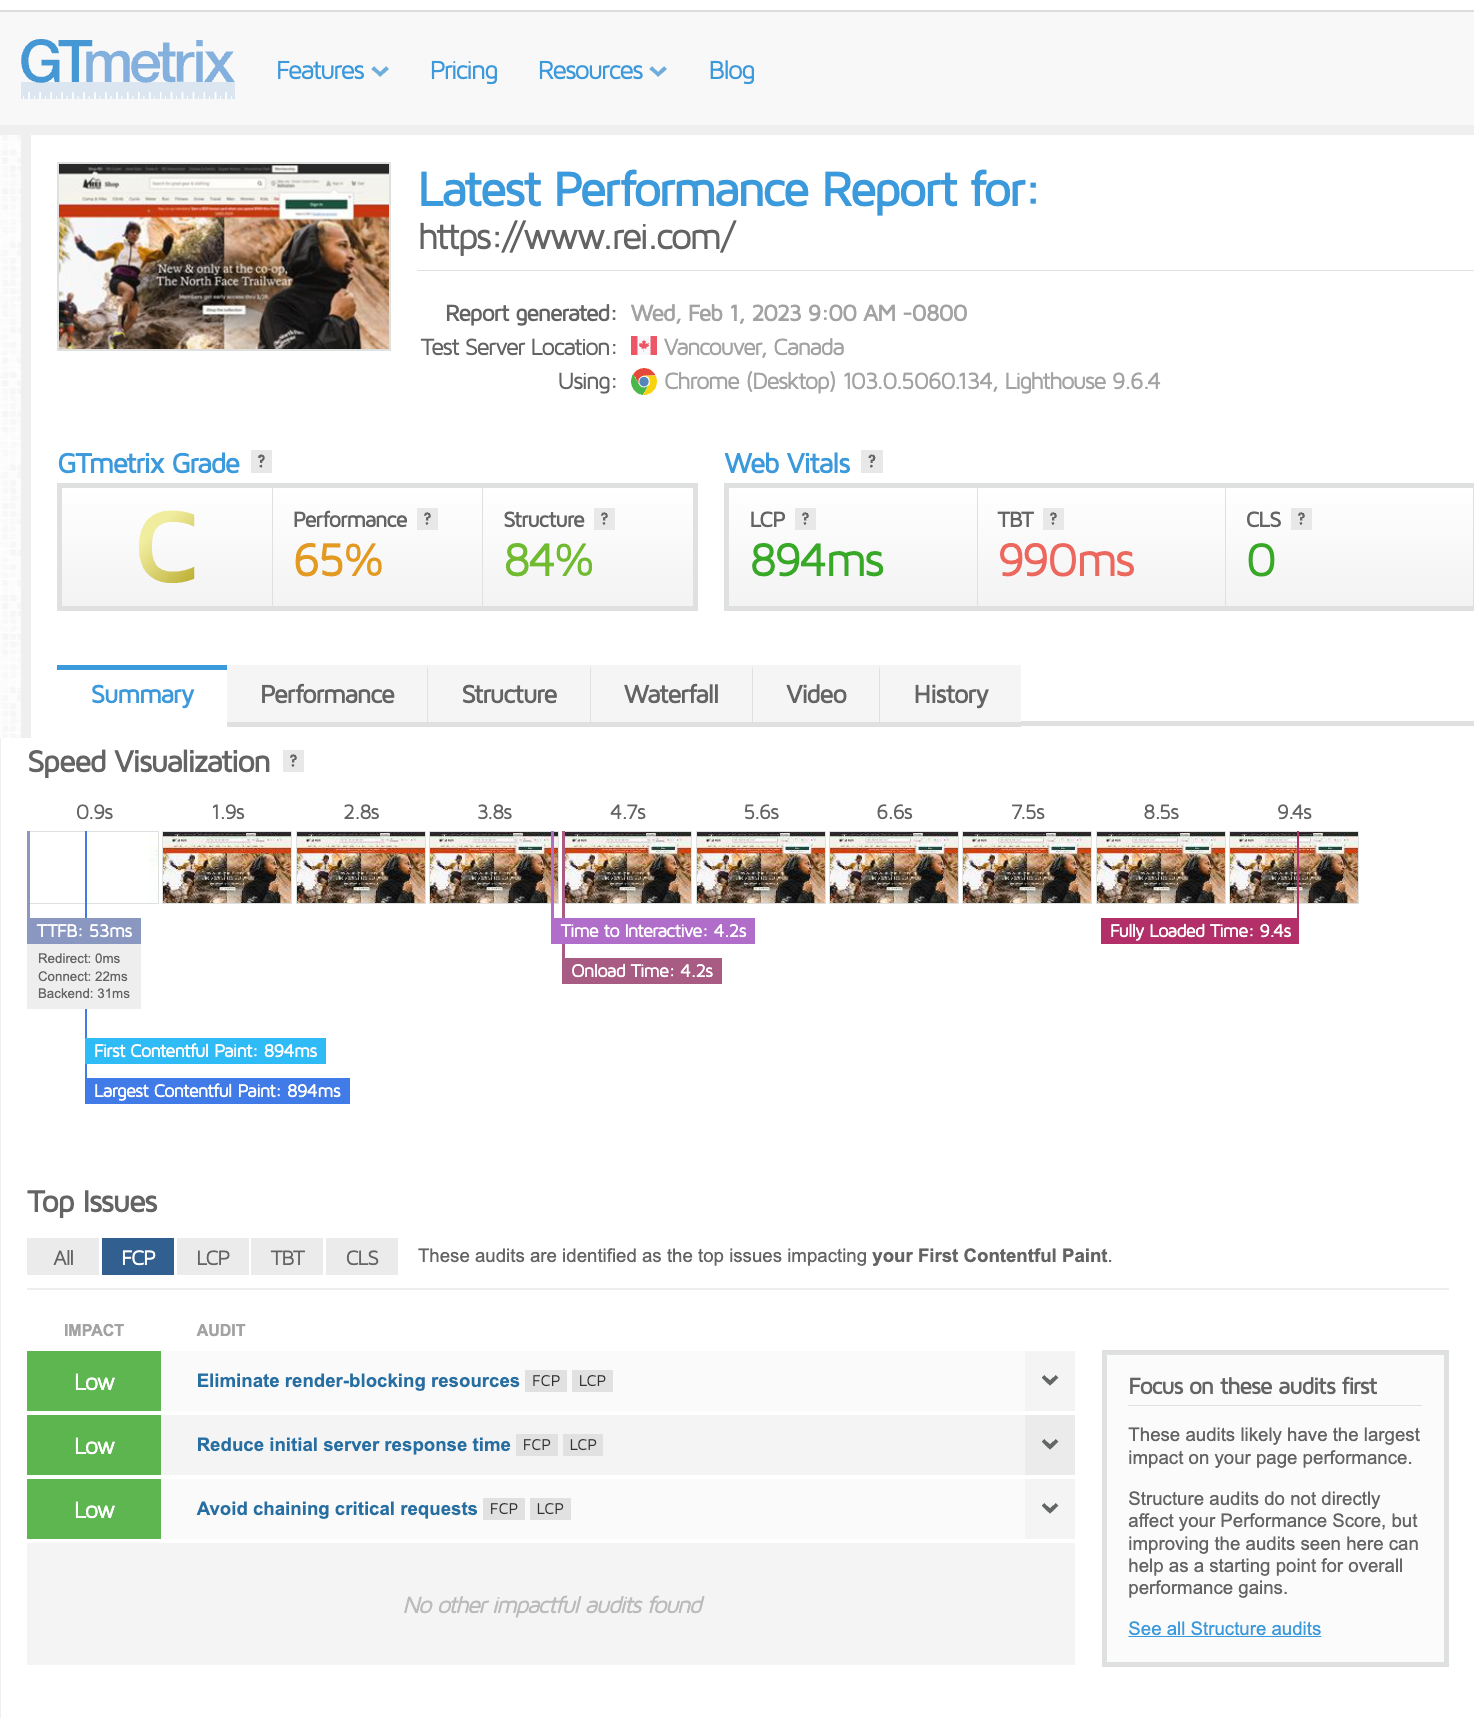 Screenshot from gtmetrix.com, February 2023
Let’s look at each of the different tabs within GTmetrix, and how they’re useful.
Performance Tab
The performance tab provides insight into various performance-based metrics, including things like FCP, Speed Index, CLS, and other metrics that are browser specific.
Structure Tab
This is the section that GTmetrix suggests you start with. This section outlines the tool’s various audits and the impact the items have.
There is detailed information available in each of these audits that shows what needs to be corrected.
Much of this information is technical, and if you need a better understanding, GTmetrix provides a “learn how to improve this” button that takes you to a wiki explaining in more detail how this issue impacts performance, how it works, and how to avoid it.
Here’s what’s really useful: it provides what level of experience is required to make these optimizations.
 Screenshot from gtmetrix.com, February 2023
Waterfall Tab
This tab illustrates a waterfall chart and the details of each action in a waterfall approach.
Here, you should pay attention to resources that take a long time to load.
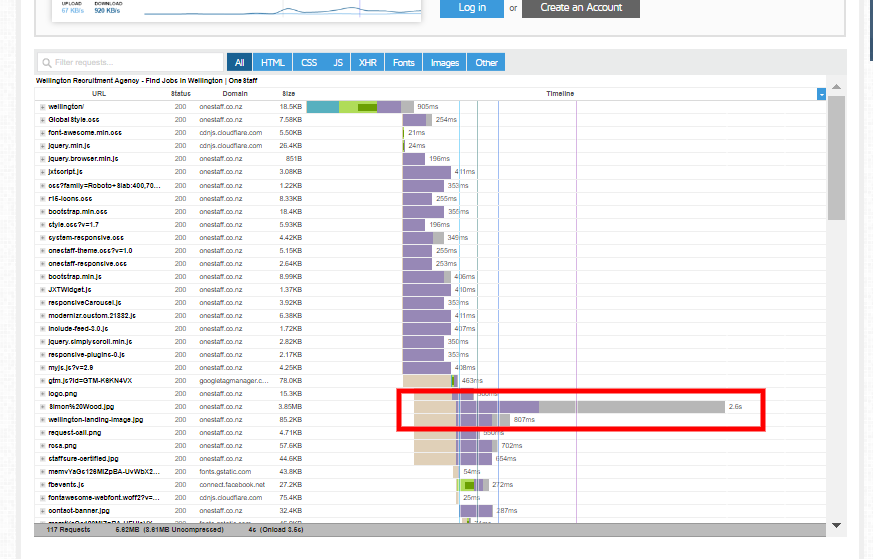 Screenshot from gtmetrix.com, February 2023
You can hover over the resource row and see a detailed breakdown of why the resource takes too long to load.
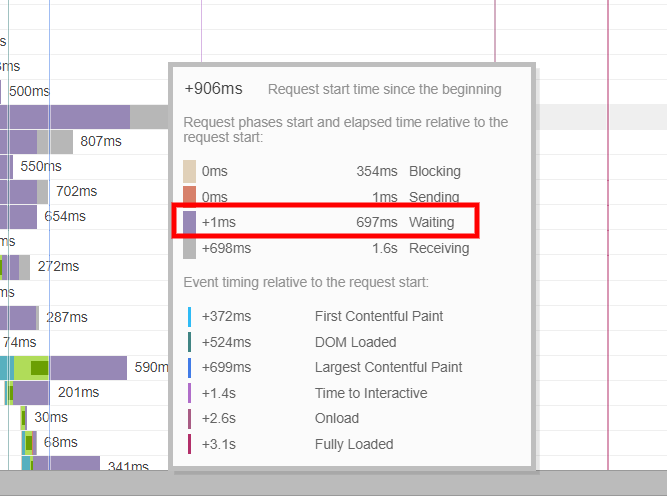 Screenshot from gtmetrix.com, February 2023
In this example, we see that, for the server, it took about 700ms to respond – which may indicate server issues that can be solved by using CDN for resources.
Video Tab
This tab provides the option to record a video of a page load and use it to pinpoint different issues with the page.
You will need an account to leverage this tool.
History Tab
Here you can view graphs that display changes over time to your page metrics like page sizes, time to interact, and scores.
This is a great way to measure your progress over time.
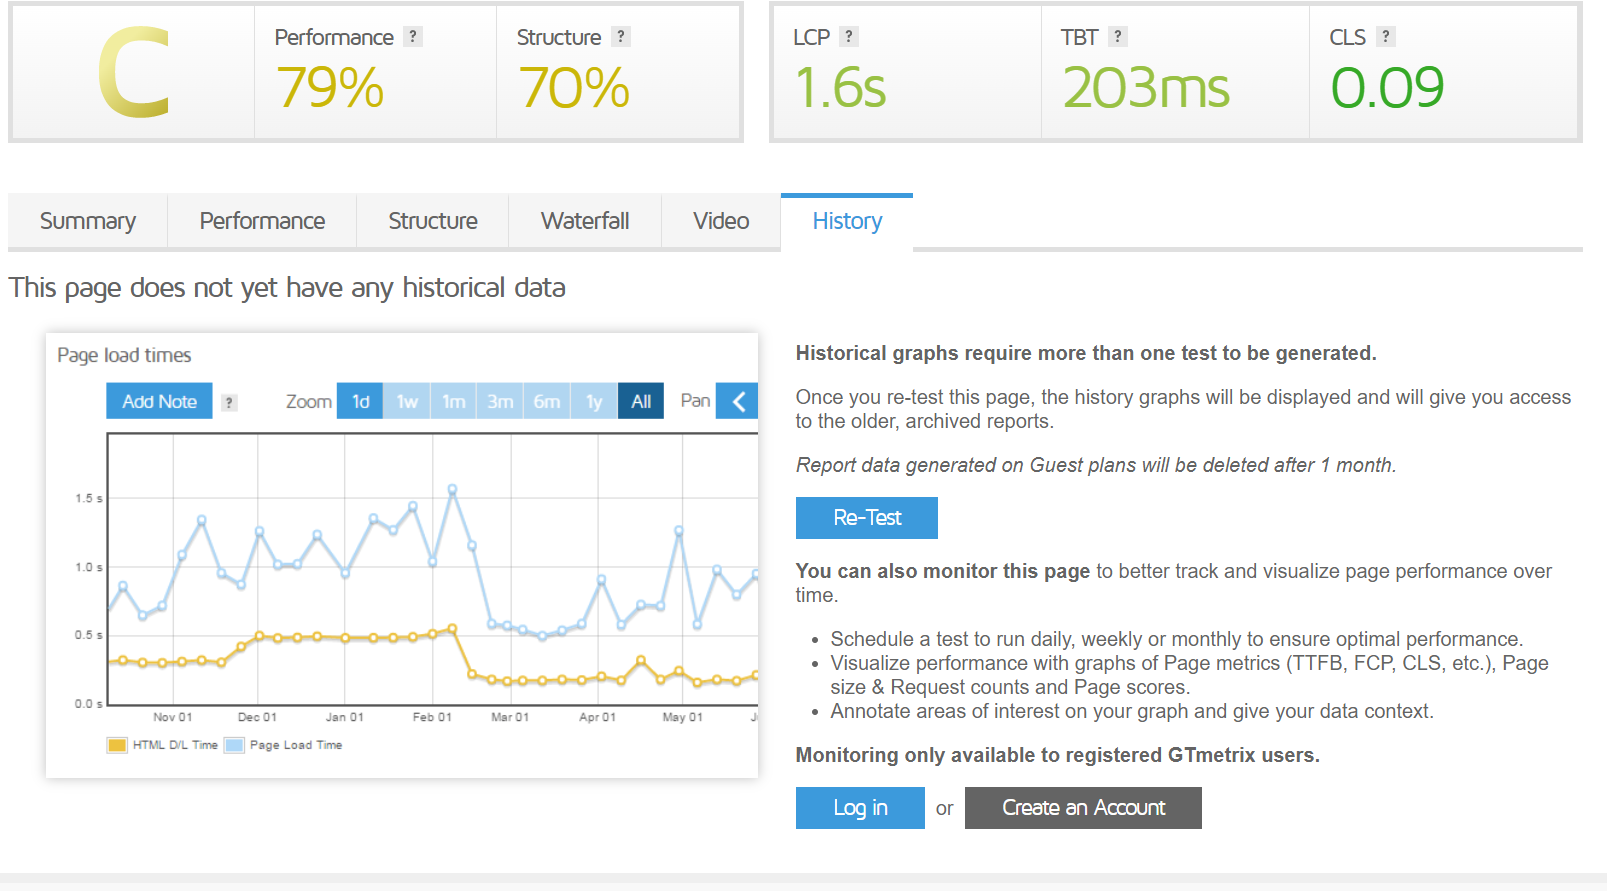 Screenshot from gtmetrix.com, February 2023
What GTmetrix Measurement Means
As we discussed above, GTmetrix produces an overall score as its output, but what it measures is essential, too.
GTmetrix Grade Overview
GTmetrix Grade
This is the metric that helps you understand the overall performance of your website.
The grade is determined by considering the users’ load time and the website’s architectural design.
A fast-loading website that is well-architected for performance is likely to receive a higher grade, while a slow site with longer load times or poor architectural design may receive a lower grade.
Performance Score
The performance score, as stated on the GTmetrix website, can be compared to a Lighthouse Performance Score.
This is useful information for anyone who wants to understand the metric and its relationship to other performance measures.
Structure
The structure rating combines GTmetrix’s proprietary assessment of its custom audits with the Lighthouse assessment.
The score represents how well the site is architected for performance.
 Screenshot from gtmetrix.com, February 2023
Web Vitals
This section highlights metrics that Google uses to determine if a website is generating what it refers to as “a delightful experience.”
Largest Contentful Paint (LCP)
LCP refers to the time it takes for the most significant element on your website page to load where the user can see it.
A good user experience would be 1.2 seconds or less.
Total Blocking Time (TBT)
TBT is a Lighthouse metric created to measure your website’s load responsiveness to user input.
It is meant to measure the amount of time that prevented the user from interacting.
This replaced First Input Delay (FID) that was used in PageSpeed Insights.
Cumulative Layout Shift (CLS)
CLS is the metric that measures unexpected shifting of page elements while the page is loading.
This metric is also used in Google’s Web Vitals.
This is meant to rate the stability of a webpage.
 Screenshot from gtmterix.com, February 2023
Conclusion
GTmetrix offers valuable insights and information to enhance the performance of your website.
It acts as a comprehensive tool to assess the well-being of your site and uncover factors affecting your search engine visibility.
By utilizing GTmetrix, you can take proactive steps to optimize and improve your online presence.
More Resources:
Featured Image: Billion Photos/Shutterstock


![How AEO Will Impact Your Business's Google Visibility in 2026 Why Your Small Business’s Google Visibility in 2026 Depends on AEO [Webinar]](https://articles.entireweb.com/wp-content/uploads/2026/01/How-AEO-Will-Impact-Your-Businesss-Google-Visibility-in-2026-400x240.png)
![How AEO Will Impact Your Business's Google Visibility in 2026 Why Your Small Business’s Google Visibility in 2026 Depends on AEO [Webinar]](https://articles.entireweb.com/wp-content/uploads/2026/01/How-AEO-Will-Impact-Your-Businesss-Google-Visibility-in-2026-80x80.png)


You must be logged in to post a comment Login