SEO
Cumulative Layout Shift – Overview of 2021 Google Ranking Factor via @sejournal, @martinibuster
Cumulative Layout Shift (CLS) is a Google metric that measures a user experience event and became a ranking factor in 2021.
That means it’s important to understand what CLS is and how to optimize for it.
Definition of Cumulative Layout Shift
What is Cumulative Layout Shift?
CLS is the unexpected shifting of webpage elements while the page is still downloading. The kinds of elements that tend to cause shift are fonts, images, videos, contact forms, buttons, and other kinds of content.
Minimizing CLS is important because pages that shift around can cause a poor user experience.
A poor CLS score is indicative of coding issues that can be solved.
Advertisement
Continue Reading Below
Why CLS Happens
According to Google, there are five reasons why Cumulative Layout Shift happens:
- Images without dimensions.
- Ads, embeds, and iframes without dimensions.
- Dynamically injected content.
- Web Fonts causing FOIT/FOUT.
- Actions waiting for a network response before updating DOM.
Images and videos need to have the height and width dimensions declared in the HTML. With regard to responsive images, make sure that the different images sizes for the different viewports use the same aspect ratio.
Advertisement
Continue Reading Below
Google recommends using AspectRatioCalculator.com to calculate the aspect ratios. It’s a good resource.
Ads Can Cause CLS
This one is a little tricky to deal with. One way to deal with ads that cause CLS is to style the element where the ad is going to show.
For example, if you style the div to have a specific height and width then the ad will be constrained to those.
There are two solutions if there’s a lack of inventory and an ad doesn’t show up.
If an element containing an ad does not show an ad, you can set it so that an alternative banner ad or placeholder image is used to fill the space.
Alternatively, for some layouts where an ad fills an entire row on the top of perhaps a column on the right or left gutter of a webpage, if the page does not show up there won’t be a shift. It won’t make a difference either on mobile or desktop. But that depends on the theme layout.
You’ll have to test that out if ad inventory is an issue.
Dynamically Injected Content
This is content that is injected into the webpage.
For example, in WordPress, you can link to a YouTube video or a Tweet and WordPress will display the video or tweet as an embedded object.
Advertisement
Continue Reading Below
Web-Based Fonts
Downloaded web fonts can cause what’s known as Flash of invisible text (FOIT) and Flash of Unstyled Text (FOUT).
A way to prevent that is to use rel=”preload” in the link for downloading that web font.
Lighthouse can help you diagnose what is causing CLS.
CLS Can Sneak in During Development
Cumulative layout shift can slip through during the development stage. What can happen is that many of the assets needed to render the page are loaded onto a browser’s cache.
The next time a developer or publisher visits the page under development, they won’t notice a layout shift because the page elements are already downloaded.
Advertisement
Continue Reading Below
That’s why it’s useful to have a measurement in the lab or in the field.
How Cumulative Layout Shift is Calculated
The calculation involves two metrics/events. The first is called Impact Fraction.
Impact Fraction
Impact fraction is a measurement of how much space an unstable element takes up in the viewport.
A viewport is what you see on the mobile screen.
When an element downloads and then shifts, the total space that the element occupied, from the location that it occupied in the viewport when it’s first rendered to the final location when the page is rendered.
Advertisement
Continue Reading Below
The example that Google uses is an element that occupies 50% of the viewport and then drops down by another 25%.
When added together, the 75% value is called the Impact Fraction and it’s expressed as a score of 0.75.
Distance Fraction
The second measurement is called the Distance Fraction. The distance fraction is the amount of space that the page element has moved from the original position to the final position.
In the above example, the page element moved 25%.
So now the Cumulative Layout Score is calculated by multiplying the Impact Fraction by the Distance Fraction:
0.75 x 0.25 = 0.1875
There’s some more math and other considerations that go into the calculation. What’s important to take away from this is that the score is one way to measure an important user experience factor.
Advertisement
Continue Reading Below
How to Measure CLS
There are two ways to measure CLS. Google calls the first way in the Lab. The second way is called in the Field.
In the lab means simulating an actual user downloading a webpage. Google uses a simulated Moto G4 for generating the CLS score within the lab environment.
Lab tools are best for understanding how a layout may perform before pushing it live to users. It gives publishers the opportunity to test a layout for issues.
Lab tools consist of Chrome Dev Tools and Lighthouse.
Understand Cumulative Layout Shift
It’s important to understand Cumulative Layout Shift. It’s not necessary to understand how to do the calculations yourself.
Advertisement
Continue Reading Below
But understanding what it means and how it works is key as this has now become part of the Core Web Vitals ranking factor.
Featured image credit: Paulo Bobita
SEO
brightonSEO Live Blog

Hello everyone. It’s April again, so I’m back in Brighton for another two days of Being the introvert I am, my idea of fun isn’t hanging around our booth all day explaining we’ve run out of t-shirts (seriously, you need to be fast if you want swag!). So I decided to do something useful and live-blog the event instead.
Follow below for talk takeaways and (very) mildly humorous commentary. sun, sea, and SEO!
SEO
Google Further Postpones Third-Party Cookie Deprecation In Chrome

Google has again delayed its plan to phase out third-party cookies in the Chrome web browser. The latest postponement comes after ongoing challenges in reconciling feedback from industry stakeholders and regulators.
The announcement was made in Google and the UK’s Competition and Markets Authority (CMA) joint quarterly report on the Privacy Sandbox initiative, scheduled for release on April 26.
Chrome’s Third-Party Cookie Phaseout Pushed To 2025
Google states it “will not complete third-party cookie deprecation during the second half of Q4” this year as planned.
Instead, the tech giant aims to begin deprecating third-party cookies in Chrome “starting early next year,” assuming an agreement can be reached with the CMA and the UK’s Information Commissioner’s Office (ICO).
The statement reads:
“We recognize that there are ongoing challenges related to reconciling divergent feedback from the industry, regulators and developers, and will continue to engage closely with the entire ecosystem. It’s also critical that the CMA has sufficient time to review all evidence, including results from industry tests, which the CMA has asked market participants to provide by the end of June.”
Continued Engagement With Regulators
Google reiterated its commitment to “engaging closely with the CMA and ICO” throughout the process and hopes to conclude discussions this year.
This marks the third delay to Google’s plan to deprecate third-party cookies, initially aiming for a Q3 2023 phaseout before pushing it back to late 2024.
The postponements reflect the challenges in transitioning away from cross-site user tracking while balancing privacy and advertiser interests.
Transition Period & Impact
In January, Chrome began restricting third-party cookie access for 1% of users globally. This percentage was expected to gradually increase until 100% of users were covered by Q3 2024.
However, the latest delay gives websites and services more time to migrate away from third-party cookie dependencies through Google’s limited “deprecation trials” program.
The trials offer temporary cookie access extensions until December 27, 2024, for non-advertising use cases that can demonstrate direct user impact and functional breakage.
While easing the transition, the trials have strict eligibility rules. Advertising-related services are ineligible, and origins matching known ad-related domains are rejected.
Google states the program aims to address functional issues rather than relieve general data collection inconveniences.
Publisher & Advertiser Implications
The repeated delays highlight the potential disruption for digital publishers and advertisers relying on third-party cookie tracking.
Industry groups have raised concerns that restricting cross-site tracking could push websites toward more opaque privacy-invasive practices.
However, privacy advocates view the phaseout as crucial in preventing covert user profiling across the web.
With the latest postponement, all parties have more time to prepare for the eventual loss of third-party cookies and adopt Google’s proposed Privacy Sandbox APIs as replacements.
Featured Image: Novikov Aleksey/Shutterstock
SEO
How To Write ChatGPT Prompts To Get The Best Results

ChatGPT is a game changer in the field of SEO. This powerful language model can generate human-like content, making it an invaluable tool for SEO professionals.
However, the prompts you provide largely determine the quality of the output.
To unlock the full potential of ChatGPT and create content that resonates with your audience and search engines, writing effective prompts is crucial.
In this comprehensive guide, we’ll explore the art of writing prompts for ChatGPT, covering everything from basic techniques to advanced strategies for layering prompts and generating high-quality, SEO-friendly content.
Writing Prompts For ChatGPT
What Is A ChatGPT Prompt?
A ChatGPT prompt is an instruction or discussion topic a user provides for the ChatGPT AI model to respond to.
The prompt can be a question, statement, or any other stimulus to spark creativity, reflection, or engagement.
Users can use the prompt to generate ideas, share their thoughts, or start a conversation.
ChatGPT prompts are designed to be open-ended and can be customized based on the user’s preferences and interests.
How To Write Prompts For ChatGPT
Start by giving ChatGPT a writing prompt, such as, “Write a short story about a person who discovers they have a superpower.”
ChatGPT will then generate a response based on your prompt. Depending on the prompt’s complexity and the level of detail you requested, the answer may be a few sentences or several paragraphs long.
Use the ChatGPT-generated response as a starting point for your writing. You can take the ideas and concepts presented in the answer and expand upon them, adding your own unique spin to the story.
If you want to generate additional ideas, try asking ChatGPT follow-up questions related to your original prompt.
For example, you could ask, “What challenges might the person face in exploring their newfound superpower?” Or, “How might the person’s relationships with others be affected by their superpower?”
Remember that ChatGPT’s answers are generated by artificial intelligence and may not always be perfect or exactly what you want.
However, they can still be a great source of inspiration and help you start writing.
Must-Have GPTs Assistant
I recommend installing the WebBrowser Assistant created by the OpenAI Team. This tool allows you to add relevant Bing results to your ChatGPT prompts.
This assistant adds the first web results to your ChatGPT prompts for more accurate and up-to-date conversations.
It is very easy to install in only two clicks. (Click on Start Chat.)
For example, if I ask, “Who is Vincent Terrasi?,” ChatGPT has no answer.
With WebBrower Assistant, the assistant creates a new prompt with the first Bing results, and now ChatGPT knows who Vincent Terrasi is.
 Screenshot from ChatGPT, March 2023
You can test other GPT assistants available in the GPTs search engine if you want to use Google results.
Master Reverse Prompt Engineering
ChatGPT can be an excellent tool for reverse engineering prompts because it generates natural and engaging responses to any given input.
By analyzing the prompts generated by ChatGPT, it is possible to gain insight into the model’s underlying thought processes and decision-making strategies.
One key benefit of using ChatGPT to reverse engineer prompts is that the model is highly transparent in its decision-making.
This means that the reasoning and logic behind each response can be traced, making it easier to understand how the model arrives at its conclusions.
Once you’ve done this a few times for different types of content, you’ll gain insight into crafting more effective prompts.
Prepare Your ChatGPT For Generating Prompts
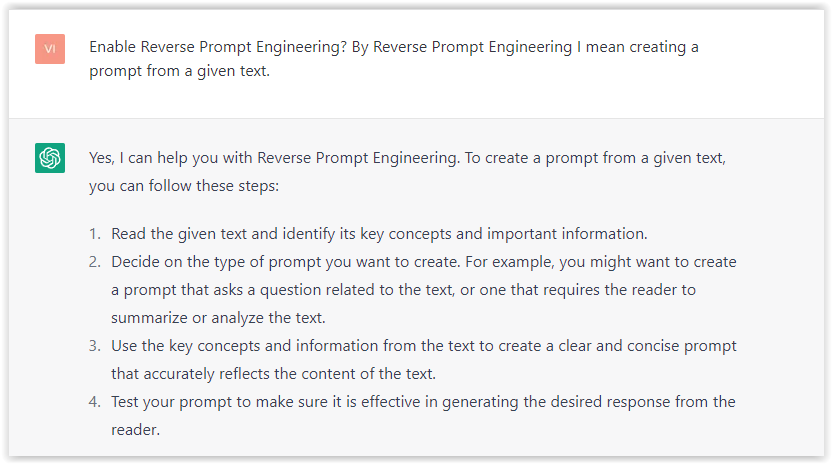
First, activate the reverse prompt engineering.
- Type the following prompt: “Enable Reverse Prompt Engineering? By Reverse Prompt Engineering I mean creating a prompt from a given text.”
 Screenshot from ChatGPT, March 2023
ChatGPT is now ready to generate your prompt. You can test the product description in a new chatbot session and evaluate the generated prompt.
- Type: “Create a very technical reverse prompt engineering template for a product description about iPhone 11.”
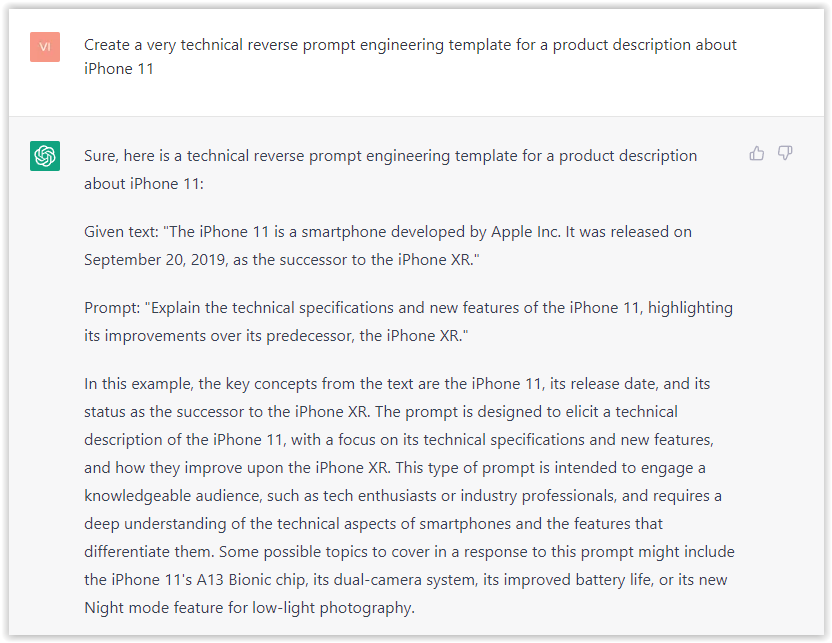 Screenshot from ChatGPT, March 2023
The result is amazing. You can test with a full text that you want to reproduce. Here is an example of a prompt for selling a Kindle on Amazon.
- Type: “Reverse Prompt engineer the following {product), capture the writing style and the length of the text :
product =”
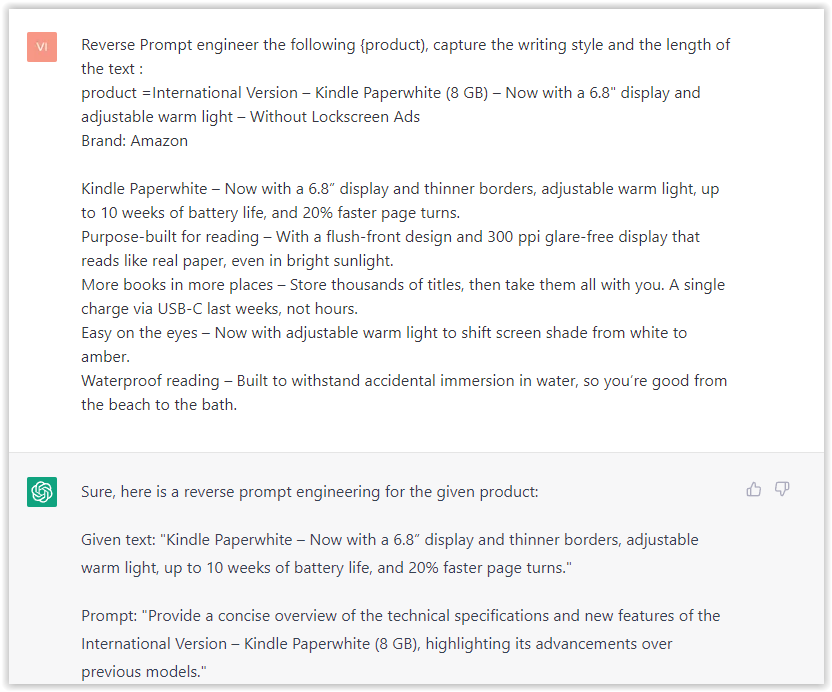 Screenshot from ChatGPT, March 2023
I tested it on an SEJ blog post. Enjoy the analysis – it is excellent.
- Type: “Reverse Prompt engineer the following {text}, capture the tone and writing style of the {text} to include in the prompt :
text = all text coming from https://www.searchenginejournal.com/google-bard-training-data/478941/”
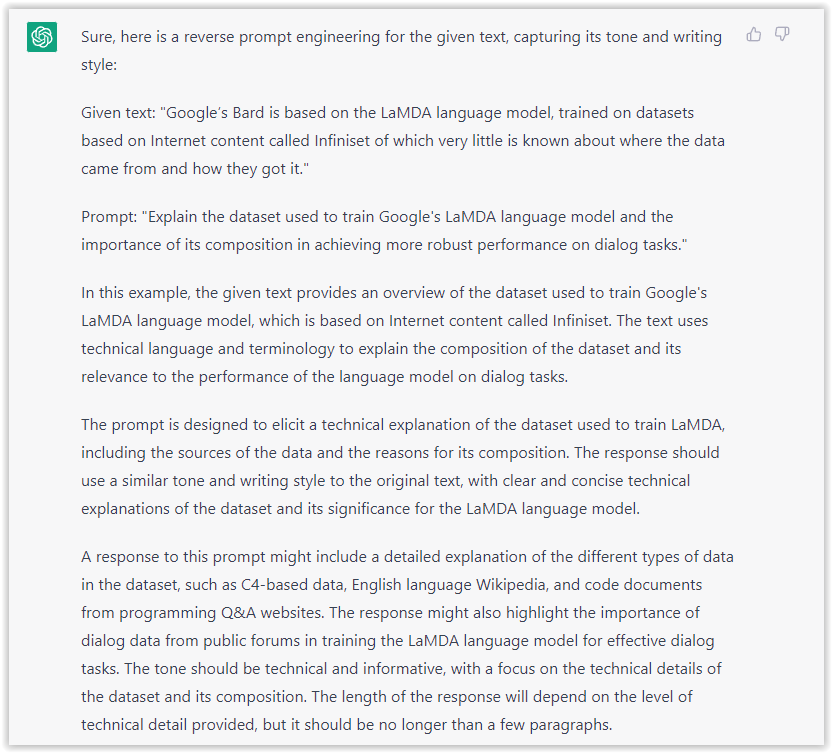 Screenshot from ChatGPT, March 2023
But be careful not to use ChatGPT to generate your texts. It is just a personal assistant.
Go Deeper
Prompts and examples for SEO:
- Keyword research and content ideas prompt: “Provide a list of 20 long-tail keyword ideas related to ‘local SEO strategies’ along with brief content topic descriptions for each keyword.”
- Optimizing content for featured snippets prompt: “Write a 40-50 word paragraph optimized for the query ‘what is the featured snippet in Google search’ that could potentially earn the featured snippet.”
- Creating meta descriptions prompt: “Draft a compelling meta description for the following blog post title: ’10 Technical SEO Factors You Can’t Ignore in 2024′.”
Important Considerations:
- Always Fact-Check: While ChatGPT can be a helpful tool, it’s crucial to remember that it may generate inaccurate or fabricated information. Always verify any facts, statistics, or quotes generated by ChatGPT before incorporating them into your content.
- Maintain Control and Creativity: Use ChatGPT as a tool to assist your writing, not replace it. Don’t rely on it to do your thinking or create content from scratch. Your unique perspective and creativity are essential for producing high-quality, engaging content.
- Iteration is Key: Refine and revise the outputs generated by ChatGPT to ensure they align with your voice, style, and intended message.
Additional Prompts for Rewording and SEO:
– Rewrite this sentence to be more concise and impactful.
– Suggest alternative phrasing for this section to improve clarity.
– Identify opportunities to incorporate relevant internal and external links.
– Analyze the keyword density and suggest improvements for better SEO.
Remember, while ChatGPT can be a valuable tool, it’s essential to use it responsibly and maintain control over your content creation process.
Experiment And Refine Your Prompting Techniques
Writing effective prompts for ChatGPT is an essential skill for any SEO professional who wants to harness the power of AI-generated content.
Hopefully, the insights and examples shared in this article can inspire you and help guide you to crafting stronger prompts that yield high-quality content.
Remember to experiment with layering prompts, iterating on the output, and continually refining your prompting techniques.
This will help you stay ahead of the curve in the ever-changing world of SEO.
More resources:
Featured Image: Tapati Rinchumrus/Shutterstock
-

 PPC6 days ago
19 Best SEO Tools in 2024 (For Every Use Case)
-

 MARKETING7 days ago
Ecommerce evolution: Blurring the lines between B2B and B2C
-
SEARCHENGINES5 days ago
Daily Search Forum Recap: April 19, 2024
-
SEARCHENGINES6 days ago
Daily Search Forum Recap: April 18, 2024
-
 WORDPRESS6 days ago
How to Make $5000 of Passive Income Every Month in WordPress
-

 SEO7 days ago
2024 WordPress Vulnerability Report Shows Errors Sites Keep Making
-
 WORDPRESS6 days ago
10 Amazing WordPress Design Resouces – WordPress.com News
-

 SEO6 days ago
25 WordPress Alternatives Best For SEO


