MARKETING
Content Assets: Score for Long-Term Success

Updated January 11, 2022
Want a balanced and actionable way to know whether your content is doing what it’s supposed to do?
Create a content scorecard.
A content scorecard allows for normalized scoring based on benchmarks determined by the performance of similar content in your industry or your company’s content standards.
It marries both qualitative and quantitative assessments. Quantitative scores are based on performance metrics such as views, engagement, SEO rank, etc. Qualitative scores are derived from predetermined criteria, such as readability, accuracy, and voice consistency (more on that in a bit).
A #content scorecard marries qualitative and quantitative assessments, says @lindroux via @CMIContent. Click To Tweet
Let’s get to work to create a content scorecard template you can adapt for your situation.
Establish your quantitative success indicators
First, you must measure what matters. What is the job for that piece of content?
For example, an index or landing page is rarely designed to be the final destination. If a reader spends too long on that kind of page, it’s likely not a good sign. On the other hand, a long time spent on a detailed article or white paper is a positive reflection of user engagement. Be specific with your content goals when deciding what to measure.
What should you measure based on the content’s purpose? Here are some ideas:
- Exposure – content views, impressions, backlinks
- Engagement – time spent on page, clicks, rating, comments
- Conversion – purchase, registration for gated content, return visits, click-throughs
- Redistribution – shares, pins
After you’ve identified your quantitative criteria, you need to identify the benchmarks. What are you measuring against? Industry standards? Internal standards? A little of both?
A good starting point for researching general user behavior standards is the Nielsen Norman Group. If you seek to focus on your industry, look at your industry marketing groups or even type something like “web metrics for best user experience in [INDUSTRY].”
Find out general web user behavior standards from @NNGroup research, advises @lindroux via @CMIContent. Click To Tweet
Below is a sample benchmark key. The left column identifies the metric, while the top row indicates the resulting score on a scale of 1 to 5. Each row lists the parameters for the metric to achieve the score in its column.
Sample Quantitative Content Score 1-5 *
| Score: | 1 | 2 | 3 | 4 | 5 |
| Page Views/Section Total | <2% | 2 – 3% | 3 – 4% | 4 – 5% | >5% |
| Return Visitors | <20% | 20 – 30% | 30 – 40% | 40 – 50% | >50% |
| Trend in Page Views | Decrease of >50% | Decrease | Static | Increase | Increase of >50% |
| Page Views/Visit | <1.2 | 1.2 – 1.8 | 1.9 – 2.1 | 2.2 – 2.8 | >2.8 |
| Time Spent/Page | <20 sec | 20 – 40 sec | 40 – 60 sec | 60 – 120 sec | >120 sec |
| Bounce Rate | >75% | 65 – 75% | 35 – 65 % | 25 – 35% | <25% |
| Links | 0 | 1 – 5 | 5 – 10 | 10 – 15 | >15 |
| SEO | <35% | 35 – 45% | 45 – 55% | 55 – 65% | >65% |
*Values should be defined based on industry or company benchmarks.
Using a 1-to-5 scale makes it easier to analyze content that may have different goals and still identify the good, the bad, and the ugly. Your scorecard may look different depending on the benchmarks you select.
How to document it
You will create two quantitative worksheets.
Label the first one as “Quantitative benchmarks.” Create a chart (similar to the one above) tailored to identify your key metrics and the ranges needed to achieve each score. Use this as your reference sheet.
Label a new worksheet as “Quantitative analysis.” Your first columns should be content URL, topic, and type. Label the next columns based on your quantitative metrics (i.e., page views, return visitors, trend in page views).
After adding the details for each piece of content, add the score for each one in the corresponding columns.
Remember, the 1-to-5 rating is based on the objective standards you documented on the quantitative reference worksheet.
Determine your qualitative analytics
It’s easy to look at your content’s metrics, shrug, and say, “Let’s get rid of everything that’s not getting eyeballs.” But if you do, you risk throwing out great content whose only fault may be it hasn’t been discovered. Scoring your content qualitatively (using a different five-point scale) helps you identify valuable pieces that might otherwise be buried in the long tail.
In this content scorecard process, a content strategist or someone equally qualified on your team/agency analyzes the content based on your objectives.
TIP: Have the same person review all the content to avoid any variance in qualitative scoring standards.
Here are some qualitative criteria we’ve used:
- Consistency – Is the content consistent with the brand voice and style?
- Clarity and accuracy – Is the content understandable, accurate, and current?
- Discoverability – Does the layout of the information support key information flows?
- Engagement – Does the content use the appropriate techniques to influence or engage visitors?
- Relevance – Does the content meet the needs of all intended user types?
To standardize the assessment, use yes-no questions. One point is earned for every yes. No point is earned for a no. The average qualitative score is then determined by adding up the yes points and dividing the total by the number of questions for the category.
To standardize a qualitative #content assessment, use yes-no questions, says @lindroux via @CMIContent. Click To Tweet
The following illustrates how this would be done for the clarity and accuracy category as well as discoverability. Bold indicates a yes answer.
Clarity and accuracy: Is the content understandable, accurate, and current?
- Is the content understandable to all user types?
- Does it use appropriate language?
- Is content labeled clearly?
- Do images, video, and audio meet technical standards so they are clear?
Score: 3/4 * 5 = 3.8
Discoverability: Does the layout of information on the page support key information flows? Is the user pathway to related answers and next steps clear and user-friendly?
Score: 1/5 * 5 = 1.0
TIP: Tailor the questions in the relevance category based on the information you can access. For example, if the reviewer knows the audience, the question, “Is it relevant to the interests of the viewers,” is valid. If the reviewer doesn’t know the audience, then don’t ask that question. But almost any reviewer can answer if the content is current. So that would be a valid question to analyze.
How to document it
Create two qualitative worksheets.
Label the first worksheet “Qualitative questions.”
The first columns are the content URL, topic, and type. Then section the columns for each category and its questions. Add the average formula to the cell under each category label.
Let’s illustrate this following on the example above:
After the content details, label the next column “Clarity and accuracy,” and add a column for each of the four corresponding questions.
Then go through each content piece and question, inputting a 1 for yes and a 0 for no.
To calculate the average rating for clarity and accuracy, input this formula into the cell “=(B5+B6+B7+B8)/4” to determine the average for the first piece of content.
For simpler viewing, create a new worksheet labeled “Qualitative analysis.” Include only the content information accompanied by the category averages in each subsequent column.
Put it all together
With your quantitative and qualitative measurements determined, you now can create your scorecard spreadsheet.
Here’s what it would look like based on the earlier example (minus the specific content URLs).
Qualitative Scores |
|||||
| Article A | Article B | Article C | Article D | Article E | |
| Brand voice/style | 5 | 1 | 2 | 3 | 1 |
| Accuracy/currency? | 4 | 2 | 3 | 2 | 2 |
| Discoverability | 3 | 3 | 3 | 3 | 3 |
| Engagement | 4 | 2 | 4 | 2 | 2 |
| Relevance | 3 | 3 | 5 | 3 | 3 |
| Average Qualitative Score | 3.8 | 2.2 | 3.4 | 2.6 | 2.2 |
Quantitative Scores |
|||||
| Exposure | 3 | 1 | 3 | 3 | 3 |
| Engagement | 2 | 2 | 2 | 2 | 2 |
| Conversion | 1 | 3 | 3 | 1 | 3 |
| Backlinks | 4 | 2 | 2 | 4 | 2 |
| SEO % | 2 | 3 | 3 | 2 | 3 |
| Average Quantitative Score | 2.4 | 2.2 | 2.6 | 2.4 | 2.6 |
| Average Qualitative Score | 3.8 | 2.2 | 3.4 | 2.6 | 2.2 |
| Recommended Action | Review and improve | Remove and avoid | Reconsider distribution plan | Reconsider distribution plan | Review and improve |
On the scorecard, an “average” column has been added. It is calculated by totaling the numbers for each category and dividing it by the total number of categories.
Now you have a side-by-side comparison of each content URL’s average quantitative and qualitative scores. Here’s how to analyze the numbers and then optimize your content:
- Qualitative score higher than a quantitative score: Analyze your distribution plan. Consider alternative times, channels, or formats for this otherwise “good” content.
- Quantitative score higher than a qualitative score: Review the content to identify ways to improve it. Could its quality be improved with a rewrite? What about the addition of data-backed research?
- Low quantitative and qualitative scores: Remove this content from circulation and adapt your content plan to avoid this type of content in the future.
- High quantitative and qualitative scores: Promote and reuse this content as much as feasible. Update your content plan to replicate this type of content in the future.
Of course, there are times when the discrepancy between quantitative and qualitative scores may indicate that the qualitative assessment is off. Use your judgment, but at least consider the alternatives.
HANDPICKED RELATED CONTENT:
Get going
When should you create a content scorecard? While it may seem like a daunting task, don’t let that stop you. Don’t wait until the next big migration. Take bite-size chunks and make it an ongoing process. Start now and optimize every quarter, then the process won’t feel quite so Herculean.
Selecting how much and what content should be evaluated depends largely on the variety of content types and the consistency of content within the same type. You need to select a sufficient number of content pieces to see patterns in topic, content type, traffic, etc.
Though there is no hard and fast science to sample size, in our experience 100 to 200 content assets were sufficient. Your number will depend on:
- Total inventory size
- Consistency within a content type
- Frequency of audits
Review in batches so you don’t get overwhelmed. Set evaluation cycles and look at batches quarterly, revising, retiring, or repurposing your content based on the audit results every time. And remember to select content across the performance spectrum. If you only focus on high-performing content, you won’t identify the hidden gems.
HANDPICKED RELATED CONTENT:
Cover image by Joseph Kalinowski/Content Marketing Institute
MARKETING
How to Use AI For a More Effective Social Media Strategy, According to Ross Simmonds

Welcome to Creator Columns, where we bring expert HubSpot Creator voices to the Blogs that inspire and help you grow better.
It’s the age of AI, and our job as marketers is to keep up.
My team at Foundation Marketing recently conducted an AI Marketing study surveying hundreds of marketers, and more than 84% of all leaders, managers, SEO experts, and specialists confirmed that they used AI in the workplace.
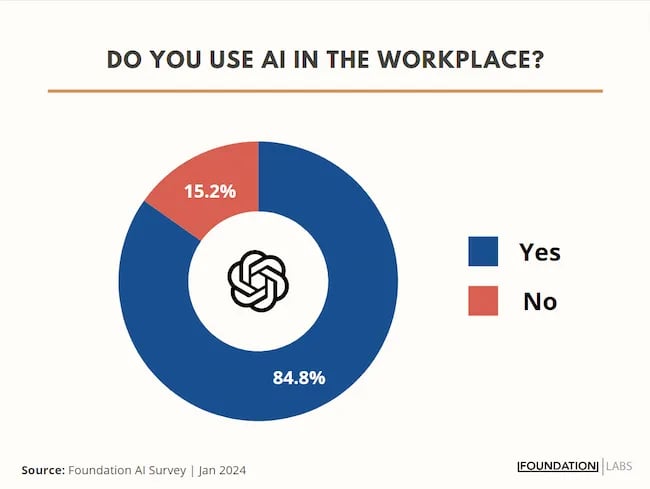
If you can overlook the fear-inducing headlines, this technology is making social media marketers more efficient and effective than ever. Translation: AI is good news for social media marketers.
In fact, I predict that the marketers not using AI in their workplace will be using it before the end of this year, and that number will move closer and closer to 100%.
Social media and AI are two of the most revolutionizing technologies of the last few decades. Social media has changed the way we live, and AI is changing the way we work.
So, I’m going to condense and share the data, research, tools, and strategies that the Foundation Marketing Team and I have been working on over the last year to help you better wield the collective power of AI and social media.
Let’s jump into it.
What’s the role of AI in social marketing strategy?
In a recent episode of my podcast, Create Like The Greats, we dove into some fascinating findings about the impact of AI on marketers and social media professionals. Take a listen here:
Let’s dive a bit deeper into the benefits of this technology:
Benefits of AI in Social Media Strategy
AI is to social media what a conductor is to an orchestra — it brings everything together with precision and purpose. The applications of AI in a social media strategy are vast, but the virtuosos are few who can wield its potential to its fullest.
AI to Conduct Customer Research
Imagine you’re a modern-day Indiana Jones, not dodging boulders or battling snakes, but rather navigating the vast, wild terrain of consumer preferences, trends, and feedback.
This is where AI thrives.
Using social media data, from posts on X to comments and shares, AI can take this information and turn it into insights surrounding your business and industry. Let’s say for example you’re a business that has 2,000 customer reviews on Google, Yelp, or a software review site like Capterra.
Leveraging AI you can now have all 2,000 of these customer reviews analyzed and summarized into an insightful report in a matter of minutes. You simply need to download all of them into a doc and then upload them to your favorite Generative Pre-trained Transformer (GPT) to get the insights and data you need.
But that’s not all.
You can become a Prompt Engineer and write ChatGPT asking it to help you better understand your audience. For example, if you’re trying to come up with a persona for people who enjoy marathons but also love kombucha you could write a prompt like this to ChatGPT:

The response that ChatGPT provided back is quite good:
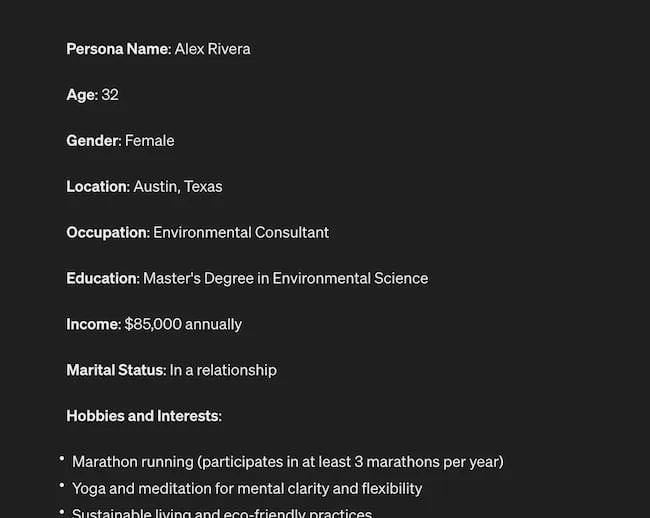
Below this it went even deeper by including a lot of valuable customer research data:
- Demographics
- Psychographics
- Consumer behaviors
- Needs and preferences
And best of all…
It also included marketing recommendations.
The power of AI is unbelievable.
Social Media Content Using AI
AI’s helping hand can be unburdening for the creative spirit.
Instead of marketers having to come up with new copy every single month for posts, AI Social Caption generators are making it easier than ever to craft catchy status updates in the matter of seconds.
Tools like HubSpot make it as easy as clicking a button and telling the AI tool what you’re looking to create a post about:
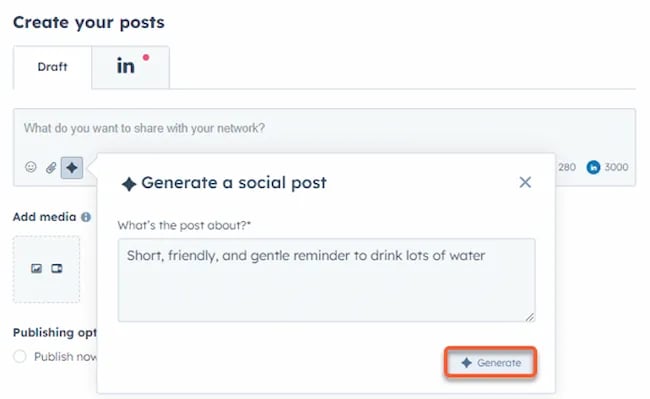
The best part of these AI tools is that they’re not limited to one channel.
Your AI social media content assistant can help you with LinkedIn content, X content, Facebook content, and even the captions that support your post on Instagram.
It can also help you navigate hashtags:
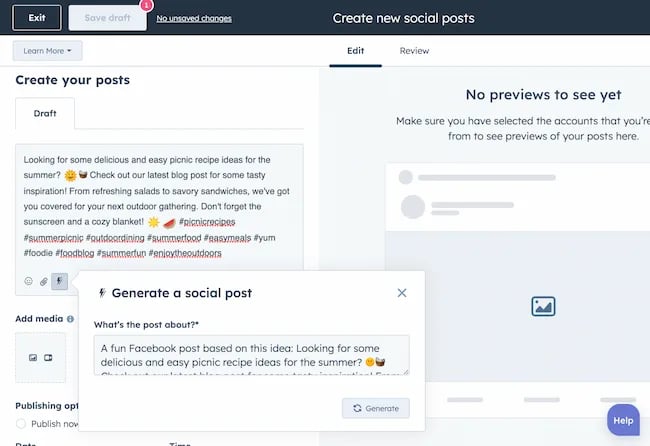
With AI social media tools that generate content ideas or even write posts, it’s not about robots replacing humans. It’s about making sure that the human creators on your team are focused on what really matters — adding that irreplaceable human touch.
Enhanced Personalization
You know that feeling when a brand gets you, like, really gets you?
AI makes that possible through targeted content that’s tailored with a level of personalization you’d think was fortune-telling if the data didn’t paint a starker, more rational picture.
What do I mean?
Brands can engage more quickly with AI than ever before. In the early 2000s, a lot of brands spent millions of dollars to create social media listening rooms where they would hire social media managers to find and engage with any conversation happening online.
Thanks to AI, brands now have the ability to do this at scale with much fewer people all while still delivering quality engagement with the recipient.
Analytics and Insights
Tapping into AI to dissect the data gives you a CSI-like precision to figure out what works, what doesn’t, and what makes your audience tick. It’s the difference between guessing and knowing.
The best part about AI is that it can give you almost any expert at your fingertips.
If you run a report surrounding the results of your social media content strategy directly from a site like LinkedIn, AI can review the top posts you’ve shared and give you clear feedback on what type of content is performing, why you should create more of it, and what days of the week your content is performing best.
This type of insight that would typically take hours to understand.
Now …
Thanks to the power of AI you can upload a spreadsheet filled with rows and columns of data just to be met with a handful of valuable insights a few minutes later.
Improved Customer Service
Want 24/7 support for your customers?
It’s now possible without human touch.
Chatbots powered by AI are taking the lead on direct messaging experiences for brands on Facebook and other Meta properties to offer round-the-clock assistance.
The fact that AI can be trained on past customer queries and data to inform future queries and problems is a powerful development for social media managers.
Advertising on Social Media with AI
The majority of ad networks have used some variation of AI to manage their bidding system for years. Now, thanks to AI and its ability to be incorporated in more tools, brands are now able to use AI to create better and more interesting ad campaigns than ever before.
Brands can use AI to create images using tools like Midjourney and DALL-E in seconds.
Brands can use AI to create better copy for their social media ads.
Brands can use AI tools to support their bidding strategies.
The power of AI and social media is continuing to evolve daily and it’s not exclusively found in the organic side of the coin. Paid media on social media is being shaken up due to AI just the same.
How to Implement AI into Your Social Media Strategy
Ready to hit “Go” on your AI-powered social media revolution?
Don’t just start the engine and hope for the best. Remember the importance of building a strategy first. In this video, you can learn some of the most important factors ranging from (but not limited to) SMART goals and leveraging influencers in your day-to-day work:
The following seven steps are crucial to building a social media strategy:
- Identify Your AI and Social Media Goals
- Validate Your AI-Related Assumptions
- Conduct Persona and Audience Research
- Select the Right Social Channels
- Identify Key Metrics and KPIs
- Choose the Right AI Tools
- Evaluate and Refine Your Social Media and AI Strategy
Keep reading, roll up your sleeves, and follow this roadmap:
1. Identify Your AI and Social Media Goals
If you’re just dipping your toes into the AI sea, start by defining clear objectives.
Is it to boost engagement? Streamline your content creation? Or simply understand your audience better? It’s important that you spend time understanding what you want to achieve.
For example, say you’re a content marketing agency like Foundation and you’re trying to increase your presence on LinkedIn. The specificity of this goal will help you understand the initiatives you want to achieve and determine which AI tools could help you make that happen.
Are there AI tools that will help you create content more efficiently? Are there AI tools that will help you optimize LinkedIn Ads? Are there AI tools that can help with content repurposing? All of these things are possible and having a goal clearly identified will help maximize the impact. Learn more in this Foundation Marketing piece on incorporating AI into your content workflow.
Once you have identified your goals, it’s time to get your team on board and assess what tools are available in the market.
Recommended Resources:
2. Validate Your AI-Related Assumptions
Assumptions are dangerous — especially when it comes to implementing new tech.
Don’t assume AI is going to fix all your problems.
Instead, start with small experiments and track their progress carefully.
3. Conduct Persona and Audience Research
Social media isn’t something that you can just jump into.
You need to understand your audience and ideal customers. AI can help with this, but you’ll need to be familiar with best practices. If you need a primer, this will help:
Once you understand the basics, consider ways in which AI can augment your approach.
4. Select the Right Social Channels
Not every social media channel is the same.
It’s important that you understand what channel is right for you and embrace it.
The way you use AI for X is going to be different from the way you use AI for LinkedIn. On X, you might use AI to help you develop a long-form thread that is filled with facts and figures. On LinkedIn however, you might use AI to repurpose a blog post and turn it into a carousel PDF. The content that works on X and that AI can facilitate creating is different from the content that you can create and use on LinkedIn.
The audiences are different.
The content formats are different.
So operate and create a plan accordingly.
Recommended Tools and Resources:
5. Identify Key Metrics and KPIs
What metrics are you trying to influence the most?
Spend time understanding the social media metrics that matter to your business and make sure that they’re prioritized as you think about the ways in which you use AI.
These are a few that matter most:
- Reach: Post reach signifies the count of unique users who viewed your post. How much of your content truly makes its way to users’ feeds?
- Clicks: This refers to the number of clicks on your content or account. Monitoring clicks per campaign is crucial for grasping what sparks curiosity or motivates people to make a purchase.
- Engagement: The total social interactions divided by the number of impressions. This metric reveals how effectively your audience perceives you and their readiness to engage.
Of course, it’s going to depend greatly on your business.
But with this information, you can ensure that your AI social media strategy is rooted in goals.
6. Choose the Right AI Tools
The AI landscape is filled with trash and treasure.
Pick AI tools that are most likely to align with your needs and your level of tech-savviness.
For example, if you’re a blogger creating content about pizza recipes, you can use HubSpot’s AI social caption generator to write the message on your behalf:
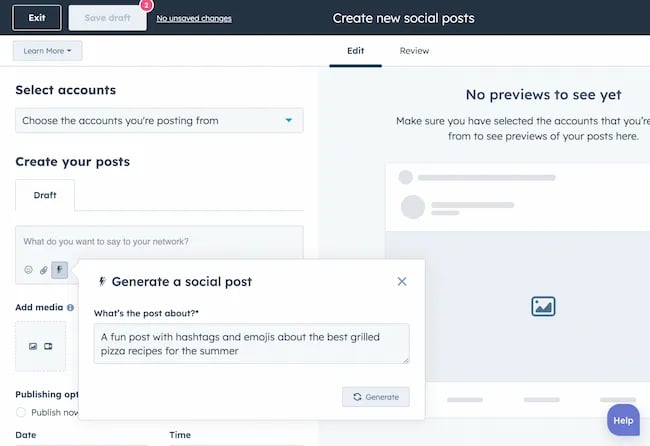
The benefit of an AI tool like HubSpot and the caption generator is that what at one point took 30-40 minutes to come up with — you can now have it at your fingertips in seconds. The HubSpot AI caption generator is trained on tons of data around social media content and makes it easy for you to get inspiration or final drafts on what can be used to create great content.
Consider your budget, the learning curve, and what kind of support the tool offers.
7. Evaluate and Refine Your Social Media and AI Strategy
AI isn’t a magic wand; it’s a set of complex tools and technology.
You need to be willing to pivot as things come to fruition.
If you notice that a certain activity is falling flat, consider how AI can support that process.
Did you notice that your engagement isn’t where you want it to be? Consider using an AI tool to assist with crafting more engaging social media posts.
Make AI Work for You — Now and in the Future
AI has the power to revolutionize your social media strategy in ways you may have never thought possible. With its ability to conduct customer research, create personalized content, and so much more, thinking about the future of social media is fascinating.
We’re going through one of the most interesting times in history.
Stay equipped to ride the way of AI and ensure that you’re embracing the best practices outlined in this piece to get the most out of the technology.
MARKETING
Advertising in local markets: A playbook for success

Many brands, such as those in the home services industry or a local grocery chain, market to specific locations, cities or regions. There are also national brands that want to expand in specific local markets.
Regardless of the company or purpose, advertising on a local scale has different tactics than on a national scale. Brands need to connect their messaging directly with the specific communities they serve and media to their target demo. Here’s a playbook to help your company succeed when marketing on a local scale.
1. Understand local vs. national campaigns
Local advertising differs from national campaigns in several ways:
- Audience specificity: By zooming in on precise geographic areas, brands can tailor messaging to align with local communities’ customs, preferences and nuances. This precision targeting ensures that your message resonates with the right target audience.
- Budget friendliness: Local advertising is often more accessible for small businesses. Local campaign costs are lower, enabling brands to invest strategically within targeted locales. This budget-friendly nature does not diminish the need for strategic planning; instead, it emphasizes allocating resources wisely to maximize returns. As a result, testing budgets can be allocated across multiple markets to maximize learnings for further market expansion.
- Channel selection: Selecting the correct channels is vital for effective local advertising. Local newspapers, radio stations, digital platforms and community events each offer advantages. The key lies in understanding where your target audience spends time and focusing efforts to ensure optimal engagement.
- Flexibility and agility: Local campaigns can be adjusted more swiftly in response to market feedback or changes, allowing brands to stay relevant and responsive.
Maintaining brand consistency across local touchpoints reinforces brand identity and builds a strong, recognizable brand across markets.
2. Leverage customized audience segmentation
Customized audience segmentation is the process of dividing a market into distinct groups based on specific demographic criteria. This marketing segmentation supports the development of targeted messaging and media plans for local markets.
For example, a coffee chain might cater to two distinct segments: young professionals and retirees. After identifying these segments, the chain can craft messages, offers and media strategies relating to each group’s preferences and lifestyle.
To reach young professionals in downtown areas, the chain might focus on convenience, quality coffee and a vibrant atmosphere that is conducive to work and socializing. Targeted advertising on Facebook, Instagram or Connected TV, along with digital signage near office complexes, could capture the attention of this demographic, emphasizing quick service and premium blends.
Conversely, for retirees in residential areas, the chain could highlight a cozy ambiance, friendly service and promotions such as senior discounts. Advertisements in local print publications, community newsletters, radio stations and events like senior coffee mornings would foster a sense of community and belonging.
Dig deeper: Niche advertising: 7 actionable tactics for targeted marketing
3. Adapt to local market dynamics
Various factors influence local market dynamics. Brands that navigate changes effectively maintain a strong audience connection and stay ahead in the market. Here’s how consumer sentiment and behavior may evolve within a local market and the corresponding adjustments brands can make.
- Cultural shifts, such as changes in demographics or societal norms, can alter consumer preferences within a local community. For example, a neighborhood experiencing gentrification may see demand rise for specific products or services.
- Respond by updating your messaging to reflect the evolving cultural landscape, ensuring it resonates with the new demographic profile.
- Economic conditions are crucial. For example, during downturns, consumers often prioritize value and practicality.
- Highlight affordable options or emphasize the practical benefits of your offerings to ensure messaging aligns with consumers’ financial priorities. The impact is unique to each market and the marketing message must also be dynamic.
- Seasonal trends impact consumer behavior.
- Align your promotions and creative content with changing seasons or local events to make your offerings timely and relevant.
- New competitors. The competitive landscape demands vigilance because new entrants or innovative competitor campaigns can shift consumer preferences.
- Differentiate by focusing on your unique selling propositions, such as quality, customer service or community involvement, to retain consumer interest and loyalty.
4. Apply data and predictive analytics
Data and predictive analytics are indispensable tools for successfully reaching local target markets. These technologies provide consumer behavior insights, enabling you to anticipate market trends and adjust strategies proactively.
- Price optimization: By analyzing consumer demand, competitor pricing and market conditions, data analytics enables you to set prices that attract customers while ensuring profitability.
- Competitor analysis: Through analysis, brands can understand their positioning within the local market landscape and identify opportunities and threats. Predictive analytics offer foresight into competitors’ potential moves, allowing you to strategize effectively to maintain a competitive edge.
- Consumer behavior: Forecasting consumer behavior allows your brand to tailor offerings and marketing messages to meet evolving consumer needs and enhance engagement.
- Marketing effectiveness: Analytics track the success of advertising campaigns, providing insights into which strategies drive conversions and sales. This feedback loop enables continuous optimization of marketing efforts for maximum impact.
- Inventory management: In supply chain management, data analytics predict demand fluctuations, ensuring inventory levels align with market needs. This efficiency prevents stockouts or excess inventory, optimizing operational costs and meeting consumer expectations.
Dig deeper: Why you should add predictive modeling to your marketing mix
5. Counter external market influences
Consider a clothing retailer preparing for a spring collection launch. By analyzing historical weather data and using predictive analytics, the brand forecasts an unseasonably cool start to spring. Anticipating this, the retailer adjusts its campaign to highlight transitional pieces suitable for cooler weather, ensuring relevance despite an unexpected chill.
Simultaneously, predictive models signal an upcoming spike in local media advertising rates due to increased market demand. Retailers respond by reallocating a portion of advertising budgets to digital channels, which offer more flexibility and lower costs than traditional media. This shift enables brands to maintain visibility and engagement without exceeding budget, mitigating the impact of external forces on advertising.
6. Build consumer confidence with messaging
Localized messaging and tailored customer service enhance consumer confidence by demonstrating your brand’s understanding of the community. For instance, a grocery store that curates cooking classes featuring local cuisine or sponsors community events shows commitment to local culture and consumer interests.
Similarly, a bookstore highlighting local authors or topics relevant to the community resonates with local customers. Additionally, providing service that addresses local needs — such as bilingual service and local event support — reinforces the brand’s values and response to the community.
Through these localized approaches, brands can build trust and loyalty, bridging the gap between corporate presence and local relevance.
7. Dominate with local advertising
To dominate local markets, brands must:
- Harness hyper-targeted segmentation and geo-targeted advertising to reach and engage precise audiences.
- Create localized content that reflects community values, engage in community events, optimize campaigns for mobile and track results.
- Fine-tune strategies, outperform competitors and foster lasting relationships with customers.
These strategies will enable your message to resonate with local consumers, differentiate you in competitive markets and ensure you become a major player in your specific area.
Dig deeper: The 5 critical elements for local marketing success
Opinions expressed in this article are those of the guest author and not necessarily MarTech. Staff authors are listed here.
MARKETING
Battling for Attention in the 2024 Election Year Media Frenzy


As we march closer to the 2024 U.S. presidential election, CMOs and marketing leaders need to prepare for a significant shift in the digital advertising landscape. Election years have always posed unique challenges for advertisers, but the growing dominance of digital media has made the impact more profound than ever before.
In this article, we’ll explore the key factors that will shape the advertising environment in the coming months and provide actionable insights to help you navigate these turbulent waters.
The Digital Battleground
The rise of cord-cutting and the shift towards digital media consumption have fundamentally altered the advertising landscape in recent years. As traditional TV viewership declines, political campaigns have had to adapt their strategies to reach voters where they are spending their time: on digital platforms.
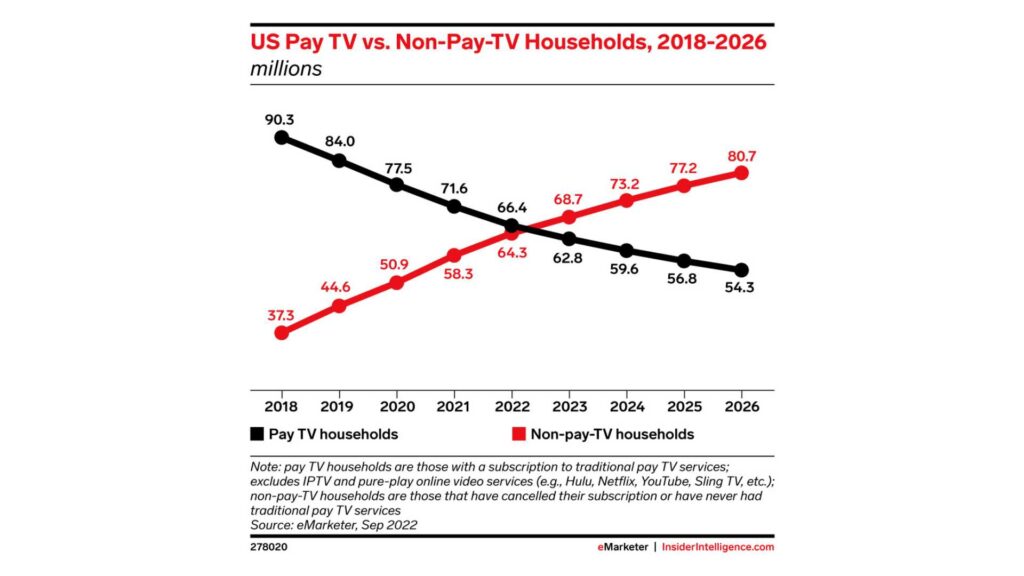

According to a recent report by eMarketer, the number of cord-cutters in the U.S. is expected to reach 65.1 million by the end of 2023, representing a 6.9% increase from 2022. This trend is projected to continue, with the number of cord-cutters reaching 72.2 million by 2025.
Moreover, a survey conducted by Pew Research Center in 2023 found that 62% of U.S. adults do not have a cable or satellite TV subscription, up from 61% in 2022 and 50% in 2019. This data further underscores the accelerating shift away from traditional TV and towards streaming and digital media platforms.
As these trends continue, political advertisers will have no choice but to follow their audiences to digital channels. In the 2022 midterm elections, digital ad spending by political campaigns reached $1.2 billion, a 50% increase from the 2018 midterms. With the 2024 presidential election on the horizon, this figure is expected to grow exponentially, as campaigns compete for the attention of an increasingly digital-first electorate.
For brands and advertisers, this means that the competition for digital ad space will be fiercer than ever before. As political ad spending continues to migrate to platforms like Meta, YouTube, and connected TV, the cost of advertising will likely surge, making it more challenging for non-political advertisers to reach their target audiences.
To navigate this complex and constantly evolving landscape, CMOs and their teams will need to be proactive, data-driven, and willing to experiment with new strategies and channels. By staying ahead of the curve and adapting to the changing media consumption habits of their audiences, brands can position themselves for success in the face of the electoral advertising onslaught.
Rising Costs and Limited Inventory
As political advertisers flood the digital market, the cost of advertising is expected to skyrocket. CPMs (cost per thousand impressions) will likely experience a steady climb throughout the year, with significant spikes anticipated in May, as college students come home from school and become more engaged in political conversations, and around major campaign events like presidential debates.


For media buyers and their teams, this means that the tried-and-true strategies of years past may no longer be sufficient. Brands will need to be nimble, adaptable, and willing to explore new tactics to stay ahead of the game.
Black Friday and Cyber Monday: A Perfect Storm
The challenges of election year advertising will be particularly acute during the critical holiday shopping season. Black Friday and Cyber Monday, which have historically been goldmines for advertisers, will be more expensive and competitive than ever in 2024, as they coincide with the final weeks of the presidential campaign.
To avoid being drowned out by the political noise, brands will need to start planning their holiday campaigns earlier than usual. Building up audiences and crafting compelling creative assets well in advance will be essential to success, as will a willingness to explore alternative channels and tactics. Relying on cold audiences come Q4 will lead to exceptionally high costs that may be detrimental to many businesses.
Navigating the Chaos
While the challenges of election year advertising can seem daunting, there are steps that media buyers and their teams can take to mitigate the impact and even thrive in this environment. Here are a few key strategies to keep in mind:
Start early and plan for contingencies: Begin planning your Q3 and Q4 campaigns as early as possible, with a focus on building up your target audiences and developing a robust library of creative assets.
Be sure to build in contingency budgets to account for potential cost increases, and be prepared to pivot your strategy as the landscape evolves.


Embrace alternative channels: Consider diversifying your media mix to include channels that may be less impacted by political ad spending, such as influencer marketing, podcast advertising, or sponsored content. Investing in owned media channels, like email marketing and mobile apps, can also provide a direct line to your customers without the need to compete for ad space.
Owned channels will be more important than ever. Use cheaper months leading up to the election to build your email lists and existing customer base so that your BF/CM can leverage your owned channels and warm audiences.
Craft compelling, shareable content: In a crowded and noisy advertising environment, creating content that resonates with your target audience will be more important than ever. Focus on developing authentic, engaging content that aligns with your brand values and speaks directly to your customers’ needs and desires.
By tapping into the power of emotional triggers and social proof, you can create content that not only cuts through the clutter but also inspires organic sharing and amplification.
Reflections
The 2024 election year will undoubtedly bring new challenges and complexities to the world of digital advertising. But by staying informed, adaptable, and strategic in your approach, you can navigate this landscape successfully and even find new opportunities for growth and engagement.
As a media buyer or agnecy, your role in steering your brand through these uncharted waters will be critical. By starting your planning early, embracing alternative channels and tactics, and focusing on creating authentic, resonant content, you can not only survive but thrive in the face of election year disruptions.
So while the road ahead may be uncertain, one thing is clear: the brands that approach this challenge with creativity, agility, and a steadfast commitment to their customers will be the ones that emerge stronger on the other side.
-

 PPC4 days ago
19 Best SEO Tools in 2024 (For Every Use Case)
-
 MARKETING7 days ago
Will Google Buy HubSpot? | Content Marketing Institute
-
SEARCHENGINES7 days ago
Daily Search Forum Recap: April 16, 2024
-

 SEO7 days ago
Google Clarifies Vacation Rental Structured Data
-

 MARKETING6 days ago
Streamlining Processes for Increased Efficiency and Results
-
SEARCHENGINES6 days ago
Daily Search Forum Recap: April 17, 2024
-

 SEO6 days ago
An In-Depth Guide And Best Practices For Mobile SEO
-

 PPC6 days ago
97 Marvelous May Content Ideas for Blog Posts, Videos, & More








![How to Use AI For a More Effective Social Media Strategy, According to Ross Simmonds Download Now: The 2024 State of Social Media Trends [Free Report]](https://articles.entireweb.com/wp-content/uploads/2024/04/How-to-Use-AI-For-a-More-Effective-Social-Media.png)


You must be logged in to post a comment Login