SEO
8 Engaging Infographic Types & How To Create Them (+ 5 Free Tools)
If done correctly, infographics are a great visual to grab the readers’ attention while effectively communicating key points you want them to focus on within your content.
There are numerous benefits to incorporating infographics that can help your marketing strategy and build brand authority.
First, it incentivizes readers to stop and focus on the information through its well-planned design highlighting key data.
It can also play a storytelling role and guide readers through a new process or viewpoint leading to your call to action.
A recent study shows that 57% of B2B marketers are incorporating infographics and charts into their marketing content.
Not only are infographics great ways to inform readers or persuade them, but they are easier to share across social media to help reach your target audience.
Generally, people like to take in bite-sized information, and this is a creative way to accomplish that.
Infographics are useful throughout many forms of marketing content, such as blog posts, webpages, landing pages, emails, and lead generators.
Anatomy Of An Infographic
Now that you know why they are so important for marketing, we’ll break down the different components of infographics, the valuable and effective types of infographics out there, and some free tools you can use to create them.
Eye-Catching Title And Subheadings
So, for the main parts of a compelling infographic, first, you have to select the topic you want to discuss.
Then, you can lay out the main topic and subtopics with their corresponding title and subheadings.
It’s crucial they are well thought out and descriptive, so you can quickly get across to your reader what you’re trying to present to them.
Background And Research
Next, you’ll need to brainstorm and gather background information or conduct research for your topic. This is a crucial part of the process since it’s the foundation of your infographic.
Make sure you’re pulling the right information to highlight for your infographic. This could include statistics, data, or important facts for the intention and retention of information for your post.
This data can come from internal information such as customer data or research you’ve already conducted, as well as quotes from thought leaders, industry experts, or any credible sources you find along your research journey. Just make sure to verify your sources.
Layout And Design
After you have all the information you need, you can select what you’d like to use and begin the layout and design. Make sure to include attention-grabbing graphics, images, or icons.
Graphics are helpful and aesthetically pleasing elements to enhance your infographics.
It’s vital to ensure that the theme is consistent, not just throughout the infographic’s layout but also within your chosen information.
Also, make sure you keep your brand elements in mind when designing your infographic.
Now, we’ll dive into some best practices for designing an infographic and then run through the different types of infographics that can help make your data shine.
Best Practices For Designing Infographics
Below are some valuable aspects to keep in mind when designing an infographic:
- Pick your target audience and tailor your infographic to that audience.
- Determine an infographic type that best suits the information.
- Choose a designer or create a wireframe.
- Select your key performance indicators.
- Marketing your infographic with appealing headlines.
- Create a good meta description or initial copy to draw people in.
- Make sure you can easily share and locate your infographic.
- Review your infographic and get feedback from team members.
Infographic Types And When to Use Them
Understanding how and when to use the following infographics can help you better engage with your readers and make sure they are focusing on the information you want them to remember.
Here are the different types of infographics you should consider:
1. Timeline
Timeline infographics are perfect for showing the different steps to planning an event, creating a storyline for a topic, or presenting a timeline of important milestones your company has hit recently.
In addition, they are great for showing critical points in work history or when you want to further discuss projections of an event.
If you’re trying to show how long a project will take, you can show when each goal or aspect of a project will be completed in a timeline infographic.
For example, you might want to use this type if you have an upcoming project and want to detail the dates for milestones along the way to represent how that project will come to fruition visually.
If you choose to create a timeline infographic, you might want to make the dates or points stand out by using different font sizes and connecting each date with a line.
In addition, you can use different colors to differentiate between the date and subtext.
2. Statistical
Statistical infographics help your readers better understand and retain specific data points or statistics that are key to the information you’re providing.
This can be helpful to highlight information to prove a point and convince your reader with quality resources.
Again, this puts the communication effort on the numbers, making them work in your favor.
If your company recently completed a study and wants to showcase the outcome or attach an infographic to a case study to quickly highlight the data, a statistical infographic could be a great way to do so.
3. Flowchart
Like the timeline infographic, a flowchart breaks down the main components of an event or project but focuses more on the actual steps or significant points along the path to completing a task.
It’s a visualized and summarized representation of key ideas. This can be useful if you are trying to simplify explaining a process and help your readers better understand each step.
If you choose a flowchart infographic, ensure that each step has cues to the next step.
For example, you can separate subtitles and content with different colors and sized fonts. This can also be helpful if you’re trying to communicate a new process within your company, need to create a how-to guide, or show a hierarchy.
4. Informational
An informational infographic could be perfect if you want to make a couple of key points pop.
It would also be helpful if you’re going to communicate an overview of an event or new idea. It’s a great way to summarize or give the main points to a more in-depth topic.
It can be helpful to include these types of infographics in a blog post to help quickly and effectively relay information to your readers where you plan on providing future content about a particular concept.
The title and subheadings are key here; they need to be descriptive and engaging if you’re explaining a complex topic.
You can help differentiate the points by putting them in blocked sections with different colors. Although, don’t go overboard, just select a couple of colors for the infographic’s theme.
5. Comparison
Comparison infographics are perfect for comparing two different products or services.
For example, you can compare your company’s product to another or describe the pros and cons of why a product would work better in one situation over another.
Comparison infographics are also great for producing a list of some of the positives and negatives of a viewpoint or if you want to compare different stances on a topic.
But, it’s important to keep the information concise so as not to overwhelm the reader with too much data.
6. List
People often create to-do or checklists in their daily life to keep track of what they want to accomplish, and this can transfer over to helpful infographics.
For example, if you want to create a summary or list of tips or main points on a topic, a list infographic can be handy.
For a list infographic, keep the information succinct and straightforward; remember this is short-form content.
Also, group related information together in the layout to avoid confusing the points.
7. Maps
Map infographics are perfect for presenting information on an accumulation of locations of a business in different geographic areas or providing a quick rundown of demographics.
You can use this infographic as a visual view of the world or a specific country or city to display important information about a region.
Suppose your company has completed a survey or study on a particular region and has valuable information and statistics they want to showcase, then this infographic could be helpful.
A company can also use this infographic to show areas they service or locations for an upcoming event.
8. Interactive
If you want to slowly bring readers through a more complex idea or process, then an interactive infographic can help you complete this task.
This infographic is excellent for guiding readers on a journey while providing smaller chunks of data at a time that they can go back and forth between on their own time.
If there are key points in the infographic that readers want to learn about first, they can select those before exploring further.
It is essential to think about the user experience here to ensure they are guided to the call to action on your infographic.
5 Free Infographic Tools
The following are some fantastic tools to make effective infographics with numerous features and customizable templates.
It’s important to find a user-friendly platform that can help you easily create influential infographics, so if you’re interested in using an infographic tool, consider these:
Takeaway
Infographics are a great creative tool for content creation and marketing.
They are a compelling way to tell a story and help your readers retain the key information you want them to for a content piece.
It’s important to take the time to choose the right infographic and focus on each phase of the design process to make sure they’re effective.
Remember to start with the goal of your infographic, and then it’ll be easier to figure out which one is best for the content and the types of graphics and design elements that would be most helpful.
This visual storytelling is one of the best ways to efficiently communicate with your readers.
More Resources:
Featured Image: alexdndz/Shutterstock
!function(f,b,e,v,n,t,s)
{if(f.fbq)return;n=f.fbq=function(){n.callMethod?
n.callMethod.apply(n,arguments):n.queue.push(arguments)};
if(!f._fbq)f._fbq=n;n.push=n;n.loaded=!0;n.version=’2.0′;
n.queue=[];t=b.createElement(e);t.async=!0;
t.src=v;s=b.getElementsByTagName(e)[0];
s.parentNode.insertBefore(t,s)}(window,document,’script’,
‘https://connect.facebook.net/en_US/fbevents.js’);
if( typeof sopp !== “undefined” && sopp === ‘yes’ ){
fbq(‘dataProcessingOptions’, [‘LDU’], 1, 1000);
}else{
fbq(‘dataProcessingOptions’, []);
}
fbq(‘init’, ‘1321385257908563’);
fbq(‘track’, ‘PageView’);
fbq(‘trackSingle’, ‘1321385257908563’, ‘ViewContent’, {
content_name: ‘infographic-types-tools’,
content_category: ‘creation digital-marketing-tools ‘
});
SEO
Measuring Content Impact Across The Customer Journey
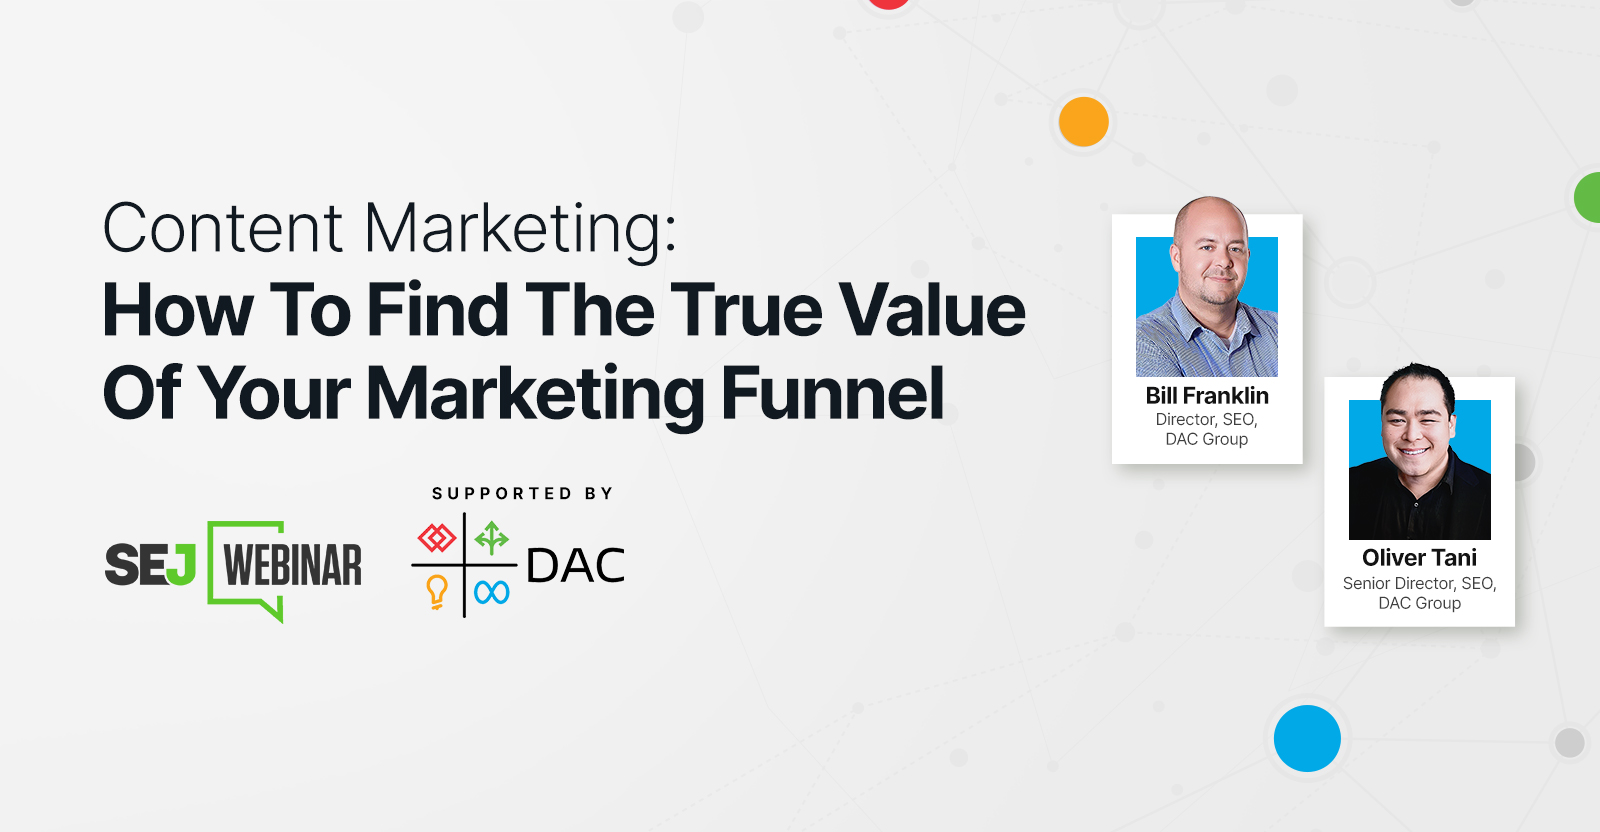
Understanding the impact of your content at every touchpoint of the customer journey is essential – but that’s easier said than done. From attracting potential leads to nurturing them into loyal customers, there are many touchpoints to look into.
So how do you identify and take advantage of these opportunities for growth?
Watch this on-demand webinar and learn a comprehensive approach for measuring the value of your content initiatives, so you can optimize resource allocation for maximum impact.
You’ll learn:
- Fresh methods for measuring your content’s impact.
- Fascinating insights using first-touch attribution, and how it differs from the usual last-touch perspective.
- Ways to persuade decision-makers to invest in more content by showcasing its value convincingly.
With Bill Franklin and Oliver Tani of DAC Group, we unravel the nuances of attribution modeling, emphasizing the significance of layering first-touch and last-touch attribution within your measurement strategy.
Check out these insights to help you craft compelling content tailored to each stage, using an approach rooted in first-hand experience to ensure your content resonates.
Whether you’re a seasoned marketer or new to content measurement, this webinar promises valuable insights and actionable tactics to elevate your SEO game and optimize your content initiatives for success.
View the slides below or check out the full webinar for all the details.
SEO
How to Find and Use Competitor Keywords

Competitor keywords are the keywords your rivals rank for in Google’s search results. They may rank organically or pay for Google Ads to rank in the paid results.
Knowing your competitors’ keywords is the easiest form of keyword research. If your competitors rank for or target particular keywords, it might be worth it for you to target them, too.
There is no way to see your competitors’ keywords without a tool like Ahrefs, which has a database of keywords and the sites that rank for them. As far as we know, Ahrefs has the biggest database of these keywords.
How to find all the keywords your competitor ranks for
- Go to Ahrefs’ Site Explorer
- Enter your competitor’s domain
- Go to the Organic keywords report
The report is sorted by traffic to show you the keywords sending your competitor the most visits. For example, Mailchimp gets most of its organic traffic from the keyword “mailchimp.”


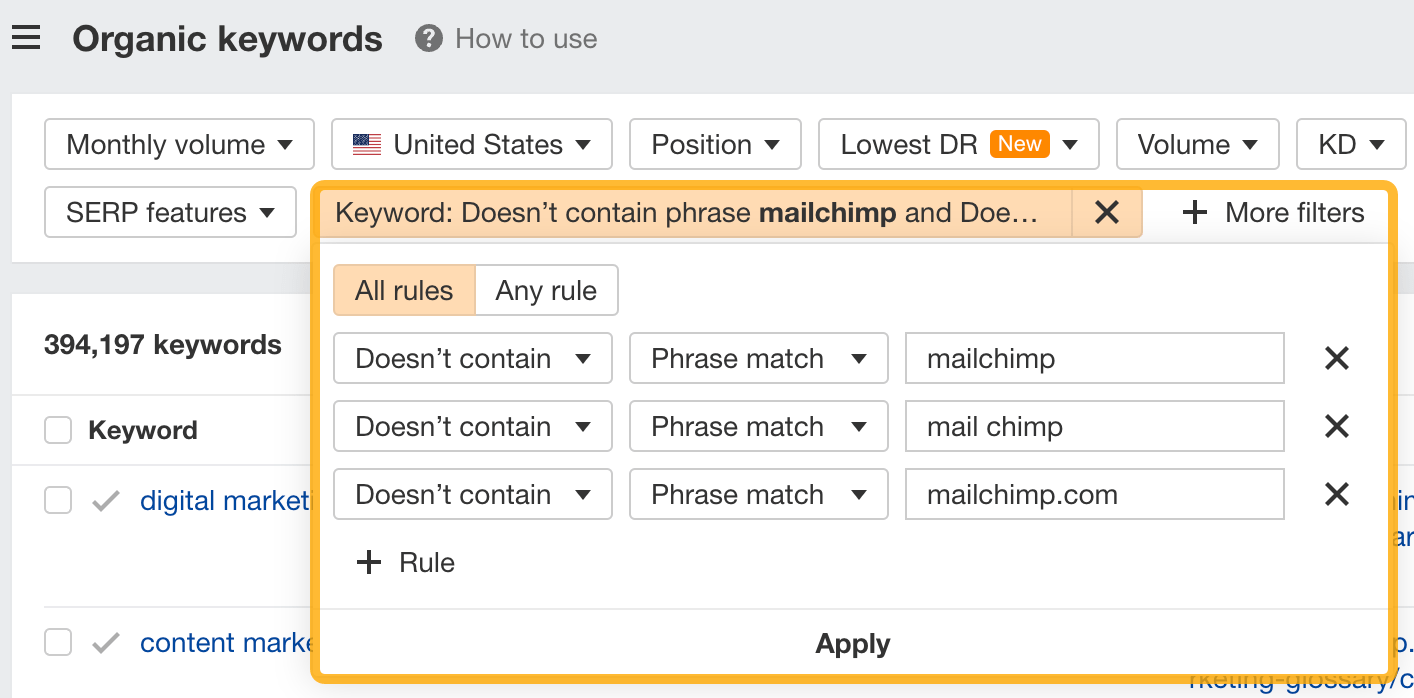
Since you’re unlikely to rank for your competitor’s brand, you might want to exclude branded keywords from the report. You can do this by adding a Keyword > Doesn’t contain filter. In this example, we’ll filter out keywords containing “mailchimp” or any potential misspellings:

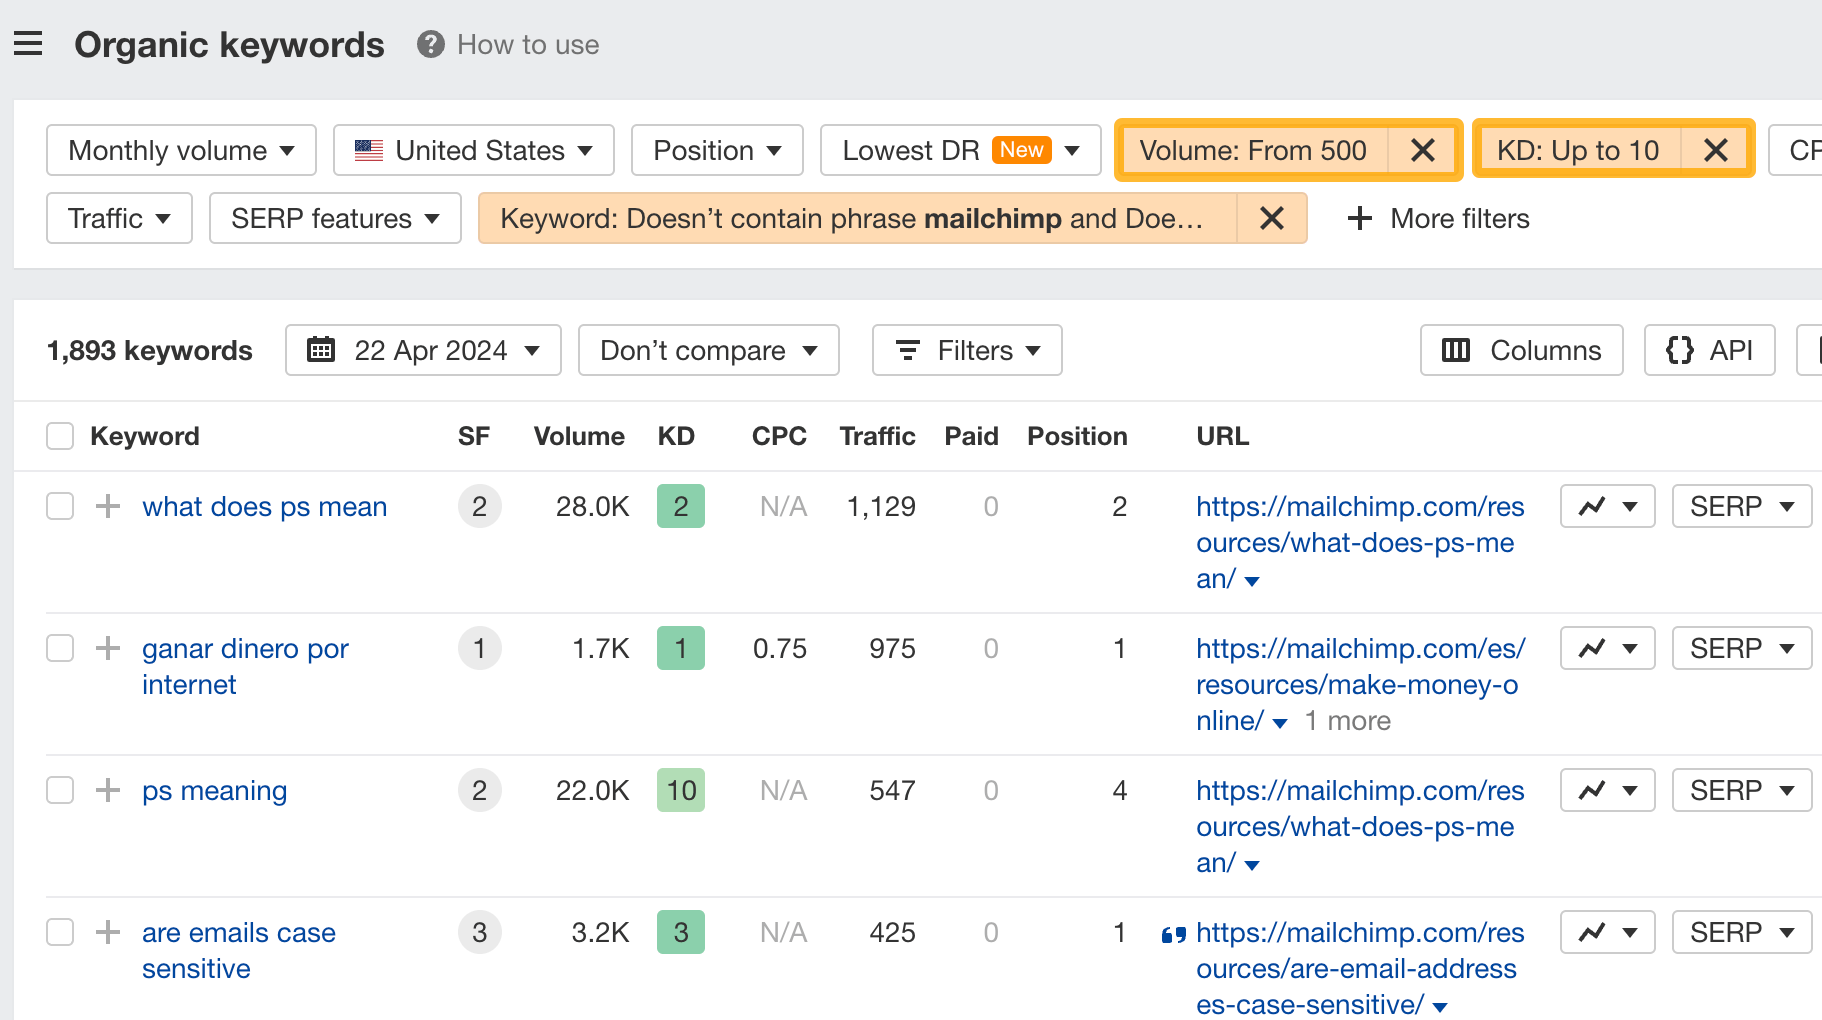
If you’re a new brand competing with one that’s established, you might also want to look for popular low-difficulty keywords. You can do this by setting the Volume filter to a minimum of 500 and the KD filter to a maximum of 10.

How to find keywords your competitor ranks for, but you don’t
- Go to Competitive Analysis
- Enter your domain in the This target doesn’t rank for section
- Enter your competitor’s domain in the But these competitors do section
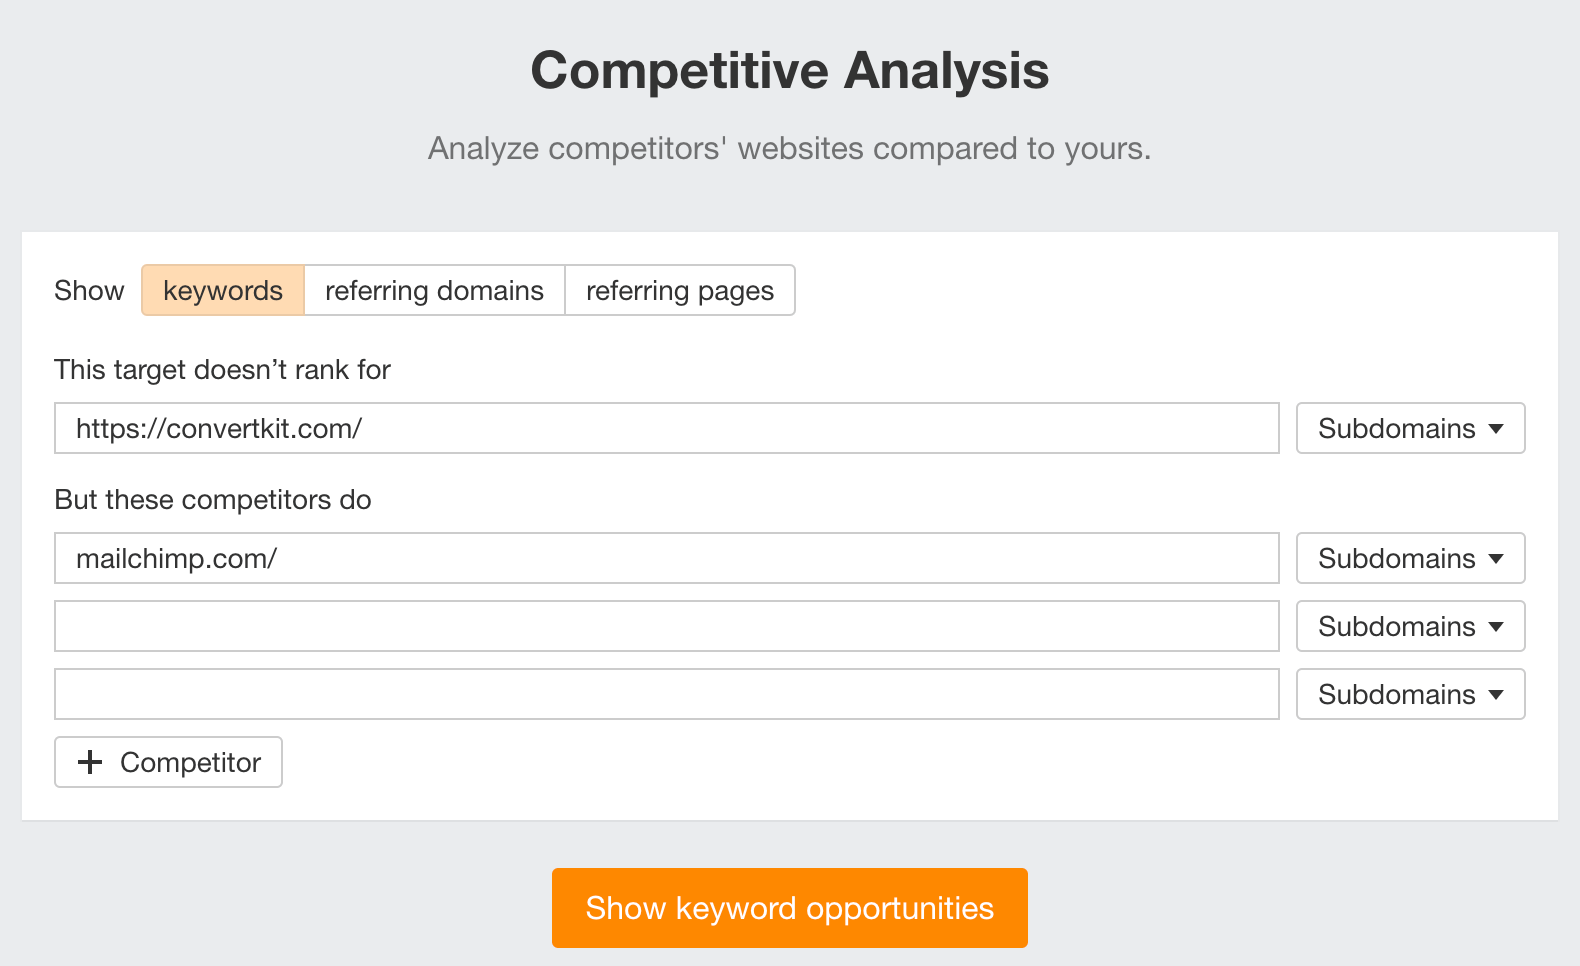

Hit “Show keyword opportunities,” and you’ll see all the keywords your competitor ranks for, but you don’t.
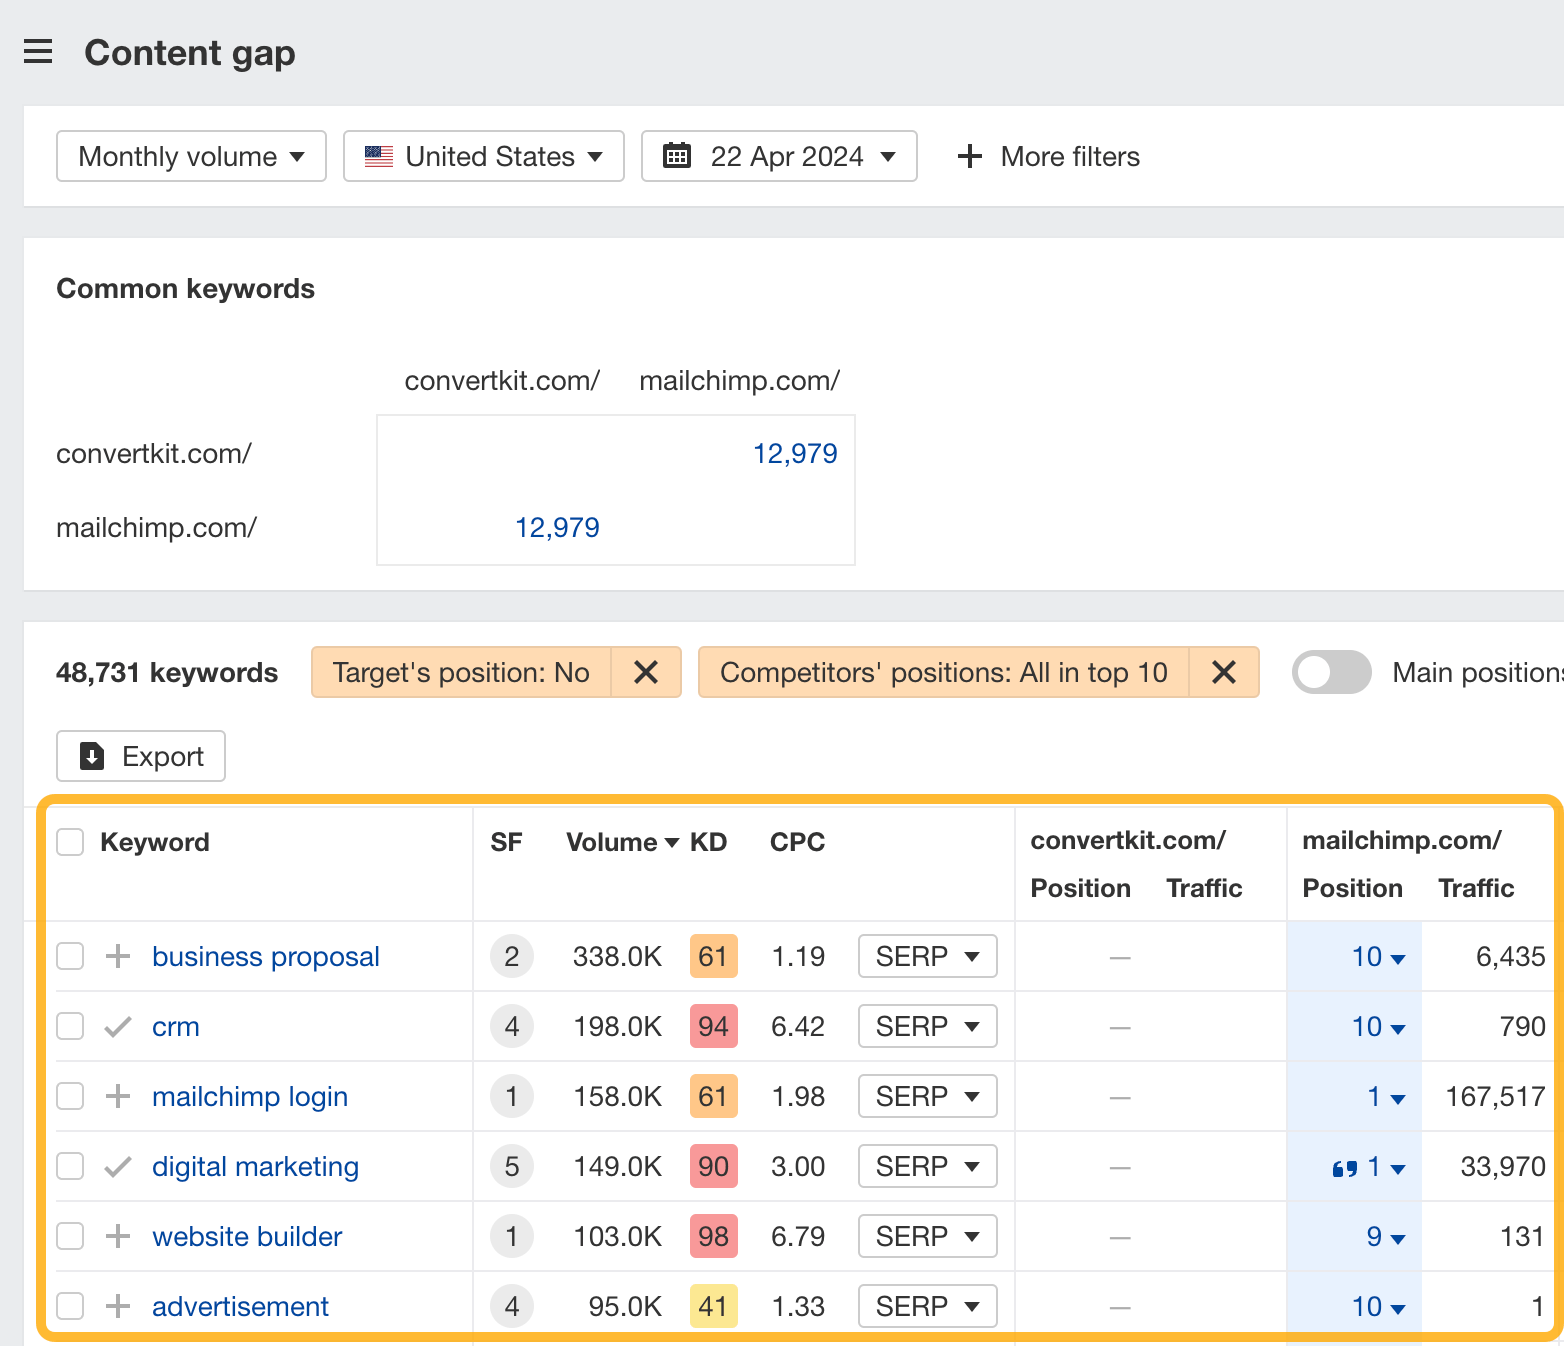

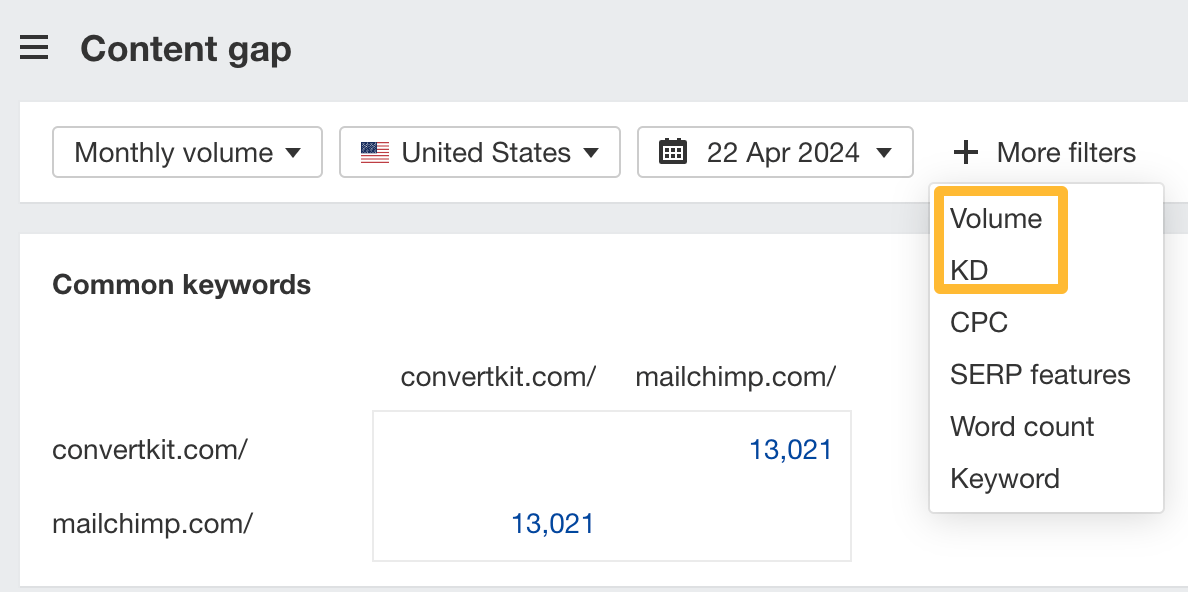
You can also add a Volume and KD filter to find popular, low-difficulty keywords in this report.

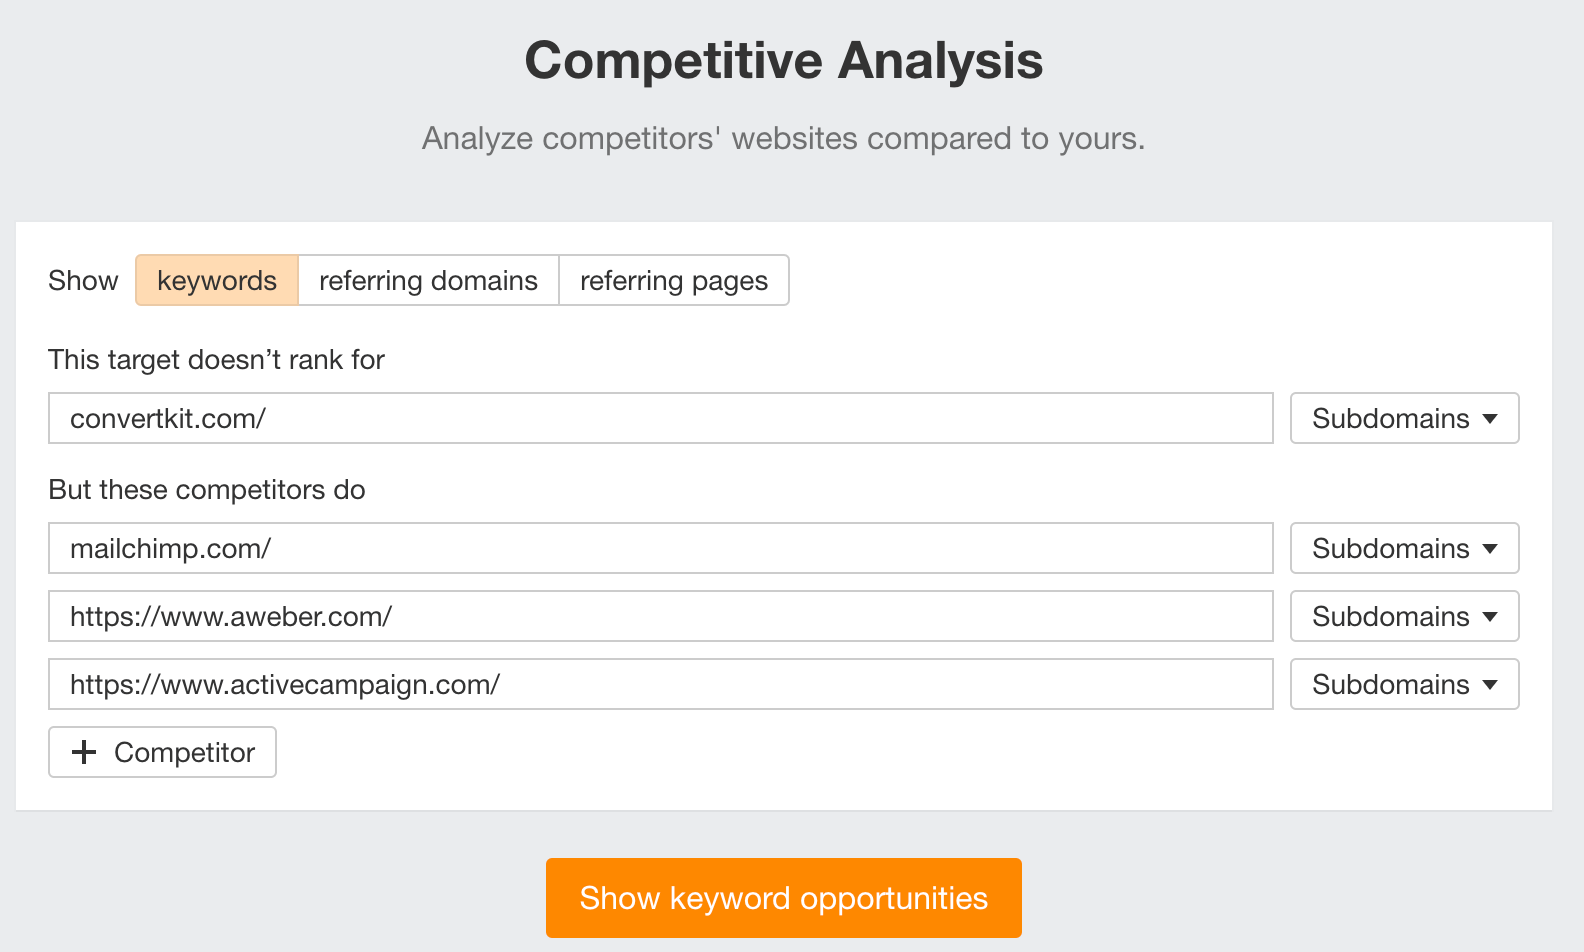
How to find keywords multiple competitors rank for, but you don’t
- Go to Competitive Analysis
- Enter your domain in the This target doesn’t rank for section
- Enter the domains of multiple competitors in the But these competitors do section

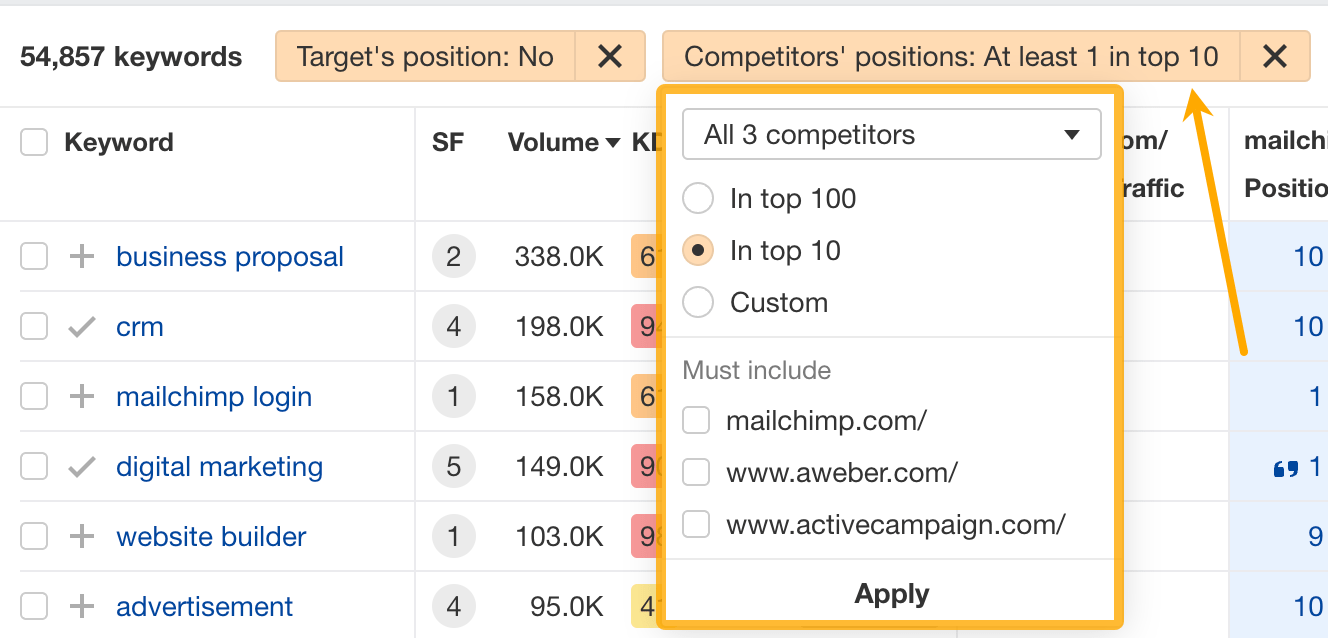
You’ll see all the keywords that at least one of these competitors ranks for, but you don’t.
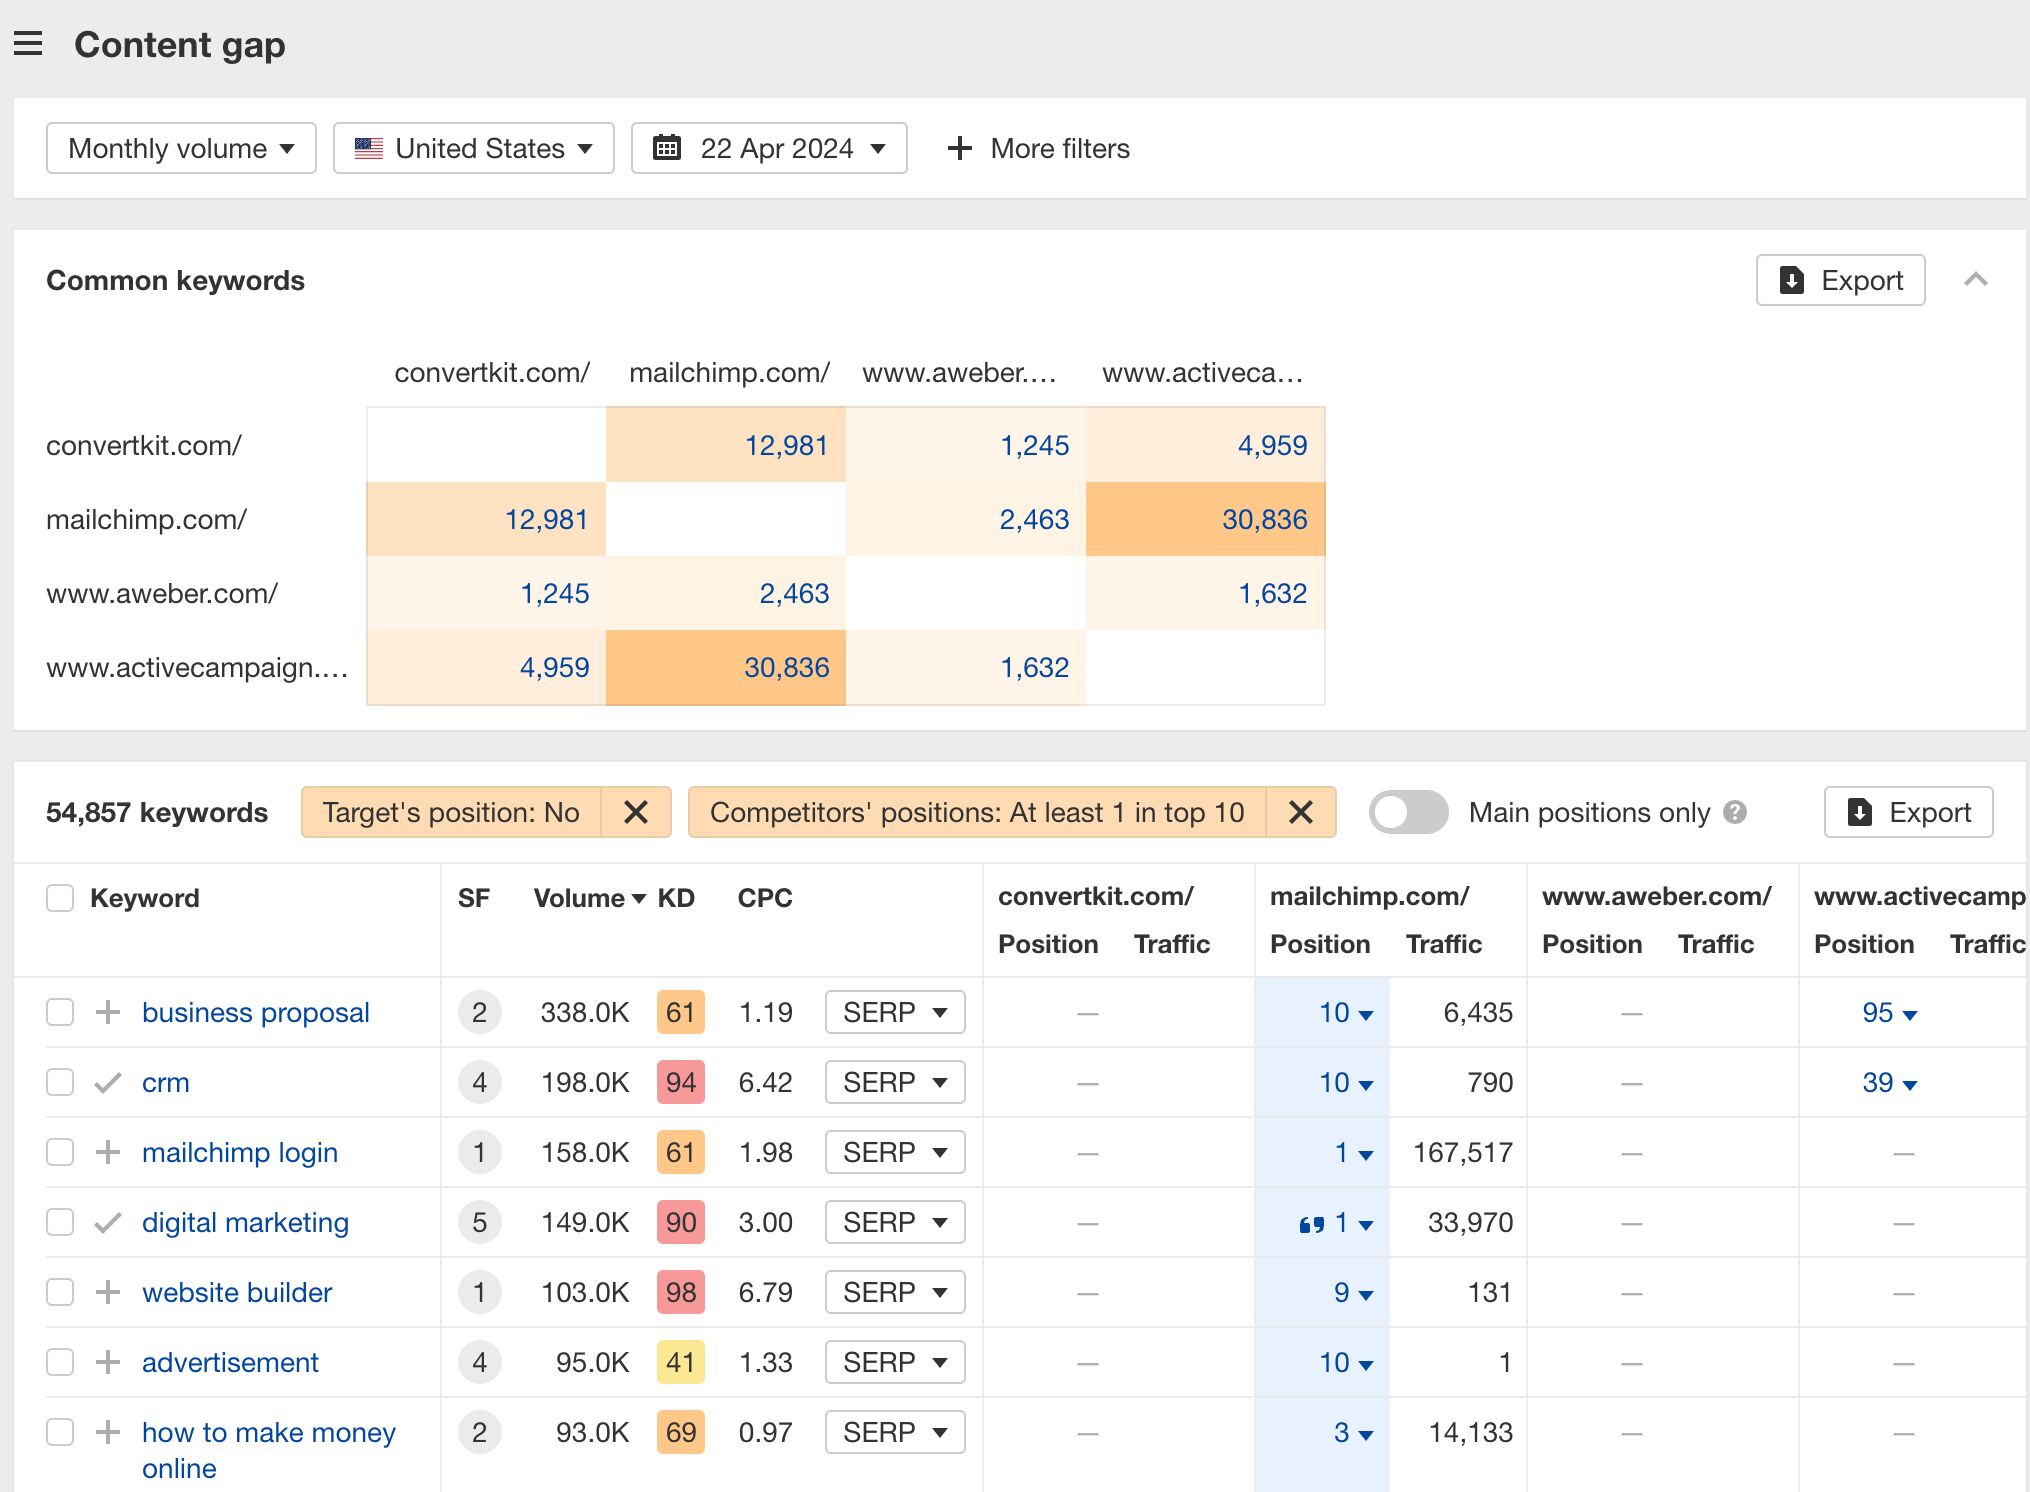

You can also narrow the list down to keywords that all competitors rank for. Click on the Competitors’ positions filter and choose All 3 competitors:

- Go to Ahrefs’ Site Explorer
- Enter your competitor’s domain
- Go to the Paid keywords report
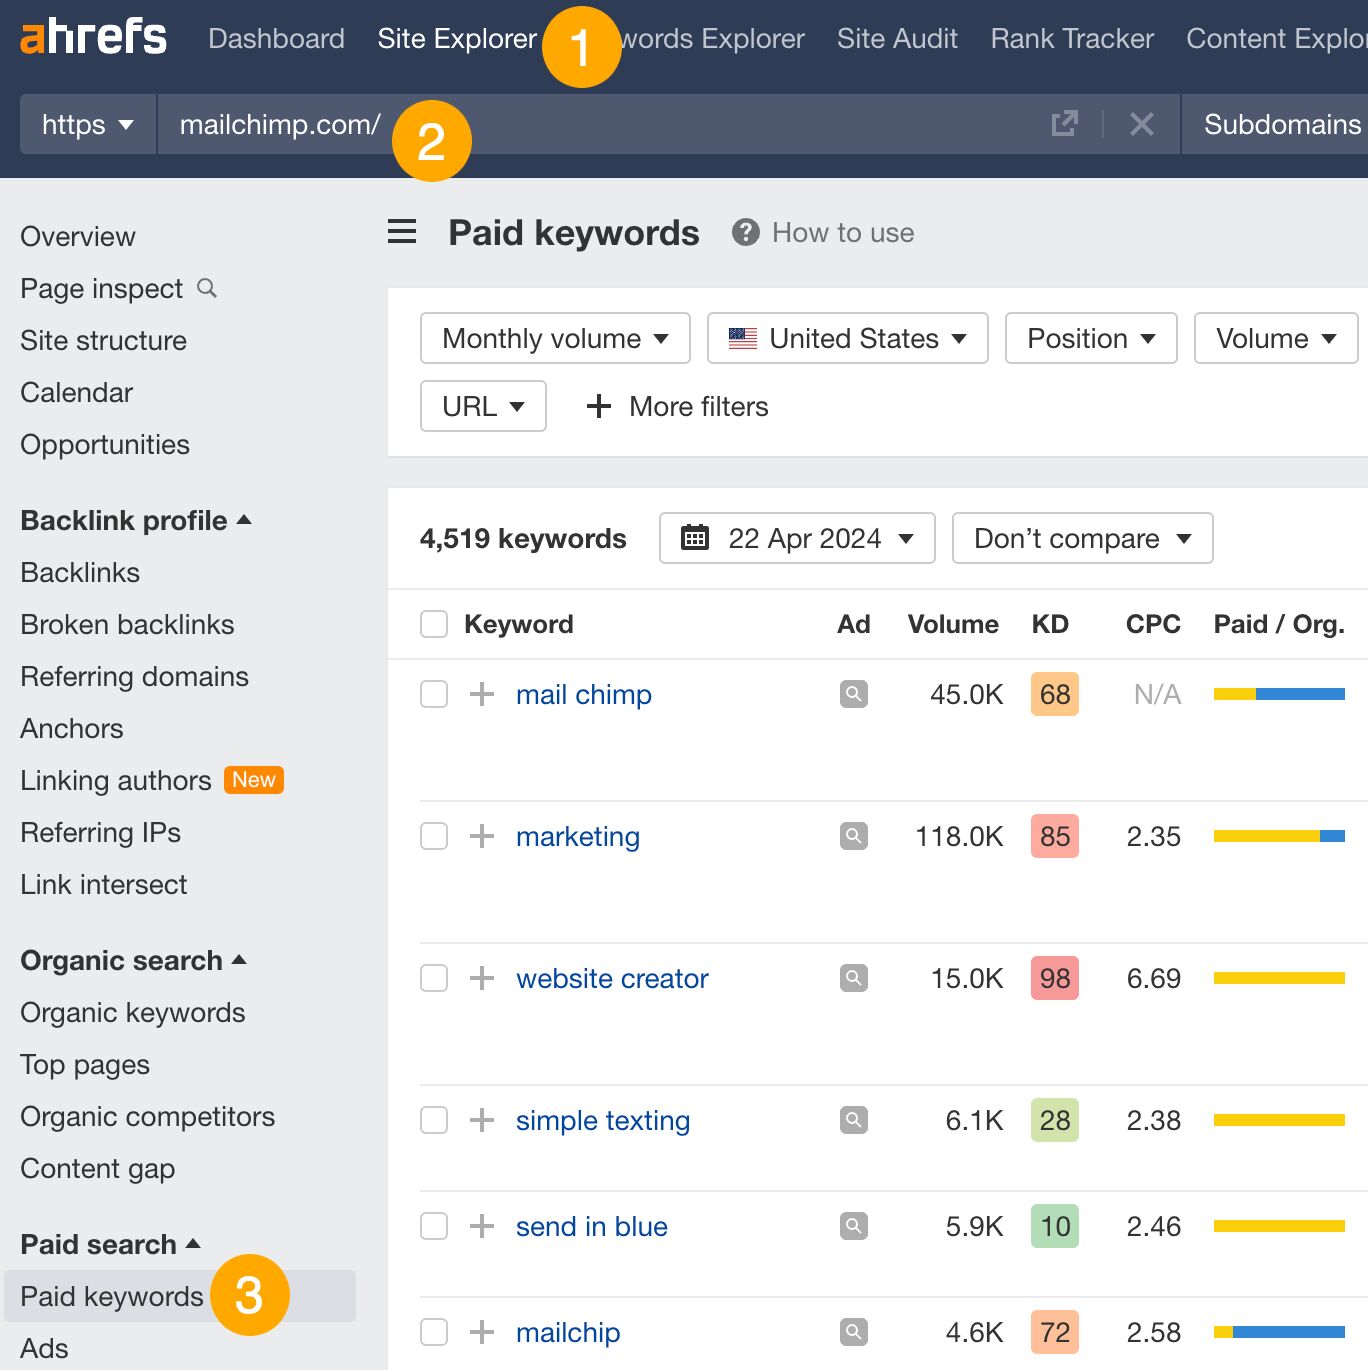

This report shows you the keywords your competitors are targeting via Google Ads.
Since your competitor is paying for traffic from these keywords, it may indicate that they’re profitable for them—and could be for you, too.
You know what keywords your competitors are ranking for or bidding on. But what do you do with them? There are basically three options.
1. Create pages to target these keywords
You can only rank for keywords if you have content about them. So, the most straightforward thing you can do for competitors’ keywords you want to rank for is to create pages to target them.
However, before you do this, it’s worth clustering your competitor’s keywords by Parent Topic. This will group keywords that mean the same or similar things so you can target them all with one page.
Here’s how to do that:
- Export your competitor’s keywords, either from the Organic Keywords or Content Gap report
- Paste them into Keywords Explorer
- Click the “Clusters by Parent Topic” tab
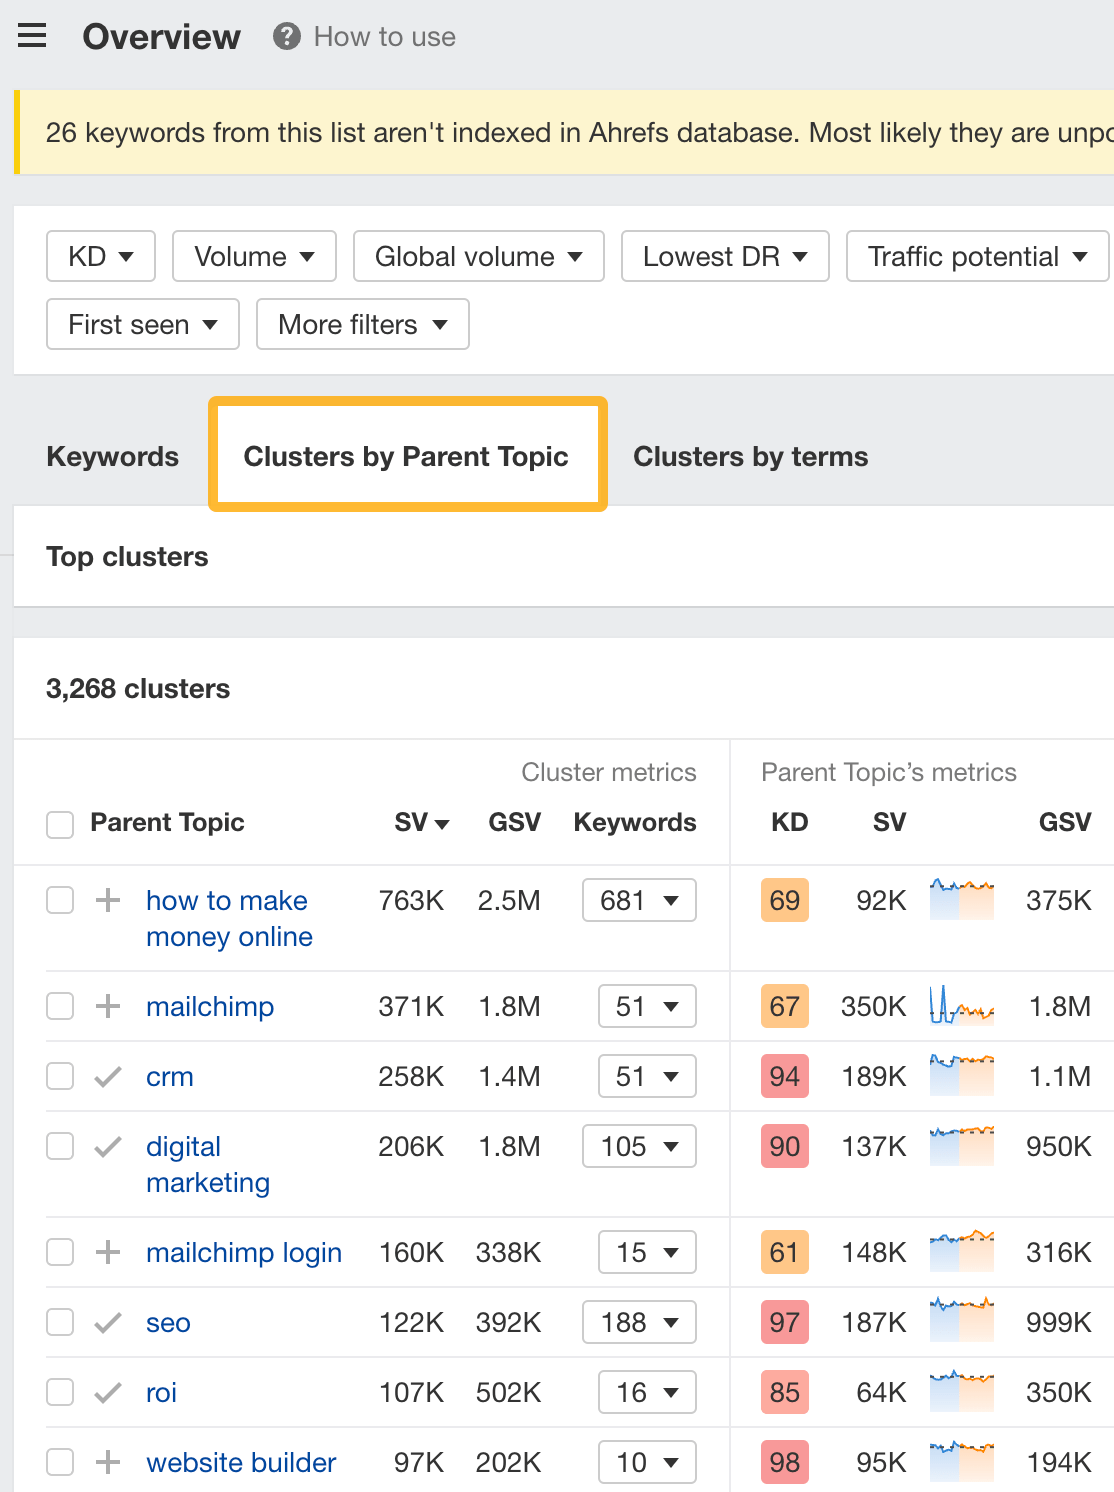

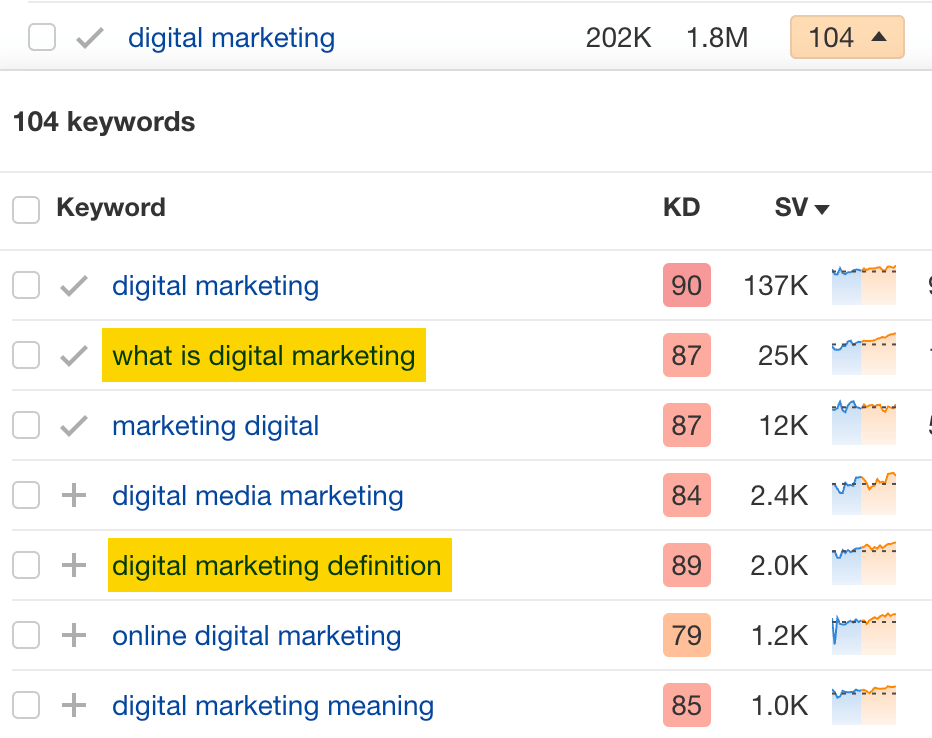
For example, MailChimp ranks for keywords like “what is digital marketing” and “digital marketing definition.” These and many others get clustered under the Parent Topic of “digital marketing” because people searching for them are all looking for the same thing: a definition of digital marketing. You only need to create one page to potentially rank for all these keywords.

2. Optimize existing content by filling subtopics
You don’t always need to create new content to rank for competitors’ keywords. Sometimes, you can optimize the content you already have to rank for them.
How do you know which keywords you can do this for? Try this:
- Export your competitor’s keywords
- Paste them into Keywords Explorer
- Click the “Clusters by Parent Topic” tab
- Look for Parent Topics you already have content about
For example, if we analyze our competitor, we can see that seven keywords they rank for fall under the Parent Topic of “press release template.”


If we search our site, we see that we already have a page about this topic.


If we click the caret and check the keywords in the cluster, we see keywords like “press release example” and “press release format.”
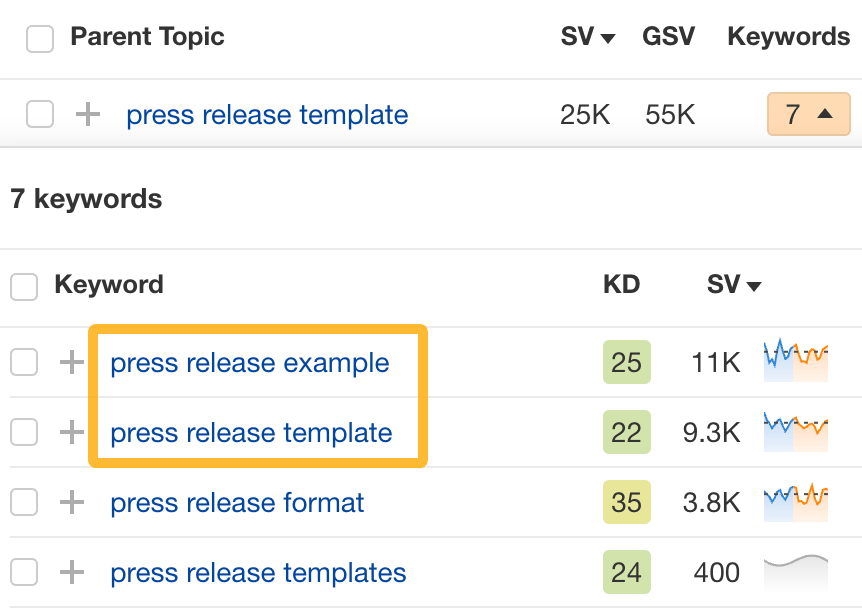

To rank for the keywords in the cluster, we can probably optimize the page we already have by adding sections about the subtopics of “press release examples” and “press release format.”
3. Target these keywords with Google Ads
Paid keywords are the simplest—look through the report and see if there are any relevant keywords you might want to target, too.
For example, Mailchimp is bidding for the keyword “how to create a newsletter.”


If you’re ConvertKit, you may also want to target this keyword since it’s relevant.
If you decide to target the same keyword via Google Ads, you can hover over the magnifying glass to see the ads your competitor is using.
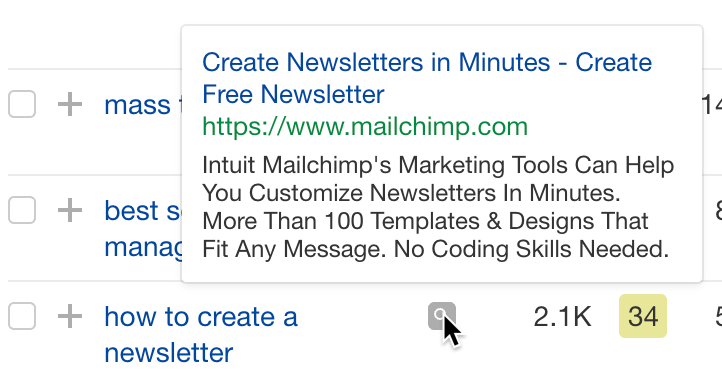

You can also see the landing page your competitor directs ad traffic to under the URL column.


Learn more
Check out more tutorials on how to do competitor keyword analysis:
SEO
Google Confirms Links Are Not That Important

Google’s Gary Illyes confirmed at a recent search marketing conference that Google needs very few links, adding to the growing body of evidence that publishers need to focus on other factors. Gary tweeted confirmation that he indeed say those words.
Background Of Links For Ranking
Links were discovered in the late 1990’s to be a good signal for search engines to use for validating how authoritative a website is and then Google discovered soon after that anchor text could be used to provide semantic signals about what a webpage was about.
One of the most important research papers was Authoritative Sources in a Hyperlinked Environment by Jon M. Kleinberg, published around 1998 (link to research paper at the end of the article). The main discovery of this research paper is that there is too many web pages and there was no objective way to filter search results for quality in order to rank web pages for a subjective idea of relevance.
The author of the research paper discovered that links could be used as an objective filter for authoritativeness.
Kleinberg wrote:
“To provide effective search methods under these conditions, one needs a way to filter, from among a huge collection of relevant pages, a small set of the most “authoritative” or ‘definitive’ ones.”
This is the most influential research paper on links because it kick-started more research on ways to use links beyond as an authority metric but as a subjective metric for relevance.
Objective is something factual. Subjective is something that’s closer to an opinion. The founders of Google discovered how to use the subjective opinions of the Internet as a relevance metric for what to rank in the search results.
What Larry Page and Sergey Brin discovered and shared in their research paper (The Anatomy of a Large-Scale Hypertextual Web Search Engine – link at end of this article) was that it was possible to harness the power of anchor text to determine the subjective opinion of relevance from actual humans. It was essentially crowdsourcing the opinions of millions of website expressed through the link structure between each webpage.
What Did Gary Illyes Say About Links In 2024?
At a recent search conference in Bulgaria, Google’s Gary Illyes made a comment about how Google doesn’t really need that many links and how Google has made links less important.
Patrick Stox tweeted about what he heard at the search conference:
” ‘We need very few links to rank pages… Over the years we’ve made links less important.’ @methode #serpconf2024″
Google’s Gary Illyes tweeted a confirmation of that statement:
“I shouldn’t have said that… I definitely shouldn’t have said that”
Why Links Matter Less
The initial state of anchor text when Google first used links for ranking purposes was absolutely non-spammy, which is why it was so useful. Hyperlinks were primarily used as a way to send traffic from one website to another website.
But by 2004 or 2005 Google was using statistical analysis to detect manipulated links, then around 2004 “powered-by” links in website footers stopped passing anchor text value, and by 2006 links close to the words “advertising” stopped passing link value, links from directories stopped passing ranking value and by 2012 Google deployed a massive link algorithm called Penguin that destroyed the rankings of likely millions of websites, many of which were using guest posting.
The link signal eventually became so bad that Google decided in 2019 to selectively use nofollow links for ranking purposes. Google’s Gary Illyes confirmed that the change to nofollow was made because of the link signal.
Google Explicitly Confirms That Links Matter Less
In 2023 Google’s Gary Illyes shared at a PubCon Austin that links were not even in the top 3 of ranking factors. Then in March 2024, coinciding with the March 2024 Core Algorithm Update, Google updated their spam policies documentation to downplay the importance of links for ranking purposes.
The documentation previously said:
“Google uses links as an important factor in determining the relevancy of web pages.”
The update to the documentation that mentioned links was updated to remove the word important.
Links are not just listed as just another factor:
“Google uses links as a factor in determining the relevancy of web pages.”
At the beginning of April Google’s John Mueller advised that there are more useful SEO activities to engage on than links.
Mueller explained:
“There are more important things for websites nowadays, and over-focusing on links will often result in you wasting your time doing things that don’t make your website better overall”
Finally, Gary Illyes explicitly said that Google needs very few links to rank webpages and confirmed it.
I shouldn’t have said that… I definitely shouldn’t have said that
— Gary 鯨理/경리 Illyes (so official, trust me) (@methode) April 19, 2024
Why Google Doesn’t Need Links
The reason why Google doesn’t need many links is likely because of the extent of AI and natural language undertanding that Google uses in their algorithms. Google must be highly confident in its algorithm to be able to explicitly say that they don’t need it.
Way back when Google implemented the nofollow into the algorithm there were many link builders who sold comment spam links who continued to lie that comment spam still worked. As someone who started link building at the very beginning of modern SEO (I was the moderator of the link building forum at the #1 SEO forum of that time), I can say with confidence that links have stopped playing much of a role in rankings beginning several years ago, which is why I stopped about five or six years ago.
Read the research papers
Authoritative Sources in a Hyperlinked Environment – Jon M. Kleinberg (PDF)
The Anatomy of a Large-Scale Hypertextual Web Search Engine
Featured Image by Shutterstock/RYO Alexandre
-

 PPC5 days ago
19 Best SEO Tools in 2024 (For Every Use Case)
-

 MARKETING6 days ago
Streamlining Processes for Increased Efficiency and Results
-
SEARCHENGINES6 days ago
Daily Search Forum Recap: April 17, 2024
-

 SEO6 days ago
An In-Depth Guide And Best Practices For Mobile SEO
-

 PPC6 days ago
97 Marvelous May Content Ideas for Blog Posts, Videos, & More
-
SEARCHENGINES5 days ago
Daily Search Forum Recap: April 18, 2024
-

 MARKETING6 days ago
Ecommerce evolution: Blurring the lines between B2B and B2C
-
SEARCHENGINES4 days ago
Daily Search Forum Recap: April 19, 2024







You must be logged in to post a comment Login