MARKETING
Metrics: How to supercharge your experimentation program

Experimentation can be pretty…well, testing at times. Downsized teams, restricted budgets, lack of buy-in, or a misguided focus on win rates (which, by the way, are always low – read on to see why that shouldn’t concern you).
So, how do you actually go about scaling an experimentation program? The process starts with choosing the right experimentation metrics.
Metrics are everywhere, but do they really impact business outcomes?
Yes – because metrics are all about measuring success. As a practitioner, you need to decide what really matters, what you’re trying to achieve, and how well you’re doing.
Establishing your key metrics also sets a baseline for comparisons, which you can use to chart progress over time. They also make your results easier to share across the organization by setting the benchmark for what ‘good’ looks like. As such, metrics play a key role in communicating the value of experimentation, achieving buy-in, and ultimately attracting the resources you need to scale up.
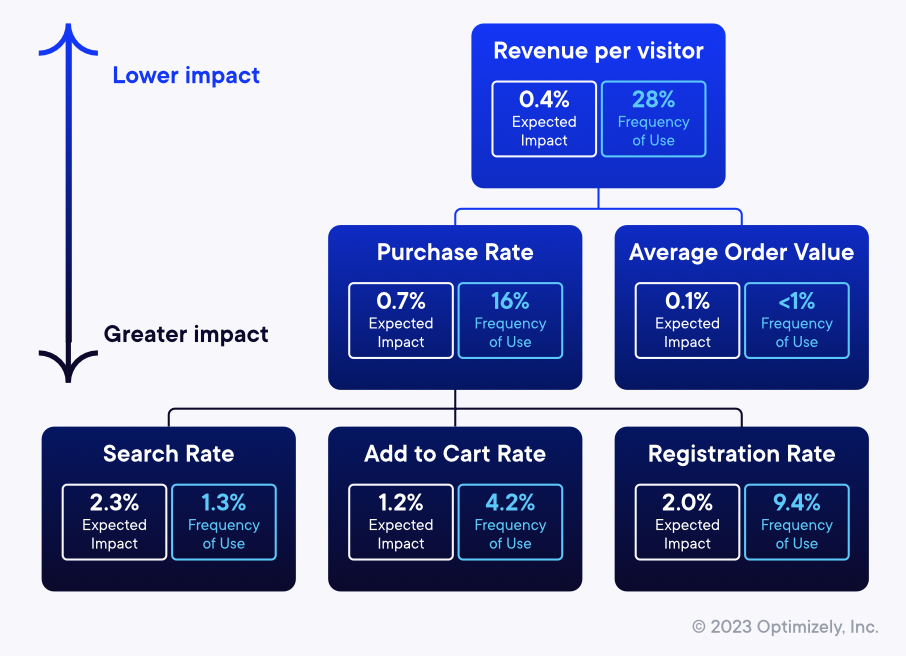
Image: Metrics by impact share
Measuring the impact of programs is a common challenge – and key metrics are a great way to answer that. Eric pointed out that setting the right metrics is perhaps the most important thing to get right, not just when launching an experimentation program but also in terms of moving it to the next level.
But… Only 12% of experiments actually win???
One of the most eye-catching findings was the fact that only 12% of experiments won. Yet you’d think win rate must be the most important factor in experimentation, right?
Wrong.
Our team discovered that win rates are more a vanity metric than a key indicator of performance. Eric highlighted the fact that impact is a far more reliable indicator of success. It not only covers your win rate, but also the uplift delivered – because at the end of the day, the monetary impact is what businesses really care about.
For example, would you rather have tests that win 10% of the time but deliver a million-dollar uplift? Or tests that win 50% of the time but only deliver $100 in additional revenues? (You don’t really have to answer that one.)
Look at the win rate alone and sure, it can be psychologically challenging to see just 12%. It’s not hard to imagine an underwhelmed management ask: why bother in the first place? Well, first of all, that’s where your metrics come into play, so you can evaluate what success really looks like.
At the same time, the need to flip things around and see yourself as learning 100% of the time. For example: the figures showed that just 12% of experiments also lose, which means you get to eliminate features that can have a negative effect. The 76% proving to be inconclusive means you can stop investing time and resources into irrelevant areas.
So sure, win rate is important – especially if you’re trying to get buy-in at the beginning of your program. But we saw you need to move past that and start framing the value of experimentation in terms of uplift, and translating win rates into expected impact per test.
So… what other metrics should you be looking at to get up to speed
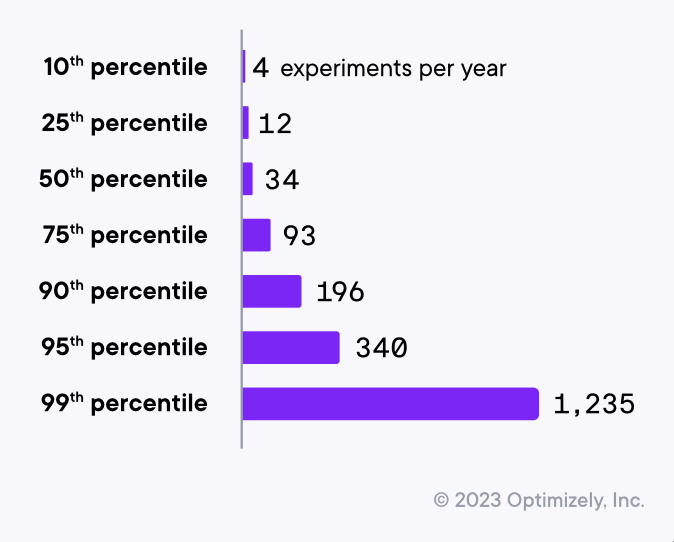
The report also identified the most common metrics used to gauge the overall success of experimentation programs. The team found that velocity was far and away the most widely used metric for experimentation programs. The number of tests performed matters more than anything else – with the proviso, they are underpinned by quality. By that, we mean experiments with some thought behind them.

Image: Median companies run 34 tests a year.
The impact is another key KPI. It may be a lagging metric but, as we’ve already seen, uplift is what the top dog, the big cheese, the head honcho, really cares about.
A third significant metric that came up is the percentage of an organization contributing to the program. This is critical when you’re on the road to maturity, creating momentum, and measuring how well you’re doing. Gaining buy-in from across the organization also plays a big part in extending the pipeline of testing ideas that will allow you to keep growing and improving.
More tests = more value. Even data says that’s not true.
Both I and Eric also discussed the importance of testing velocity: is it really as simple as more tests = more value? As a rule, yes: the evidence shows that more tests = more wins = more value. After all, however much research you do, whatever kind of preparations you make, you never know for sure what’s going to work. It stands to reason the more experiments you run, the greater your chance of hitting a winner.
When you’re getting your program up and running, say the first 12-18 months, yes – run as many tests as possible. That’ll help you build a data bank of successful stories with the aim of winning more resources and establishing a culture of experimentation.
But we also saw that moving to the next level is not necessarily about increasing velocity. It’s about focusing on complexity and moving beyond cosmetic changes. Minute tweaks tend to result in minute uplifts. Our research showed us that the highest uplift experiments share two things in common:
- They make larger code changes with more effect on the user experience.
- They test a higher number of variations simultaneously.
More complex experiments that make major changes to the user experience e.g. pricing, discounts, checkout flow, data collection, etc. are more likely to generate higher uplifts.
Solely focusing on revenue can be a roadblock
Revenue is another key metric that teams report on when highlighting the value of their experimentation program. Not surprising since ultimately revenue keeps a business… in business. Most companies are focused on making money, so that’s where you’re going to want to focus to gain support from the execs. Having said that, Mark and Eric discussed the flip side of the coin.
Uplift in revenue can be hard to track – say if you don’t have an ecommerce website, or if your business necessitates super complex buying cycles that last two or three years. In that case, if you can’t directly track revenue you want to focus your efforts as low down in the funnel as you can.
Or say your site or app doesn’t actually aim to generate revenue. They gave the example of a company that makes big sales directly to a small group of customers, and use their site to educate the public.
The key here is to understand the ultimate purpose of the channel and build your strategy around that. Rather than boosting conversions, you may instead be more interested in click-throughs to certain pages, maximizing time on site, encouraging sign-ups for an event or downloads for a paper.
It’s also worth considering a few other metrics that we found to be undervalued. Take search rate, for example. As the most undervalued experiment goal, it is only tested 1% of the time, yet it has the highest expected impact at 2.3%. Customers who actively search for a product or service are likely to convert at two to three times the rate of all other users.

Remember, no journey means no conversions.
Three at-a-glance takeaways
To wrap up, here are three takeaways to help you build and scale a successful experimentation program.
- Think ABCD instead of simply AB. Experiments that test multiple treatments are three times more successful than standard A/B tests.
- Conduct complex experiments. Tests that make major changes to the user experience (pricing, discounts, checkout flow, data collection, etc.) are more likely to win and with higher uplifts.
- Choose the right metrics that match the overall purpose of your site or app’s objectives – and don’t get too hung up on win rates!
All this is just a taster.
Why not see the full report?
Our Evolution of Experimentation report is packed with data from 127,000 experiments, revealing insights, techniques, and examples for scaling up a successful experimentation program. Read the report.


