SEO
Looker Studio (New Google Data Studio): The In-Depth Guide

If you haven’t heard, Looker Studio has replaced the well-known Google Data Studio brand.
While Google Data Studio made reporting easier for many marketers, it certainly had its limitations.
As a brand’s marketing strategy evolves and becomes more complex, so does the sophistication of its reporting needs.
If you’re anything like me, you’re likely tired of spending hours updating the same spreadsheets each month.
Sometimes, more time is spent pulling a report than providing actual insights.
When this happens, we’re doing a disservice by spending more time “doing” and less time actually analyzing the data.
There has to be a better way, right?
This in-depth Looker Studio guide will teach you how to create and customize action-oriented reports based on your own data.
What Happened To Google Data Studio?
Originally introduced in beta mid-2016, Google Data Studio is a free data visualization tool.
Many marketers have used this tool for years to unify and visualize data sets from multiple channels.
But now, you’ll notice that Data Studio is no longer referenced. Where did it go?
Google officially rebranded its Data Studio product to be named Looker Studio in October 2022.
In their official announcement, Google stated:
“We are unifying our business intelligence product family under the Looker umbrella, bringing together Looker, Data Studio, and core Google technologies like artificial intelligence (AI) and machine learning (ML). Looker Studio is still free, and has the same features as Data Studio.”
What Is Google Looker Studio?
Google Looker Studio (formerly Data Studio) syncs all of your data sources into one unified reporting experience.
It enables users to create informative and visual dashboards that are easy to interpret, share, and customize.
Essentially, Looker Studio helps go beyond data visualization. It’s aimed to help marketers make more data-driven decisions for their clients and brands alike.
Currently, Looker Studio supports over 800 different data sources, along with 600+ data connectors.
Looker Studio Vs. Data Studio
While Looker Studio touts many of the same features as the former Data Studio, the new name also brings new features.
- Free version and Pro version (paid).
- Different modeling method (LookML).
- Looker integration with Google Sheets.
- More flexible data modeling features.
- Supports 50+ SQLs and databases.
- Merging features from different data sources.
One of the key differences between Looker and Data Studio is the way data is modeled. Looker Studio uses LookML (Looker Modeling Language).
The second key difference that most marketers will benefit from is the new and improved data merging features from Looker.
In Data Studio, it allowed for data sources to be blended.
However, the biggest downside of this was that the blending feature was based on a left outer join and often didn’t blend data in a way that marketers needed.
It was a tedious process that left many to spend more time manually importing their data into a Google Sheet, then connecting that source to Data Studio.
Sounds frustrating, right?
Looker Studio, on the other hand, requires SQL databases to integrate any source. This means that raw data is passed into a database, making it much easier for Looker to merge data from different sources.
The result? A faster, more meaningful way to visualize data from all your different marketing sources in an easy-to-digest format.
Getting Started With Looker Studio
There are a few key areas to ensure your first Google Looker Studio report is a success. These include:
- Choosing a template or dashboard.
- Connecting data sources.
- Choosing metrics that matter.
- Sharing reports.
Looker Studio Templates
The first thing to do is to choose a template.
To access Looker Studio, visit Looker Studio using your preferred Google Account. This should be the account that you access your Google Analytics, Search Console, Google Ads, etc.
Looker Studio provides a wide variety of templates to get you started.
If you’re new to Looker Studio, it is important to choose a template based on the type of data being portrayed.

With any template, you have the ability to customize items and fonts to create a more consistent report.
The beauty of these reports is that multiple pages can be added.
Don’t feel like your entire marketing story needs to be shown on one page!
Every client has different needs, and their reporting should be no different.
The most efficient route I have found is to use and tweak different dashboards based on who the intended audience is.
For example, I may create a different dashboard or report page if I’m talking to a CMO vs. a Product Marketing Manager. Why?
Depending on the role of who you’re talking to, they will understand and interpret data in different ways.
A CMO, for example, doesn’t need to know the “in the weeds” data. They want to know what channels are working, what’s not, and if they’re on track to meet their goals.
Connect A Data Source
Now that you’ve selected a template, it’s time to connect your data sources.
To add a connector to your template, go to Resource at the top navigation, then click Manage added data sources. Then, you’ll click + Add A Data Source.
 Screenshot from Looker Studio, December 2022
There are currently 24 different Google connectors, such as Google Analytics, Google Ads, Google Sheets, BigQuery, and more.
However, you’re likely using other platforms like social media, third-party tools, CRM systems, and more.
For those non-Google connectors, Looker Studio can connect over 650 different data sources from their partner connectors!
 Screenshot from Looker Studio, December 2022
By using the connectors, it takes the manual tasks and syncs all data for you!
It’d be impossible to list all the available data sources here, but some of the main ones I’ve used in the past include:
- Supermetrics connectors for:
- Facebook + Instagram Insights.
- Microsoft Advertising.
- Ad + Google Analytics Data.
- Position Tracking.
- And many more.
- SEOMonitor.
- CallRail.
- Salesforce.
- HubSpot.
Most of these data sources come from third-party connectors. Keep in mind that many of them:
- Additional cost.
- Can slow down reports.
- Metrics are sometimes deprecated, meaning it is vital to stay on top of any changes to your report and rebuild metrics if needed.
When adding a data source, you’ll be asked to authorize the connection between accounts.


Choosing Metrics That Matter
Speaking of metrics – they matter.
Let’s be real, the worst is when clients open reports and see a complete data dump.
While Looker Studio is completely customizable, this does not mean we should be showing all metrics available.
Does your client care about return on advertising spend (ROAS)? Be sure to include metrics such as spend and revenue.
How about overall brand awareness? Include pre-click metrics such as impressions, clicks, CTR, view rate, etc.
By conveying the proper metrics and insights based on goals, it shows the client that you are listening to them. A win-win for everyone!
How To Edit A Report
Now that you’ve connected your data sources, it’s time to customize that report!
Let’s review this Google Ads template as an example.
First, you’ll want to make sure you’re in the “Edit” mode and not “View.”
 Screenshot from Google Ads, December 2022
You can start customizing your report by utilizing the data field sets on the right-hand side.
If you’ve chosen a template like the one above, the first step is to change the data source for each chart you wish to choose.
 Screenshot from Google Ads, December 2022
From there, you can choose from any of the different data fields from your chosen data source to change any visualization.


Not only can you create and edit charts and tables in Looker Studio, but the ability to choose the look and feel of a report is a game-changer for clients.
It gives a sense of consistency across an organization.
A few ways to personalize the style of your report include:
- Font and background color.
- Changing comparison metric colors.
- Text padding to align either left, center, or right.
Pro tip: If you want to change all scorecards or charts at once, simply select all at the same time before.
The style changes will apply to all selections. Another time-saver!
In this example, I changed the report background, scorecard colors, and label fonts to create brand standard consistency:


If you’re new to Looker Studio, it will take time, trial and error, and patience to create a report visual that meets your reader’s expectations. Don’t get discouraged along the way!
Adding Report Filters
An efficient way to group multiple visualizations together is by adding report and page filters.
For example, if you wanted all tables and charts to change when editing the date range, you could add a Date Range icon and set it to “Report Level.”
This means that if the report is comprised of multiple pages, whenever the date range is updated, all chart data updates alongside it.
For example, if you wanted to dive into Campaign Type performance, there’s a filter for that!
Simply navigate to the toolbar and choose Add a control > Drop-down list and add the Control field of “Campaign type” as your filter.


This allows you to filter the data on that particular page by campaign type.
For example, if you wanted to show how Search performs compared to YouTube, you’d choose from the dropdown in that filter.
By default, filters added are at a page level.
If you wish to make the filter report-level (meaning the filter would appear on each page of your report), simply right-click the filter and choose Make report-level.
Create A Chart
If you’ve gotten comfortable with your Looker Studio experience, let’s dive into how to create a chart from scratch.
The advantage of creating a custom chart is that you’re in full control from the beginning of visualizing exactly what matters most.
The first step is to consider who will be reading this report. Remember to include what data is important to them.
Your chart should tell a story, and it’s up to you to visualize that successfully.
For example, you may want to add an “Overview” table that encompasses the main metrics or key performance indicators (KPIs) that matter to them.
To create a chart, click on “Insert,” which will show you all the different charts to choose from. These include:
- Time series.
- Bar chart.
- Pie chart.
- Tables.
- Scorecards.
- Bullet charts.
- Much more.


In this example, I want to choose a simple bullet chart to add to my CMO Overview page. The goal of this chart is to show if we met our monthly goal of app installs.
The first step is to choose the metric you’re measuring. In this case, I chose “Installs.”
To make this bullet chart effective, you need to add your target/goal. Make sure to check the box that says “Show Target.”
Then, I input different range limits to show the progress.
I kept the last range the same as the target value. You can also put the last range as a higher value than your target, especially if you exceed that target value.


So, what does this chart say? It portrays that our goal was 5,500 app installs for the month of November.
According to the bullet chart, they were close to hitting their goal but didn’t quite make it.
Sometimes simple charts are all you need to represent the necessary data.
Like all other elements of Looker Studio, you can modify the style of any chart, table, or element as I did above.
Sharing Reports
The following options are available for sharing a Looker Studio report:
- Invite people.
- Schedule email delivery.
- Get report link.
- Embed report.
- Download report.


If you want to invite people to access the report in real time, it’s important to check the share settings.
To add someone via email, it must be a Google account email. They can be added as a “Viewer” or an “Editor.”


Another data safety measure Looker Studio added was how links to the report can be shared.
You can choose from:
- Restricted. Only people who you have shared the report with can open the link.
- Unlisted. Anyone on the internet with the link can view (or edit – choose this setting carefully).
- Public. Anyone on the internet with the link can find and view (or edit – choose this setting carefully).


Another cool feature Google added is the option to limit sharing in the following options. In the share settings, click on the “gear” icon in the right-hand corner:
- Prevent editors from changing access and adding new people.
- Disable downloading, printing, and copying for viewers.


I typically recommend checking the first box to prevent editors from changing access or adding new people.
By doing so, it allows us to maintain control of the report settings and the integrity of report changes.
Get Started With Looker Studio Now
Hopefully, this introduction to Google Looker Studio will empower you to feel more confident in creating personalized reports for your clients and brands.
More Resources:
Featured Image: RomanR/Shutterstock
window.addEventListener( ‘load’, function() {
setTimeout(function(){ striggerEvent( ‘load2’ ); }, 2000);
});
window.addEventListener( ‘load2’, function() {
if( sopp != ‘yes’ && addtl_consent != ‘1~’ && !ss_u ){
!function(f,b,e,v,n,t,s)
{if(f.fbq)return;n=f.fbq=function(){n.callMethod?
n.callMethod.apply(n,arguments):n.queue.push(arguments)};
if(!f._fbq)f._fbq=n;n.push=n;n.loaded=!0;n.version=’2.0′;
n.queue=[];t=b.createElement(e);t.async=!0;
t.src=v;s=b.getElementsByTagName(e)[0];
s.parentNode.insertBefore(t,s)}(window,document,’script’,
‘https://connect.facebook.net/en_US/fbevents.js’);
if( typeof sopp !== “undefined” && sopp === ‘yes’ ){
fbq(‘dataProcessingOptions’, [‘LDU’], 1, 1000);
}else{
fbq(‘dataProcessingOptions’, []);
}
fbq(‘init’, ‘1321385257908563’);
fbq(‘track’, ‘PageView’);
fbq(‘trackSingle’, ‘1321385257908563’, ‘ViewContent’, {
content_name: ‘google-looker-studio-beginner-guide’,
content_category: ‘analytics-data marketing-analytics’
});
}
});
SEO
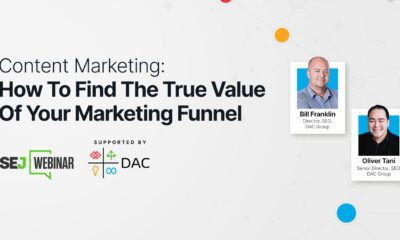
Measuring Content Impact Across The Customer Journey
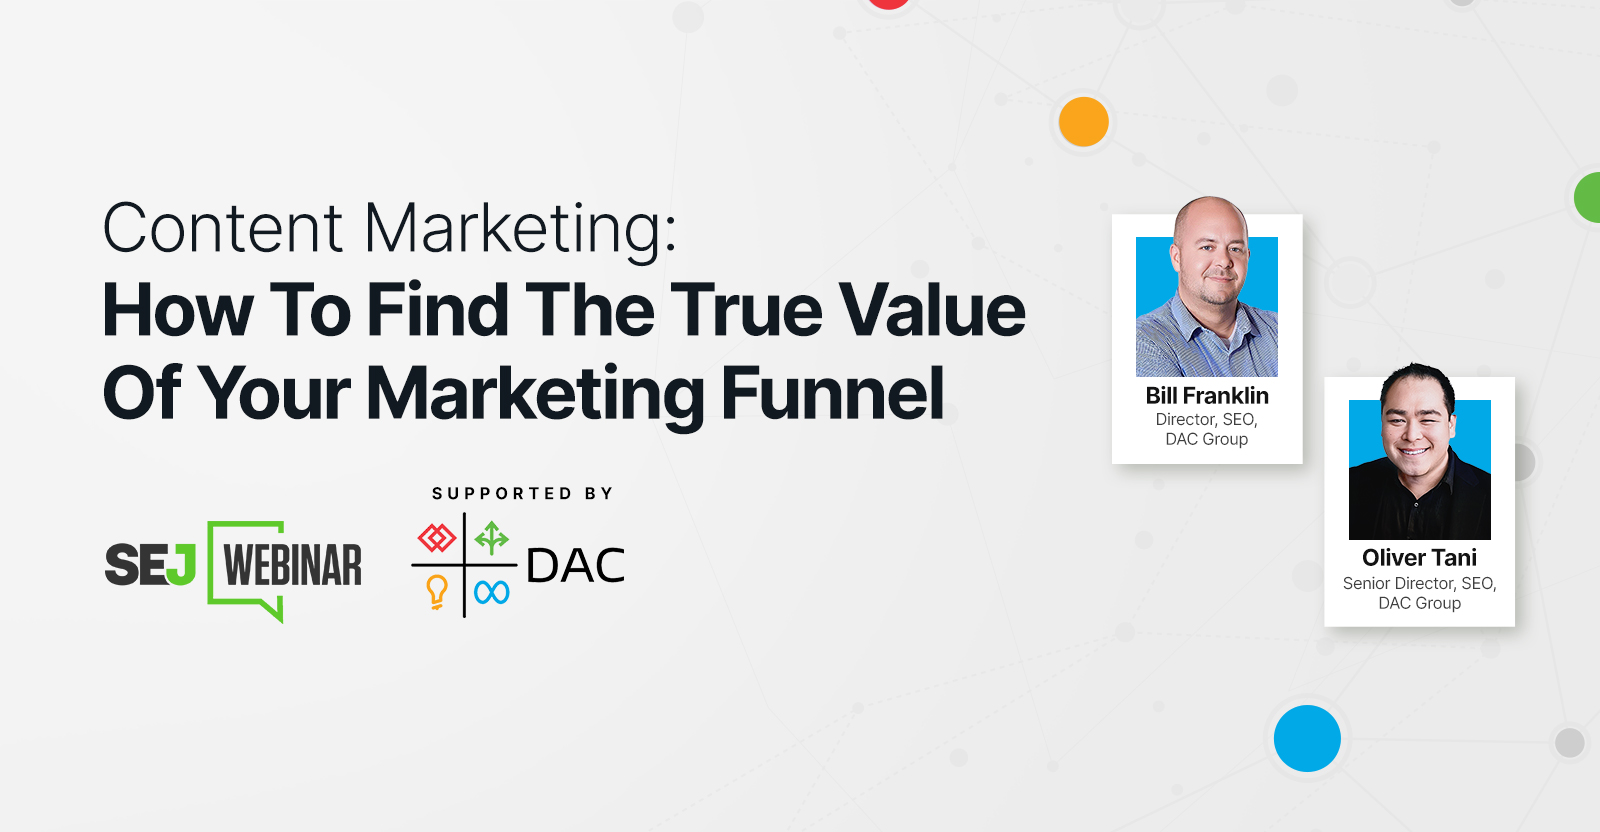
Understanding the impact of your content at every touchpoint of the customer journey is essential – but that’s easier said than done. From attracting potential leads to nurturing them into loyal customers, there are many touchpoints to look into.
So how do you identify and take advantage of these opportunities for growth?
Watch this on-demand webinar and learn a comprehensive approach for measuring the value of your content initiatives, so you can optimize resource allocation for maximum impact.
You’ll learn:
- Fresh methods for measuring your content’s impact.
- Fascinating insights using first-touch attribution, and how it differs from the usual last-touch perspective.
- Ways to persuade decision-makers to invest in more content by showcasing its value convincingly.
With Bill Franklin and Oliver Tani of DAC Group, we unravel the nuances of attribution modeling, emphasizing the significance of layering first-touch and last-touch attribution within your measurement strategy.
Check out these insights to help you craft compelling content tailored to each stage, using an approach rooted in first-hand experience to ensure your content resonates.
Whether you’re a seasoned marketer or new to content measurement, this webinar promises valuable insights and actionable tactics to elevate your SEO game and optimize your content initiatives for success.
View the slides below or check out the full webinar for all the details.
SEO
How to Find and Use Competitor Keywords
Competitor keywords are the keywords your rivals rank for in Google’s search results. They may rank organically or pay for Google Ads to rank in the paid results.
Knowing your competitors’ keywords is the easiest form of keyword research. If your competitors rank for or target particular keywords, it might be worth it for you to target them, too.
There is no way to see your competitors’ keywords without a tool like Ahrefs, which has a database of keywords and the sites that rank for them. As far as we know, Ahrefs has the biggest database of these keywords.
How to find all the keywords your competitor ranks for
- Go to Ahrefs’ Site Explorer
- Enter your competitor’s domain
- Go to the Organic keywords report
The report is sorted by traffic to show you the keywords sending your competitor the most visits. For example, Mailchimp gets most of its organic traffic from the keyword “mailchimp.”


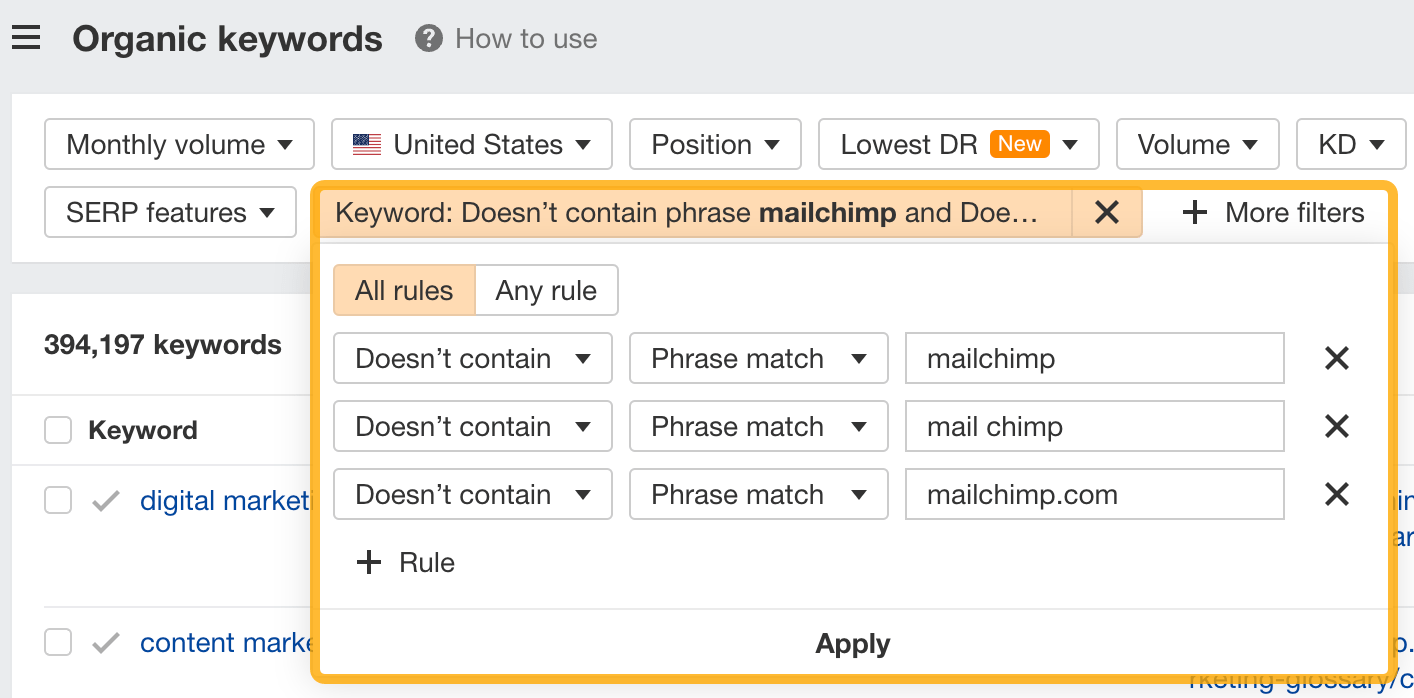
Since you’re unlikely to rank for your competitor’s brand, you might want to exclude branded keywords from the report. You can do this by adding a Keyword > Doesn’t contain filter. In this example, we’ll filter out keywords containing “mailchimp” or any potential misspellings:

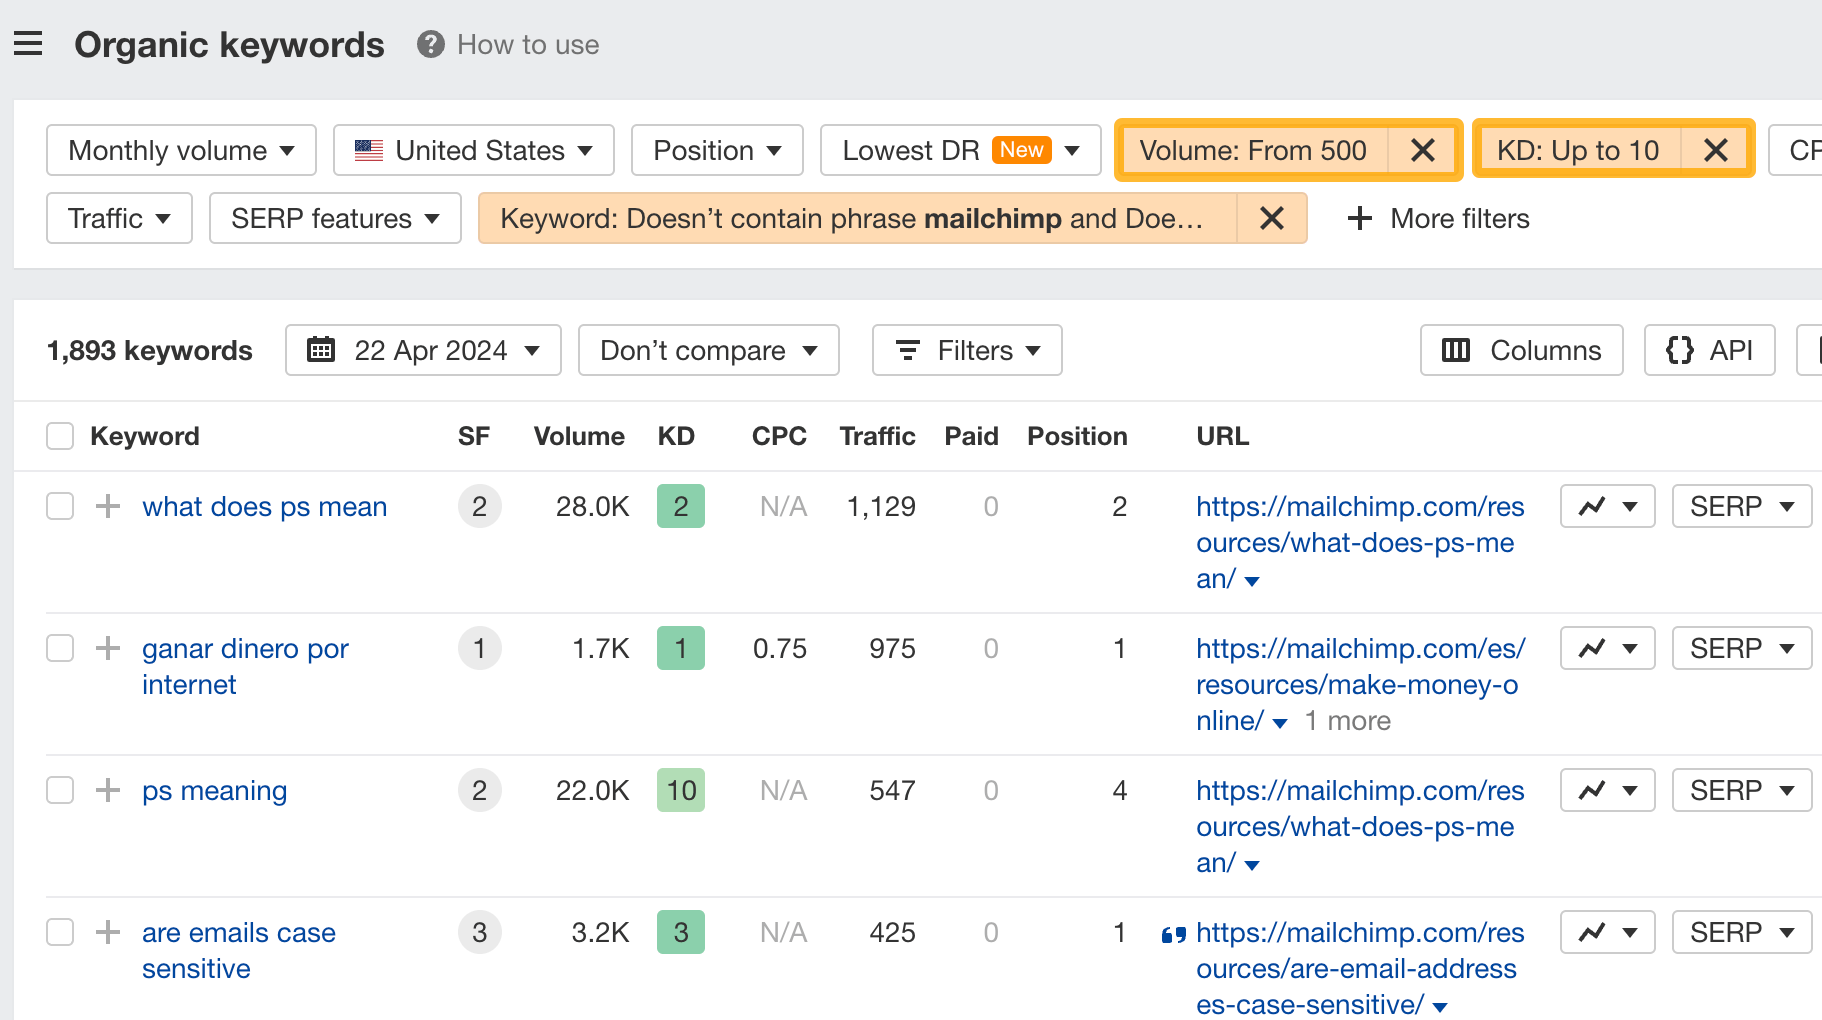
If you’re a new brand competing with one that’s established, you might also want to look for popular low-difficulty keywords. You can do this by setting the Volume filter to a minimum of 500 and the KD filter to a maximum of 10.

How to find keywords your competitor ranks for, but you don’t
- Go to Competitive Analysis
- Enter your domain in the This target doesn’t rank for section
- Enter your competitor’s domain in the But these competitors do section
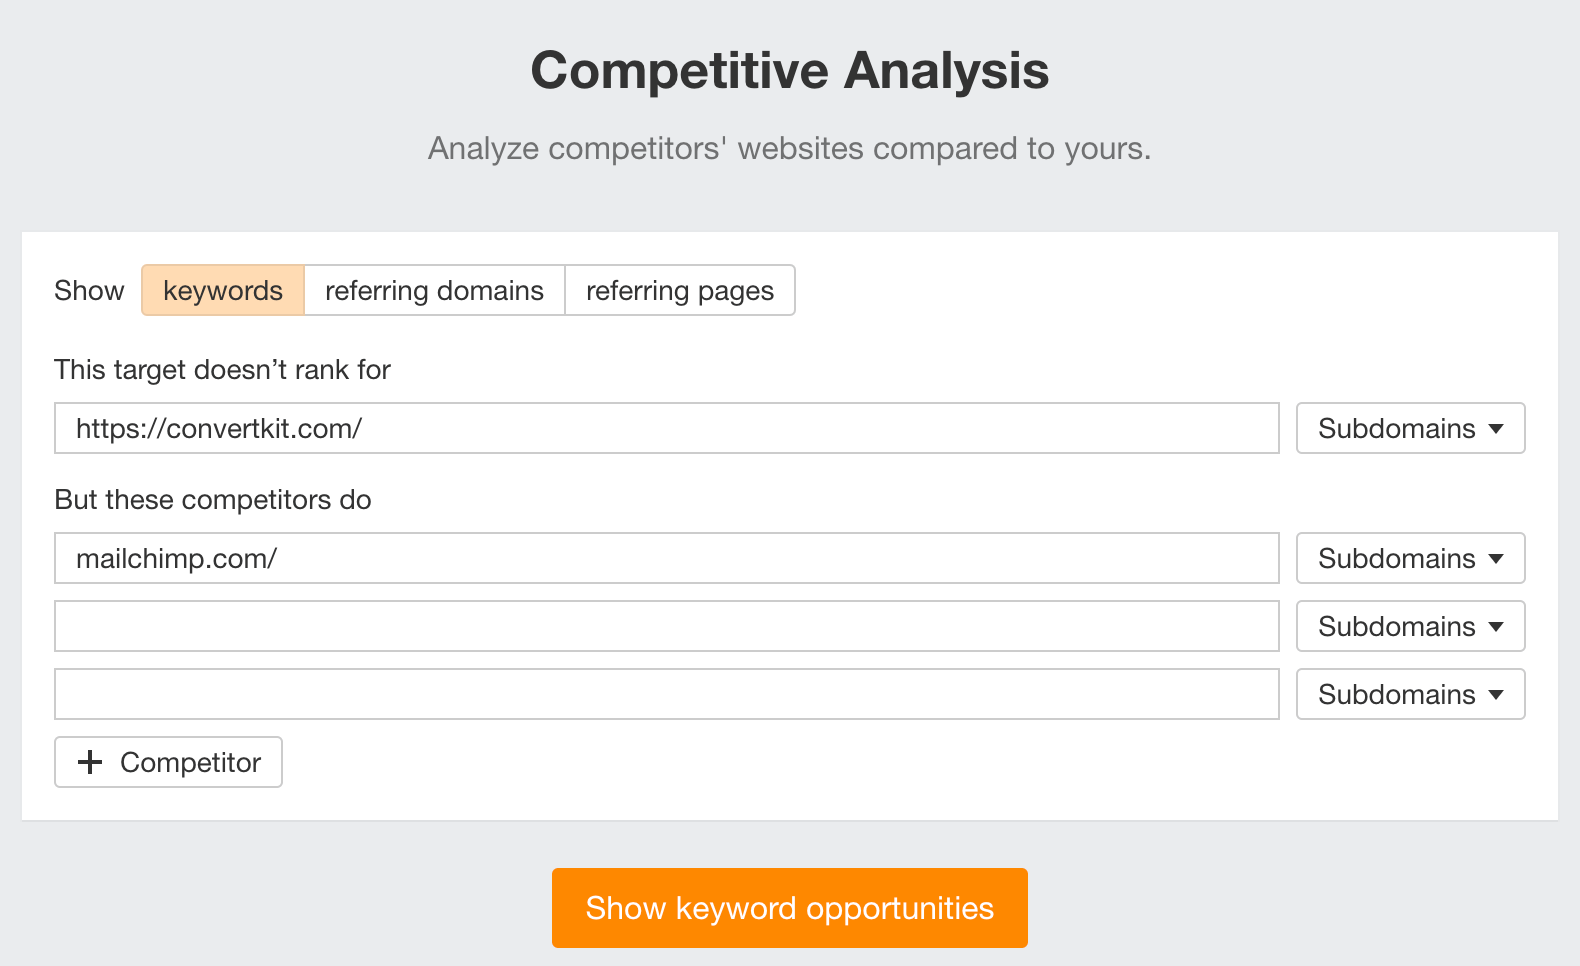

Hit “Show keyword opportunities,” and you’ll see all the keywords your competitor ranks for, but you don’t.
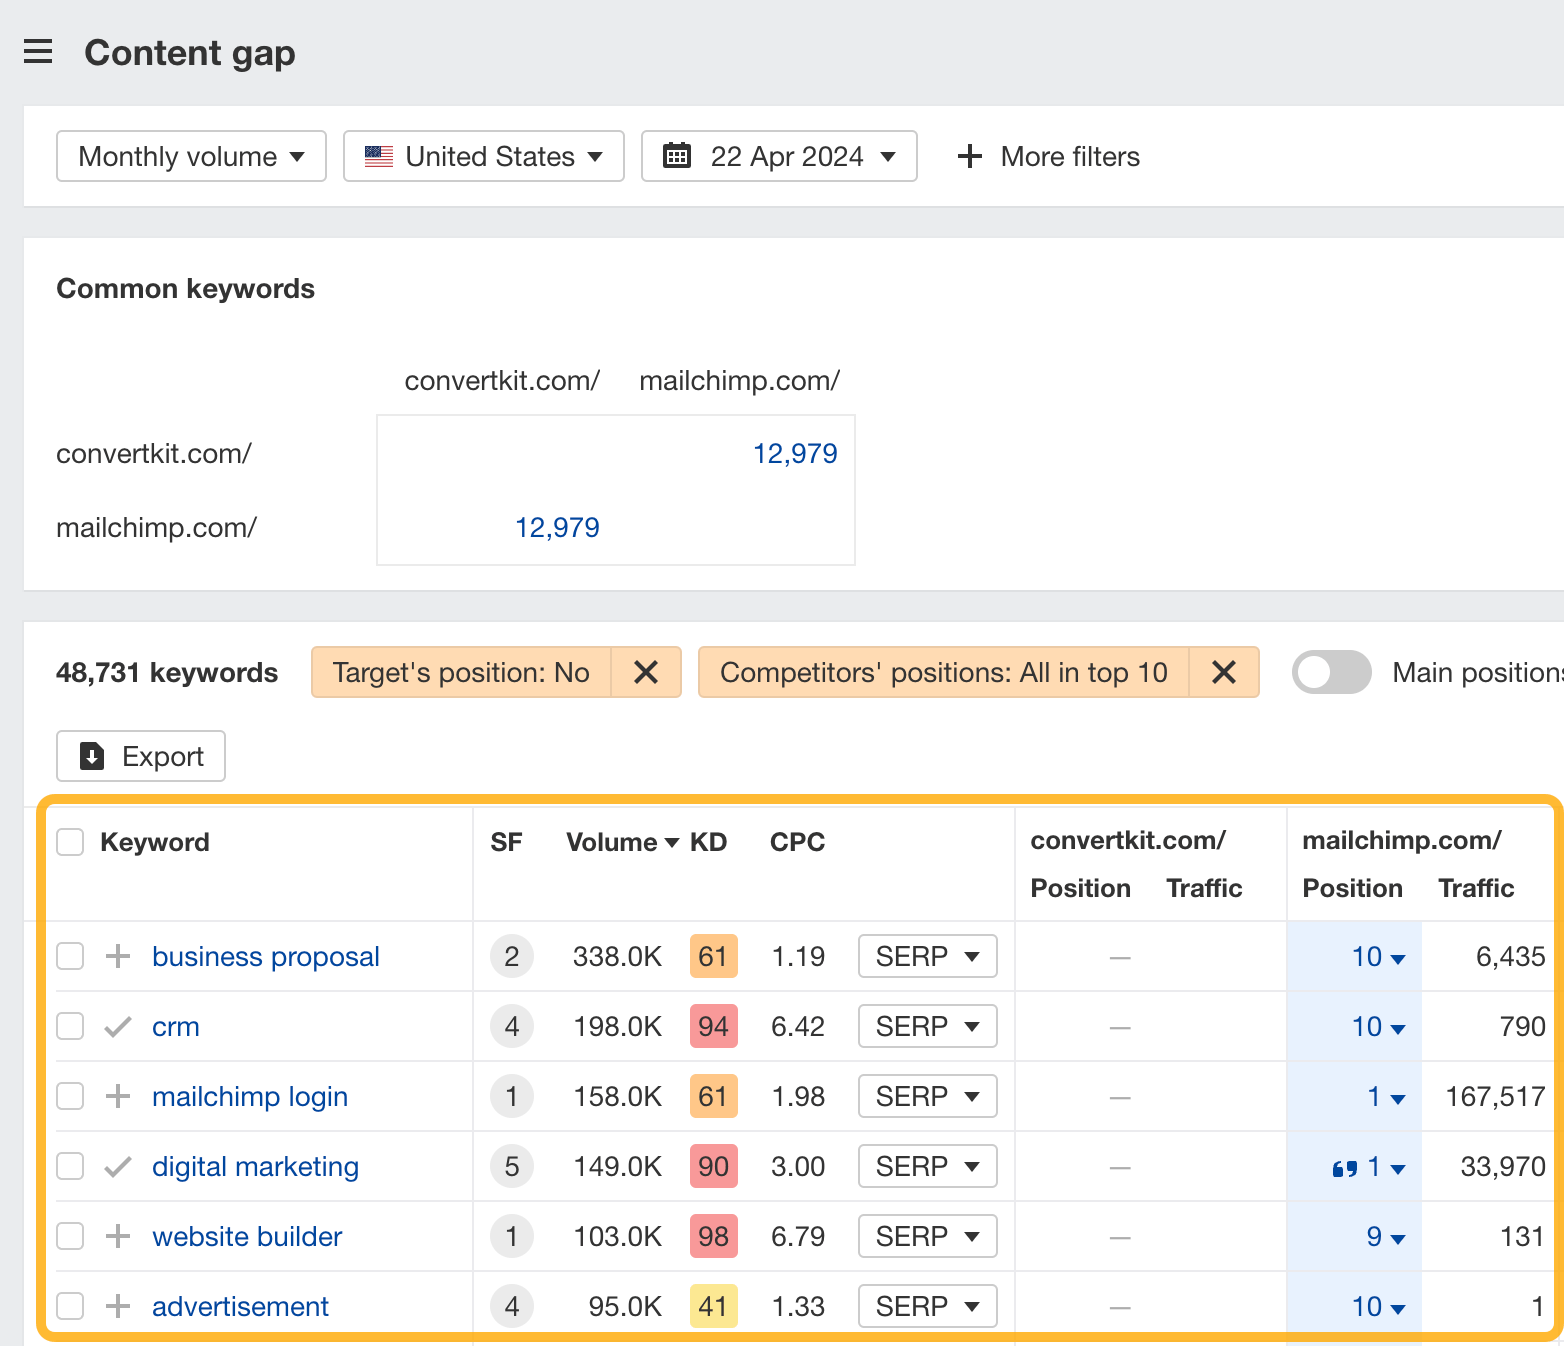

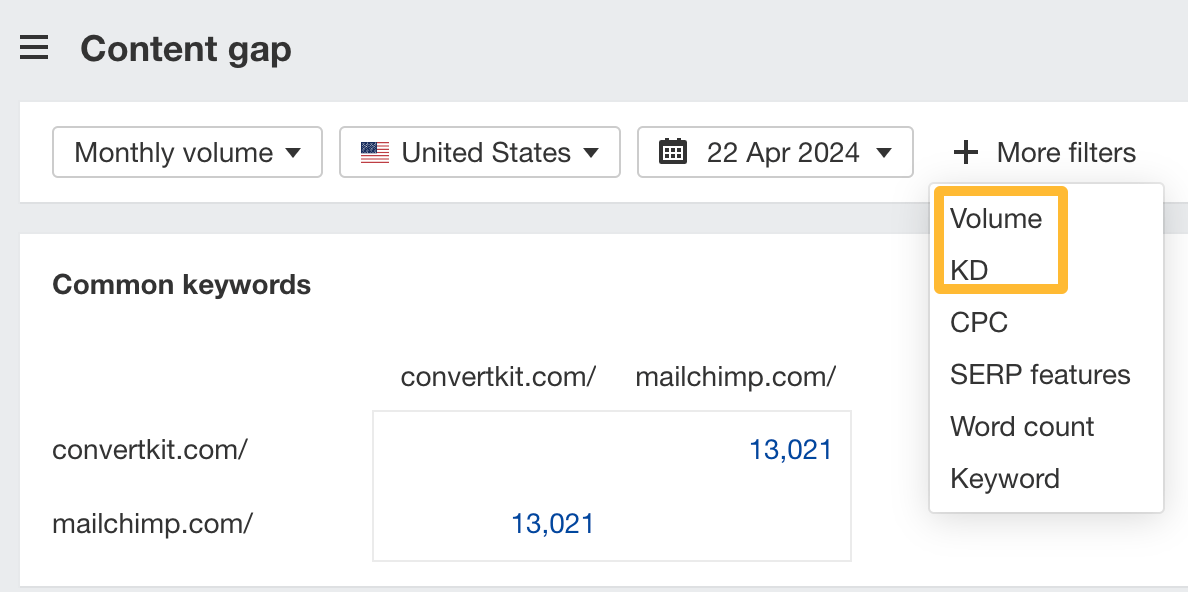
You can also add a Volume and KD filter to find popular, low-difficulty keywords in this report.

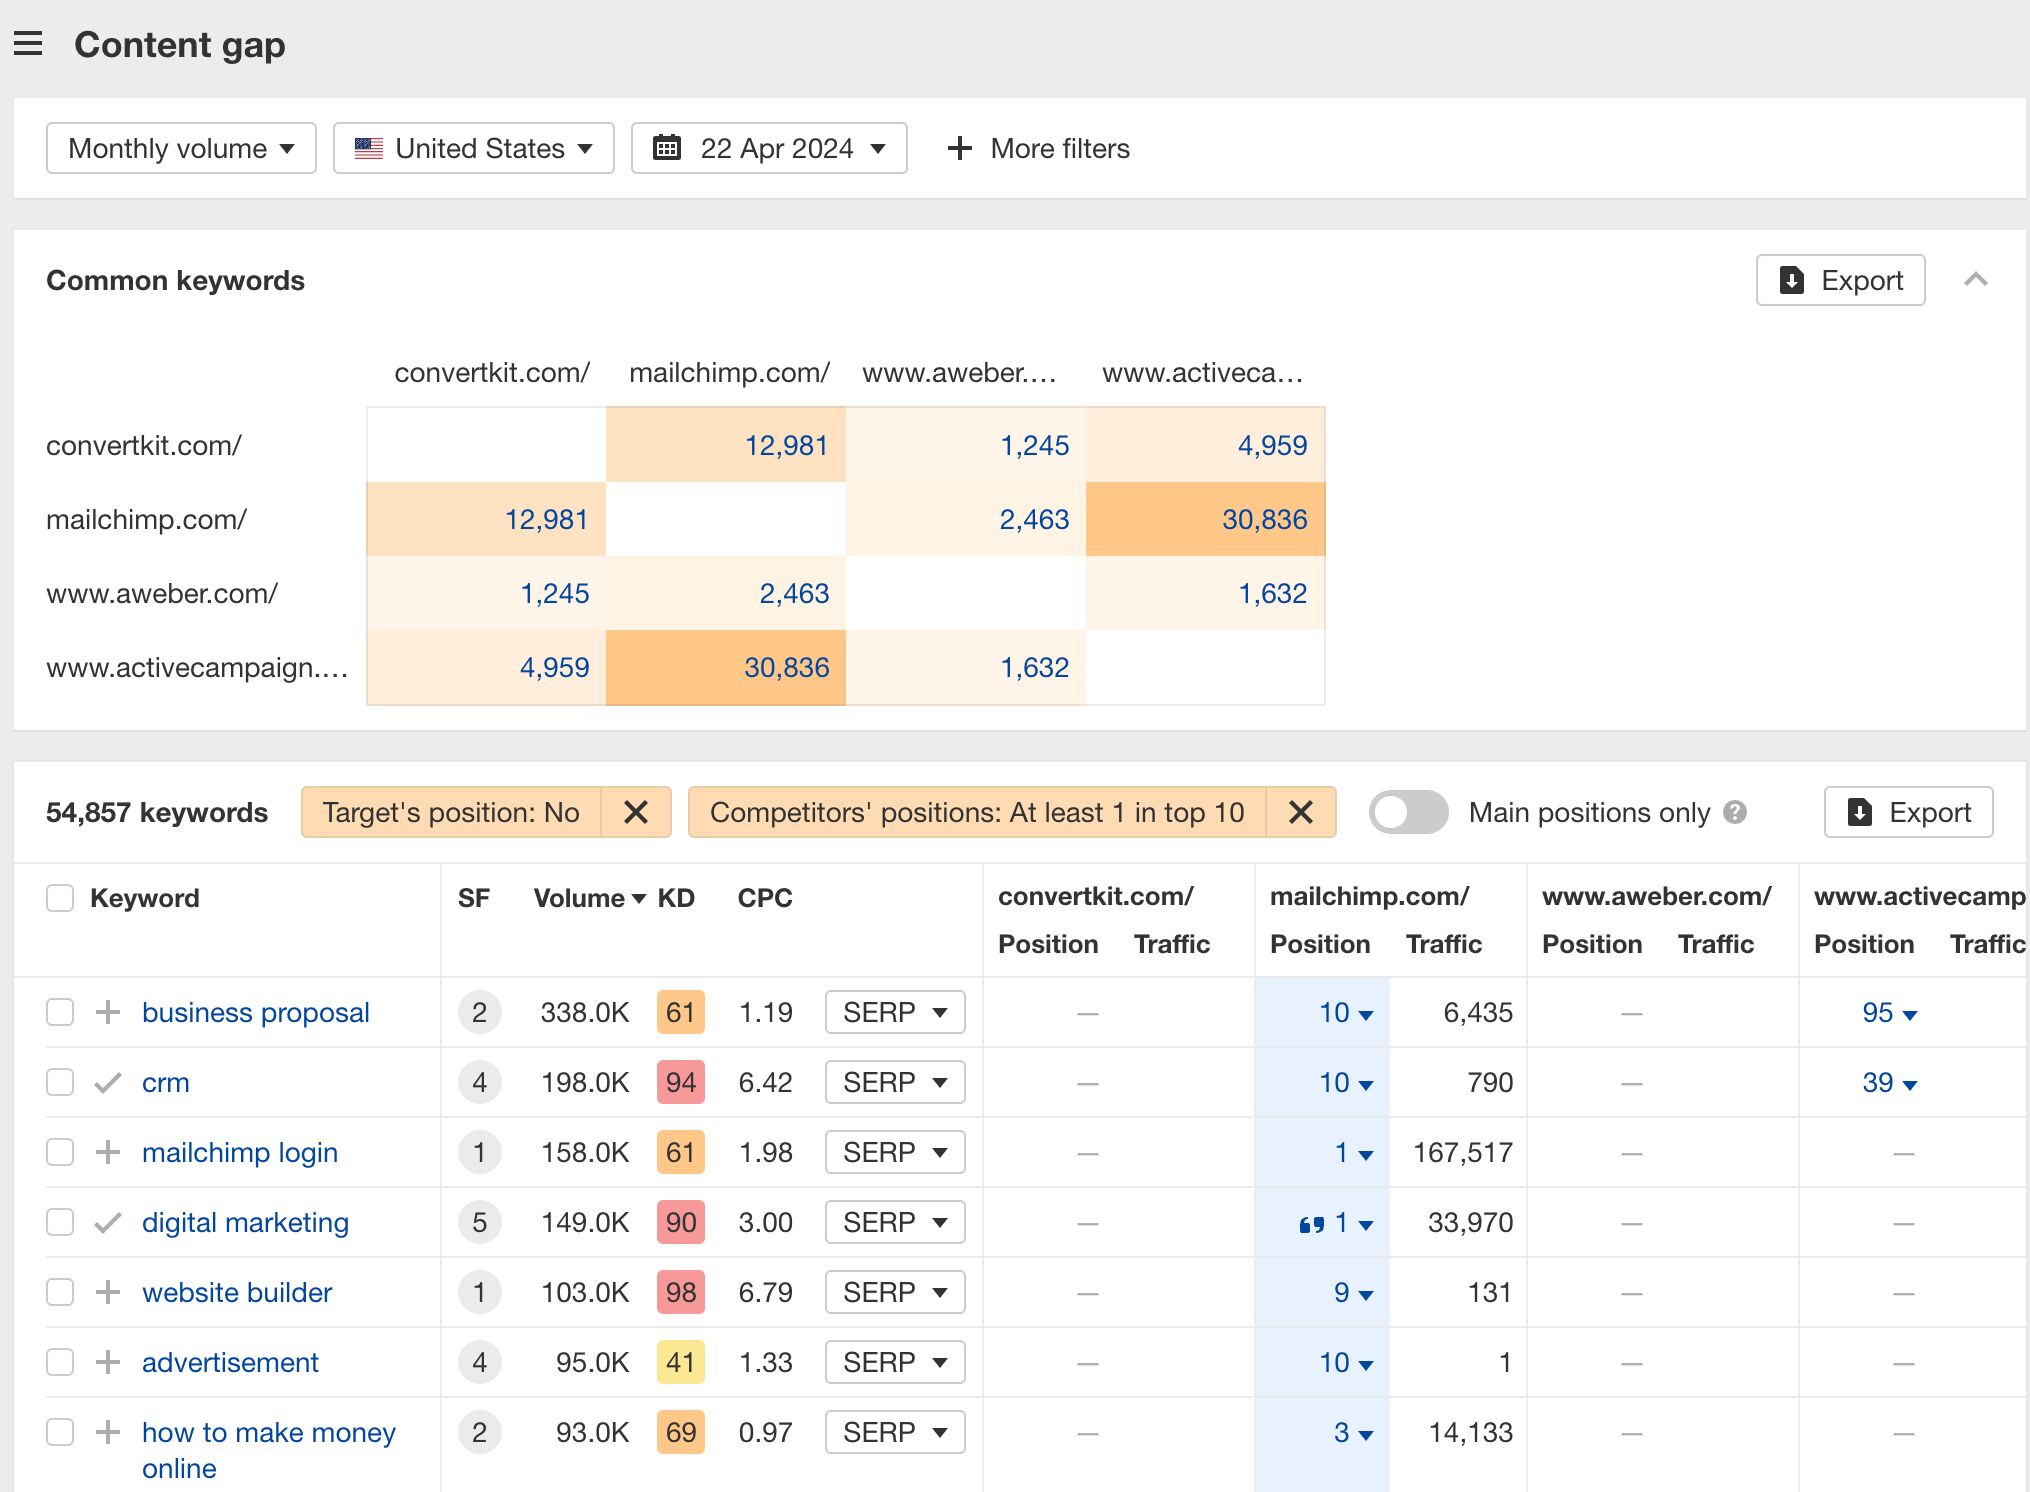
How to find keywords multiple competitors rank for, but you don’t
- Go to Competitive Analysis
- Enter your domain in the This target doesn’t rank for section
- Enter the domains of multiple competitors in the But these competitors do section
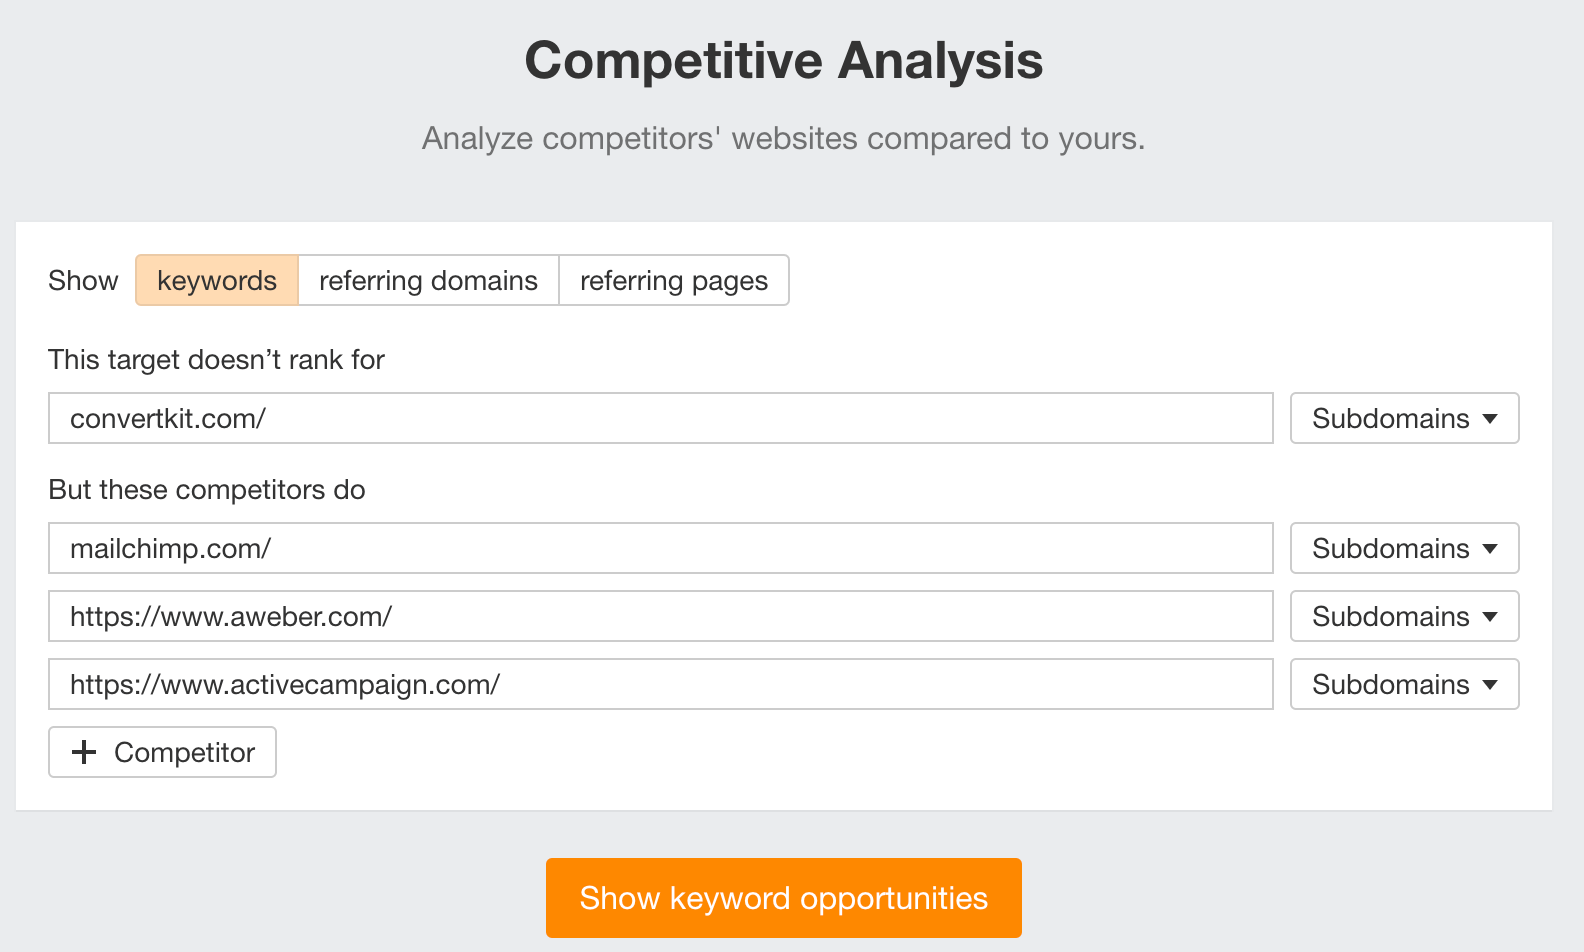

You’ll see all the keywords that at least one of these competitors ranks for, but you don’t.

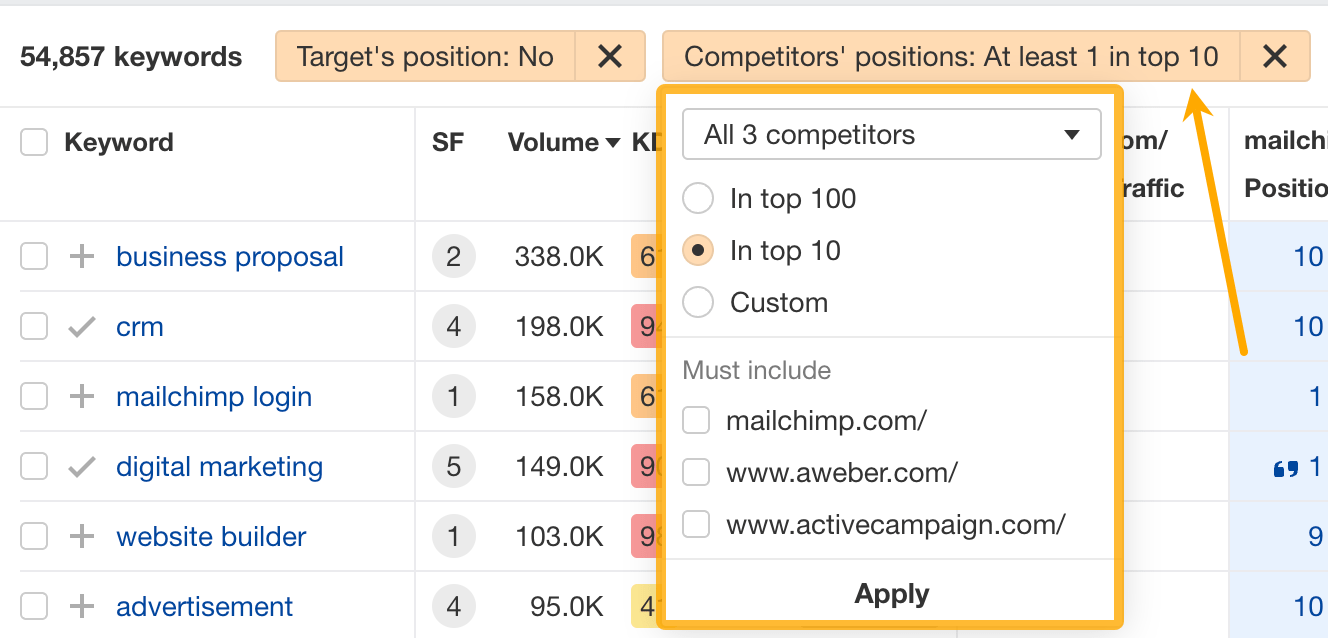
You can also narrow the list down to keywords that all competitors rank for. Click on the Competitors’ positions filter and choose All 3 competitors:

- Go to Ahrefs’ Site Explorer
- Enter your competitor’s domain
- Go to the Paid keywords report
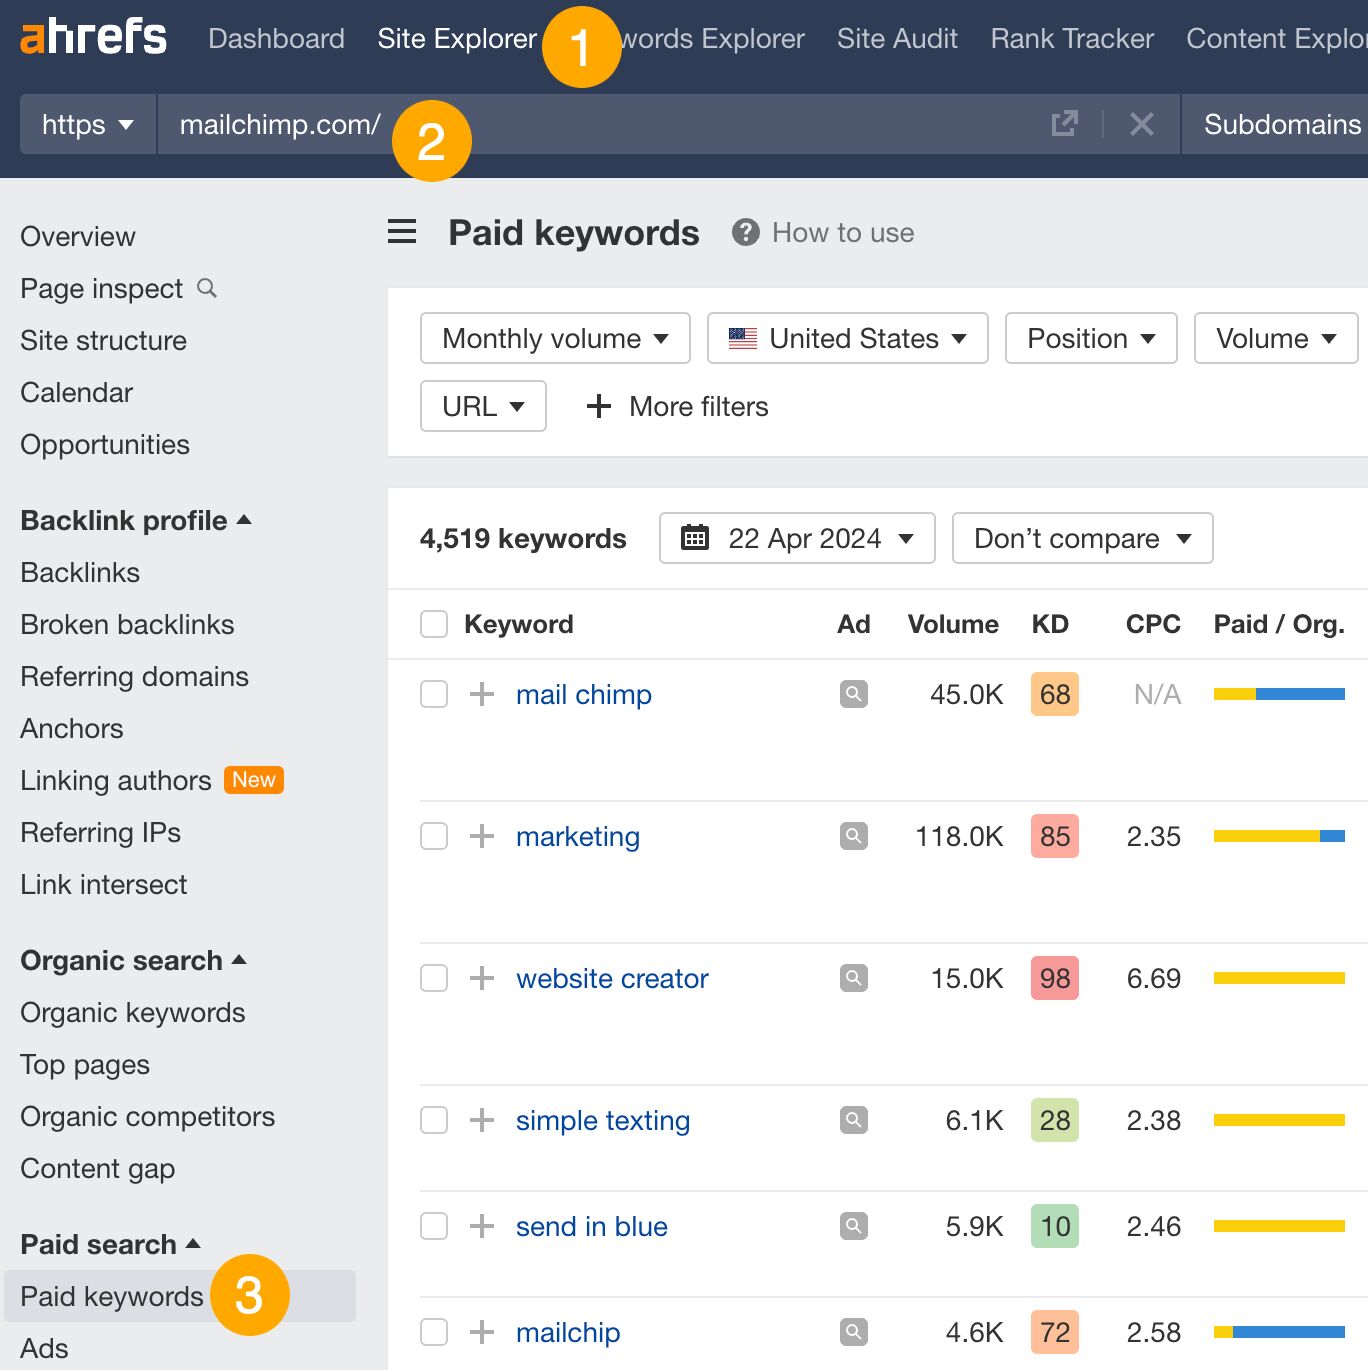

This report shows you the keywords your competitors are targeting via Google Ads.
Since your competitor is paying for traffic from these keywords, it may indicate that they’re profitable for them—and could be for you, too.
You know what keywords your competitors are ranking for or bidding on. But what do you do with them? There are basically three options.
1. Create pages to target these keywords
You can only rank for keywords if you have content about them. So, the most straightforward thing you can do for competitors’ keywords you want to rank for is to create pages to target them.
However, before you do this, it’s worth clustering your competitor’s keywords by Parent Topic. This will group keywords that mean the same or similar things so you can target them all with one page.
Here’s how to do that:
- Export your competitor’s keywords, either from the Organic Keywords or Content Gap report
- Paste them into Keywords Explorer
- Click the “Clusters by Parent Topic” tab
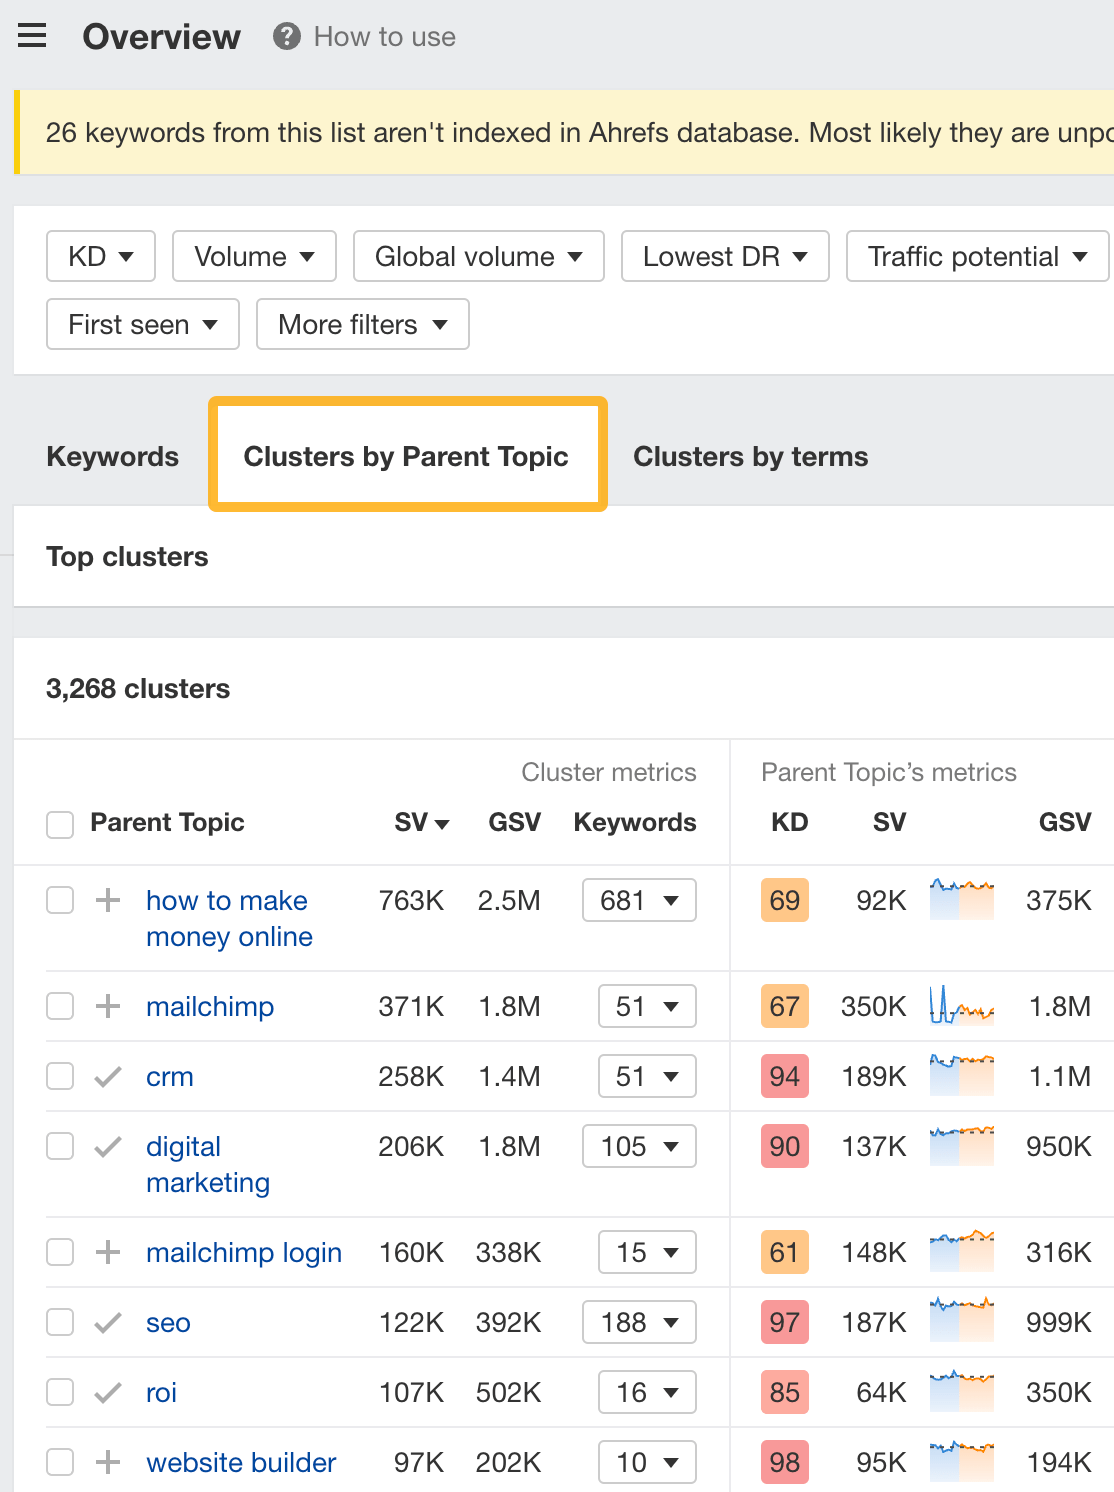

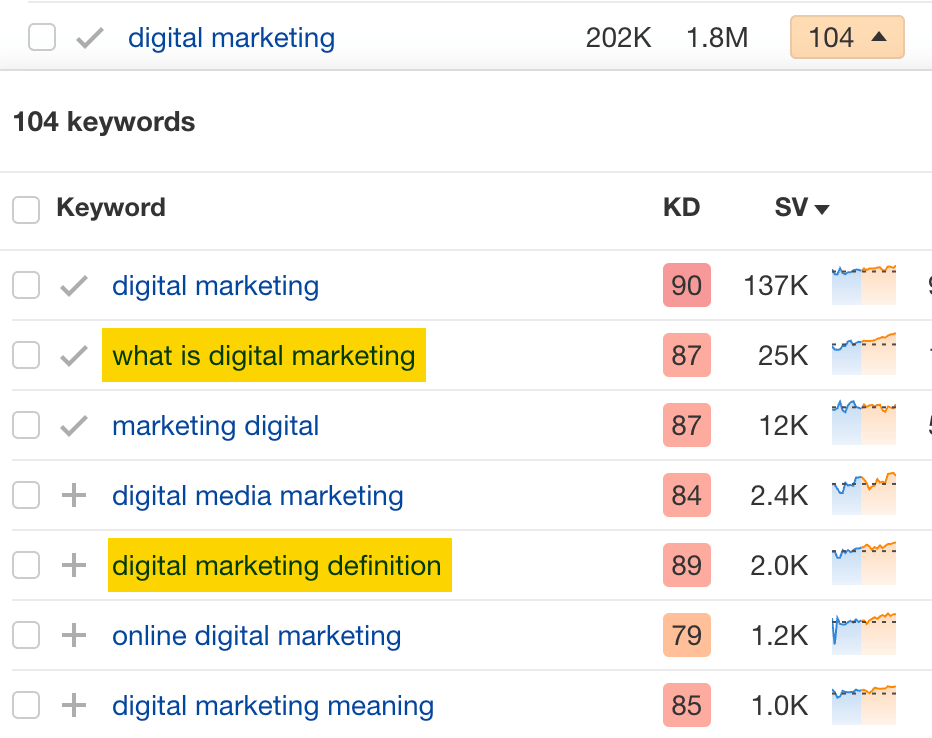
For example, MailChimp ranks for keywords like “what is digital marketing” and “digital marketing definition.” These and many others get clustered under the Parent Topic of “digital marketing” because people searching for them are all looking for the same thing: a definition of digital marketing. You only need to create one page to potentially rank for all these keywords.

2. Optimize existing content by filling subtopics
You don’t always need to create new content to rank for competitors’ keywords. Sometimes, you can optimize the content you already have to rank for them.
How do you know which keywords you can do this for? Try this:
- Export your competitor’s keywords
- Paste them into Keywords Explorer
- Click the “Clusters by Parent Topic” tab
- Look for Parent Topics you already have content about
For example, if we analyze our competitor, we can see that seven keywords they rank for fall under the Parent Topic of “press release template.”


If we search our site, we see that we already have a page about this topic.


If we click the caret and check the keywords in the cluster, we see keywords like “press release example” and “press release format.”
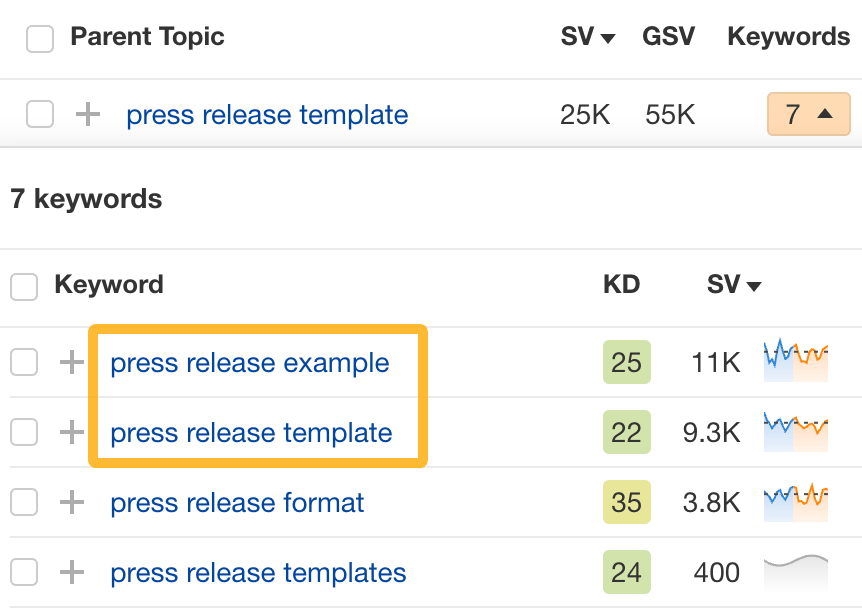

To rank for the keywords in the cluster, we can probably optimize the page we already have by adding sections about the subtopics of “press release examples” and “press release format.”
3. Target these keywords with Google Ads
Paid keywords are the simplest—look through the report and see if there are any relevant keywords you might want to target, too.
For example, Mailchimp is bidding for the keyword “how to create a newsletter.”


If you’re ConvertKit, you may also want to target this keyword since it’s relevant.
If you decide to target the same keyword via Google Ads, you can hover over the magnifying glass to see the ads your competitor is using.
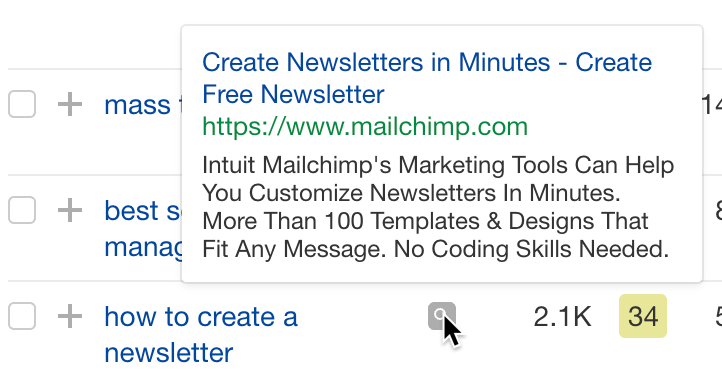

You can also see the landing page your competitor directs ad traffic to under the URL column.


Learn more
Check out more tutorials on how to do competitor keyword analysis:
SEO
Google Confirms Links Are Not That Important

Google’s Gary Illyes confirmed at a recent search marketing conference that Google needs very few links, adding to the growing body of evidence that publishers need to focus on other factors. Gary tweeted confirmation that he indeed say those words.
Background Of Links For Ranking
Links were discovered in the late 1990’s to be a good signal for search engines to use for validating how authoritative a website is and then Google discovered soon after that anchor text could be used to provide semantic signals about what a webpage was about.
One of the most important research papers was Authoritative Sources in a Hyperlinked Environment by Jon M. Kleinberg, published around 1998 (link to research paper at the end of the article). The main discovery of this research paper is that there is too many web pages and there was no objective way to filter search results for quality in order to rank web pages for a subjective idea of relevance.
The author of the research paper discovered that links could be used as an objective filter for authoritativeness.
Kleinberg wrote:
“To provide effective search methods under these conditions, one needs a way to filter, from among a huge collection of relevant pages, a small set of the most “authoritative” or ‘definitive’ ones.”
This is the most influential research paper on links because it kick-started more research on ways to use links beyond as an authority metric but as a subjective metric for relevance.
Objective is something factual. Subjective is something that’s closer to an opinion. The founders of Google discovered how to use the subjective opinions of the Internet as a relevance metric for what to rank in the search results.
What Larry Page and Sergey Brin discovered and shared in their research paper (The Anatomy of a Large-Scale Hypertextual Web Search Engine – link at end of this article) was that it was possible to harness the power of anchor text to determine the subjective opinion of relevance from actual humans. It was essentially crowdsourcing the opinions of millions of website expressed through the link structure between each webpage.
What Did Gary Illyes Say About Links In 2024?
At a recent search conference in Bulgaria, Google’s Gary Illyes made a comment about how Google doesn’t really need that many links and how Google has made links less important.
Patrick Stox tweeted about what he heard at the search conference:
” ‘We need very few links to rank pages… Over the years we’ve made links less important.’ @methode #serpconf2024″
Google’s Gary Illyes tweeted a confirmation of that statement:
“I shouldn’t have said that… I definitely shouldn’t have said that”
Why Links Matter Less
The initial state of anchor text when Google first used links for ranking purposes was absolutely non-spammy, which is why it was so useful. Hyperlinks were primarily used as a way to send traffic from one website to another website.
But by 2004 or 2005 Google was using statistical analysis to detect manipulated links, then around 2004 “powered-by” links in website footers stopped passing anchor text value, and by 2006 links close to the words “advertising” stopped passing link value, links from directories stopped passing ranking value and by 2012 Google deployed a massive link algorithm called Penguin that destroyed the rankings of likely millions of websites, many of which were using guest posting.
The link signal eventually became so bad that Google decided in 2019 to selectively use nofollow links for ranking purposes. Google’s Gary Illyes confirmed that the change to nofollow was made because of the link signal.
Google Explicitly Confirms That Links Matter Less
In 2023 Google’s Gary Illyes shared at a PubCon Austin that links were not even in the top 3 of ranking factors. Then in March 2024, coinciding with the March 2024 Core Algorithm Update, Google updated their spam policies documentation to downplay the importance of links for ranking purposes.
The documentation previously said:
“Google uses links as an important factor in determining the relevancy of web pages.”
The update to the documentation that mentioned links was updated to remove the word important.
Links are not just listed as just another factor:
“Google uses links as a factor in determining the relevancy of web pages.”
At the beginning of April Google’s John Mueller advised that there are more useful SEO activities to engage on than links.
Mueller explained:
“There are more important things for websites nowadays, and over-focusing on links will often result in you wasting your time doing things that don’t make your website better overall”
Finally, Gary Illyes explicitly said that Google needs very few links to rank webpages and confirmed it.
I shouldn’t have said that… I definitely shouldn’t have said that
— Gary 鯨理/경리 Illyes (so official, trust me) (@methode) April 19, 2024
Why Google Doesn’t Need Links
The reason why Google doesn’t need many links is likely because of the extent of AI and natural language undertanding that Google uses in their algorithms. Google must be highly confident in its algorithm to be able to explicitly say that they don’t need it.
Way back when Google implemented the nofollow into the algorithm there were many link builders who sold comment spam links who continued to lie that comment spam still worked. As someone who started link building at the very beginning of modern SEO (I was the moderator of the link building forum at the #1 SEO forum of that time), I can say with confidence that links have stopped playing much of a role in rankings beginning several years ago, which is why I stopped about five or six years ago.
Read the research papers
Authoritative Sources in a Hyperlinked Environment – Jon M. Kleinberg (PDF)
The Anatomy of a Large-Scale Hypertextual Web Search Engine
Featured Image by Shutterstock/RYO Alexandre
-

 PPC5 days ago
19 Best SEO Tools in 2024 (For Every Use Case)
-

 MARKETING6 days ago
Streamlining Processes for Increased Efficiency and Results
-
SEARCHENGINES6 days ago
Daily Search Forum Recap: April 17, 2024
-
 SEO6 days ago
An In-Depth Guide And Best Practices For Mobile SEO
-

 PPC6 days ago
97 Marvelous May Content Ideas for Blog Posts, Videos, & More
-
SEARCHENGINES5 days ago
Daily Search Forum Recap: April 18, 2024
-

 MARKETING6 days ago
Ecommerce evolution: Blurring the lines between B2B and B2C
-
SEARCHENGINES4 days ago
Daily Search Forum Recap: April 19, 2024







You must be logged in to post a comment Login