MARKETING
How Your Company’s Attrition Rate Could Be Impacting Your Business

Happy employees are the key to a successful business. According to the University of Oxford, happy employees are 13% more productive. High employee satisfaction can go a long way towards your bottom line.
Of course, when your employees are not happy, that shows too. You’ll likely see a slowdown in productivity, a change in the work environment, and you may start seeing an increase in employee turnover.
What have you noticed in your own organization? Are employees loyal and in it for the long haul, or are they leaving in droves? If you’ve been seeing more and more employees leaving the company in a short amount of time, it might be time to calculate your attrition rate and examine what’s really going on in your organization.
There are a variety of metrics that you can use to determine how your employees are doing. Many of them focus on productivity metrics such as progress to goals. However, these productivity metrics don’t tell the whole story.
That’s why it’s important to understand your attrition rate to help determine the health of your organization. Let’s discuss what an attrition rate is and how to lower it.
Attrition Rate
The attrition rate measures the rate at which employees leave an organization during a specific period of time. It’s commonly referred to as a churn rate and can provide insightful information regarding employee satisfaction.
Understanding your team’s attrition rate is important for the health of your organization because having a high attrition rate can have devastating impacts on your team’s success. With too many experienced team members leaving at once, you run the risk of losing valuable organizational knowledge and losing revenue from repeated hiring and onboarding costs.
Now that you know what an attrition rate is, let’s review how to calculate it for your organization.
How To Calculate Attrition Rate
To calculate the attrition rate, take the number of people who have left your company (or team) and divide it by the average number of employees over a period of time. You then multiply that figure by 100 to present it as a percentage.

Let’s say at the end of the year you had 500 employees in your organization. During the first quarter of the following year, 100 employees left. This would leave you with an attrition rate of 20% for that time period.
It’s worth noting that a team’s attrition rate can be subjective based on the size of the company. Though there is no single number that is considered a good or bad attrition rate, later on, we’ll cover the important factors to keep in mind when reviewing your team’s attrition data, and when to take action.
Before we dive into that, we need to understand that not all employee exits are created equal. There are four different types of attrition and each one may be saying something different.
Types of Attrition
People leave jobs for various reasons – some voluntary and some involuntary. Let’s look at the four categories of attrition and what they mean.
- Voluntary attrition occurs when an employee chooses to leave a position on their own accord.
- Involuntary attrition occurs when an employee has been released from the company.
- Internal attrition occurs when employees move from one position to another within the same company.
- Demographic-specific attrition occurs when there is a noticeable pattern of a specific group leaving a team or company during a given time period (this can be age, gender, ethnicity, parental status, etc.)
Internal attrition is generally not a cause for concern. If employees feel comfortable staying within the same company, it’s often because overall, the culture is good and they are just looking for a promotion or new opportunity.
This can, however, be an issue if an entire department makes an exodus to other areas of the company. This suggests that you may have a management problem in that area.
Next would be involuntary attrition. These employees are being asked to leave the company. They may have been performing below expectations or weren’t a good fit for the role. When this happens, it’s a good idea to review hiring procedures and guidelines to ensure your team is hiring individuals who have the best chance at being successful in their role.
Voluntary attrition is much more concerning. If you have a large number of employees leaving the company at once, there may be an issue with your company culture, management, or compensation. In a bit, we’ll discuss how to identify and correct these issues.
Finally, if you are seeing demographic-specific attrition, there may be a very big problem at play. When people of the same gender, age group, ethnicity, sexual orientation, parental status, or any other personal characteristic are leaving en masse, it may be because of systemic issues in how your company is structured and operated. A close examination of your culture and operations is warranted.
High Attrition Rate
As mentioned above, attrition rates are relative depending on the size of the company. To understand if your attrition rate is higher than it should be, compare your attrition rate to your retention rate for the same time period. Your retention rate measures the number of employees who have remained in your organization.
To calculate your retention rate, divide the number of employees who have remained in your organization by the number of employees you started with (this should be the same figure you use to calculate your attrition rate) and divide this number by 100.
If you suspect a high attrition rate, it’s important to compare your numbers to other companies in your industry, in your geographic location, and within the company, compare departmental attrition numbers to other areas of your business. These comparisons will alert you to any problems or may put your mind at ease.
Aside from the possibility of having an unhappy team, there are several other problems that can occur when your attrition rate is high.
- Frustrated Employees – When someone leaves, their work doesn’t stop getting done. Often other employees will have to take over their responsibilities until a backfill is hired. In some instances, that individual’s role may not be filled, and their work may be absorbed by other members of their team which could lead to overwhelm and burnout.
- Team Dynamic – While you may not love everyone you work with, professional teams have often built rapport with one another. When one person (or more) leaves the team, there is an adjustment period that can be felt throughout the department.
- Loss of Knowledge – If an employee chooses to leave, they will sometimes provide enough notice to document their processes and procedures for their replacement. However, even when they do, it’s unlikely that they’ll be able to provide them with the depth of knowledge they have accrued during their tenure.
- Resource Constraints – Hiring costs can add up. It’s estimated that it costs about 50-60% of the departing employee’s salary to hire a replacement for their role.
Average Attrition Rate
With all this talk of attrition rates, you’re probably wondering how your company compares to other organizations out there.
First, it’s important to note that attrition rates can depend on a lot of different factors. As you can imagine, the stress level in certain industries and roles is considerably higher than in others. This may sometimes account for higher attrition rates. Geographic concerns such as rising home costs could also impact the number of employees leaving their jobs.
In 2021, the US Bureau of Labor Statistics reported the average turnover rate was 57.3% across industries.
Low Attrition Rate
It is important to note that while a high attrition rate can be bad for business for the reasons listed above, an extremely low rate could be detrimental as well. Why? Because without the ability to bring new employees who offer unique perspectives and skillsets to a team, an organization could reach a point of stagnation.
Bringing new people to the table can increase ingenuity and creativity, and help a company make positive changes.
How to Lower Your Attrition Rate
If you’ve calculated your attrition rate, compared it to other departments and other companies, and deemed it high, it’s time to get to work. There are a number of actions you can take to lower this attrition rate and put your company back on the right path.
The most important step is getting to the root of the problem. What is causing employees to leave? This is the biggest piece of information you need to make the correct changes.
Conduct Exit Interviews
There is nothing more valuable than feedback from an employee who has nothing to lose by being completely honest. You can set up a formal exit interview as employees give notice.
You’ll want to discuss a number of aspects of the business with them, including:
- Pay and Benefits – Your employees may be leaving simply because another company is offering them more.
- Recognition and Appreciation – Did they feel as if they were appreciated for their hard work?
- Management – If multiple former employees point towards the same manager as a source of their issues, you may have a leadership problem on your hands.
- Culture – Were they happy working for you? Were there aspects of the job and the atmosphere that caused stress or frustration?
- Mental Health – Even the best compensation can’t make up for unbearable stress. Were workloads too heavy? Was there an unhealthy work environment for employees?
- Safety – Did they feel that their safety was in danger as they carried out their responsibilities? If so, did they feel comfortable bringing their concerns to management? If they did speak to management, did they feel heard, and were any changes made?
Staff Interviews or Surveys
While current employees may feel more hesitant to air grievances, they can still offer valuable insight into the employee experience. While you may have workers willing to talk about their perceived issues, you may receive more thorough and honest feedback using anonymous surveys.
If you do choose to speak one-on-one with employees, avoid having interviews be conducted by their manager. If the problem is with management and leadership, they may not feel comfortable providing honest feedback.
Finally, if you do seek any feedback from current employees, ensure that their honesty is confidential. If any information shared in confidence becomes public knowledge traceable back to a specific employee, it can be a breach of trust and inhibit future feedback.
Employees leaving is a symptom of a problem, not the problem itself. While a high attrition rate can be concerning in any organization, it’s important to do the work and find out what’s actually causing the issue. Once you’ve identified areas for improvement, seek to make the necessary changes for your team.
Source link
MARKETING
Should Your Brand Shout Its AI and Marketing Plan to the World?

To use AI or not to use AI, that is the question.
Let’s hope things work out better for you than they did for Shakespeare’s mad Danish prince with daddy issues.
But let’s add a twist to that existential question.
CMI’s chief strategy officer, Robert Rose, shares what marketers should really contemplate. Watch the video or read on to discover what he says:
Should you not use AI and be proud of not using it? Dove Beauty did that last week.
Should you use it but keep it a secret? Sports Illustrated did that last year.
Should you use AI and be vocal about using it? Agency giant Brandtech Group picked up the all-in vibe.
Should you not use it but tell everybody you are? The new term “AI washing” is hitting everywhere.
What’s the best option? Let’s explore.
Dove tells all it won’t use AI
Last week, Dove, the beauty brand celebrating 20 years of its Campaign for Real Beauty, pledged it would NEVER use AI in visual communication to portray real people.
In the announcement, they said they will create “Real Beauty Prompt Guidelines” that people can use to create images representing all types of physical beauty through popular generative AI programs. The prompt they picked for the launch video? “The most beautiful woman in the world, according to Dove.”
I applaud them for the powerful ad. But I’m perplexed by Dove issuing a statement saying it won’t use AI for images of real beauty and then sharing a branded prompt for doing exactly that. Isn’t it like me saying, “Don’t think of a parrot eating pizza. Don’t think about a parrot eating pizza,” and you can’t help but think about a parrot eating pizza right now?
Brandtech Group says it’s all in on AI
Now, Brandtech Group, a conglomerate ad agency, is going the other way. It’s going all-in on AI and telling everybody.
This week, Ad Age featured a press release — oops, I mean an article (subscription required) — with the details of how Brandtech is leaning into the takeaway from OpenAI’s Sam Altman, who says 95% of marketing work today can be done by AI.
A Brandtech representative talked about how they pitch big brands with two people instead of 20. They boast about how proud they are that its lean 7,000 staffers compete with 100,000-person teams. (To be clear, showing up to a pitch with 20 people has never been a good thing, but I digress.)
OK, that’s a differentiated approach. They’re all in. Ad Age certainly seemed to like it enough to promote it. Oops, I mean report about it.
False claims of using AI and not using AI
Offshoots of the all-in and never-will approaches also exist.
The term “AI washing” is de rigueur to describe companies claiming to use AI for something that really isn’t AI. The US Securities and Exchange Commission just fined two companies for using misleading statements about their use of AI in their business model. I know one startup technology organization faced so much pressure from their board and investors to “do something with AI” that they put a simple chatbot on their website — a glorified search engine — while they figured out what they wanted to do.
Lastly and perhaps most interestingly, companies have and will use AI for much of what they create but remain quiet about it or desire to keep it a secret. A recent notable example is the deepfake ad of a woman in a car professing the need for people to use a particular body wipe to get rid of body odor. It was purported to be real, but sharp-eyed viewers suspected the fake and called out the company, which then admitted it. Or was that the brand’s intent all along — the AI-use outrage would bring more attention?
This is an AI generated influencer video.
Looks 100% real. Even the interior car detailing.
UGC content for your brand is about to get really cheap. ☠️ pic.twitter.com/2m10RqoOW3
— Jon Elder | Amazon Growth | Private Label (@BlackLabelAdvsr) March 26, 2024
To yell or not to yell about your brand’s AI decision
Should a brand yell from a mountaintop that they use AI to differentiate themselves a la Brandtech? Or should a brand yell they’re never going to use AI to differentiate themselves a la Dove? Or should a brand use it and not yell anything? (I think it’s clear that a brand should not use AI and lie and say it is. That’s the worst of all choices.)
I lean far into not-yelling-from-mountaintop camp.
When I see a CEO proudly exclaim that they laid off 90% of their support workforce because of AI, I’m not surprised a little later when the value of their service is reduced, and the business is failing.
I’m not surprised when I hear “AI made us do it” to rationalize the latest big tech company latest rounds of layoffs. Or when a big consulting firm announces it’s going all-in on using AI to replace its creative and strategic resources.
I see all those things as desperate attempts for short-term attention or a distraction from the real challenge. They may get responses like, “Of course, you had to lay all those people off; AI is so disruptive,” or “Amazing. You’re so out in front of the rest of the pack by leveraging AI to create efficiency, let me cover your story.” Perhaps they get this response, “Your company deserves a bump in stock price because you’re already using this fancy new technology.”
But what happens if the AI doesn’t deliver as promoted? What happens the next time you need to lay off people? What happens the next time you need to prove your technologically forward-leaning?
Yelling out that you’re all in on a disruptive innovation, especially one the public doesn’t yet trust a lot is (at best) a business sugar high. That short-term burst of attention may or may not foul your long-term brand value.
Interestingly, the same scenarios can manifest when your brand proclaims loudly it is all out of AI, as Dove did. The sugar high may not last and now Dove has itself into a messaging box. One slip could cause distrust among its customers. And what if AI gets good at demonstrating diversity in beauty?
I tried Dove’s instructions and prompted ChatGPT for a picture of “the most beautiful woman in the world according to the Dove Real Beauty ad.”
It gave me this. Then this. And this. And finally, this.
She’s absolutely beautiful, but she doesn’t capture the many facets of diversity Dove has demonstrated in its Real Beauty campaigns. To be clear, Dove doesn’t have any control over generating the image. Maybe the prompt worked well for Dove, but it didn’t for me. Neither Dove nor you can know how the AI tool will behave.
To use AI or not to use AI?
When brands grab a microphone to answer that question, they work from an existential fear about the disruption’s meaning. They do not exhibit the confidence in their actions to deal with it.
Let’s return to Hamlet’s soliloquy:
Thus conscience doth make cowards of us all;
And thus the native hue of resolution
Is sicklied o’er with the pale cast of thought,
And enterprises of great pith and moment
With this regard their currents turn awry
And lose the name of action.
In other words, Hamlet says everybody is afraid to take real action because they fear the unknown outcome. You could act to mitigate or solve some challenges, but you don’t because you don’t trust yourself.
If I’m a brand marketer for any business (and I am), I’m going to take action on AI for my business. But until I see how I’m going to generate value with AI, I’m going to be circumspect about yelling or proselytizing how my business’ future is better.
HANDPICKED RELATED CONTENT:
Cover image by Joseph Kalinowski/Content Marketing Institute
MARKETING
How to Use AI For a More Effective Social Media Strategy, According to Ross Simmonds

Welcome to Creator Columns, where we bring expert HubSpot Creator voices to the Blogs that inspire and help you grow better.
It’s the age of AI, and our job as marketers is to keep up.
My team at Foundation Marketing recently conducted an AI Marketing study surveying hundreds of marketers, and more than 84% of all leaders, managers, SEO experts, and specialists confirmed that they used AI in the workplace.
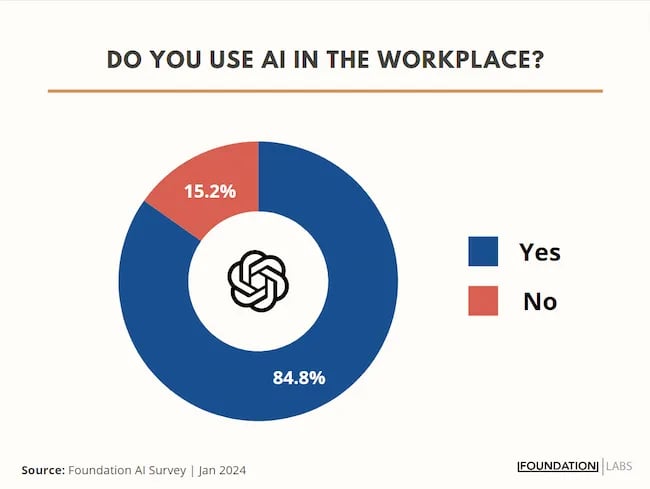
If you can overlook the fear-inducing headlines, this technology is making social media marketers more efficient and effective than ever. Translation: AI is good news for social media marketers.
In fact, I predict that the marketers not using AI in their workplace will be using it before the end of this year, and that number will move closer and closer to 100%.
Social media and AI are two of the most revolutionizing technologies of the last few decades. Social media has changed the way we live, and AI is changing the way we work.
So, I’m going to condense and share the data, research, tools, and strategies that the Foundation Marketing Team and I have been working on over the last year to help you better wield the collective power of AI and social media.
Let’s jump into it.
What’s the role of AI in social marketing strategy?
In a recent episode of my podcast, Create Like The Greats, we dove into some fascinating findings about the impact of AI on marketers and social media professionals. Take a listen here:
Let’s dive a bit deeper into the benefits of this technology:
Benefits of AI in Social Media Strategy
AI is to social media what a conductor is to an orchestra — it brings everything together with precision and purpose. The applications of AI in a social media strategy are vast, but the virtuosos are few who can wield its potential to its fullest.
AI to Conduct Customer Research
Imagine you’re a modern-day Indiana Jones, not dodging boulders or battling snakes, but rather navigating the vast, wild terrain of consumer preferences, trends, and feedback.
This is where AI thrives.
Using social media data, from posts on X to comments and shares, AI can take this information and turn it into insights surrounding your business and industry. Let’s say for example you’re a business that has 2,000 customer reviews on Google, Yelp, or a software review site like Capterra.
Leveraging AI you can now have all 2,000 of these customer reviews analyzed and summarized into an insightful report in a matter of minutes. You simply need to download all of them into a doc and then upload them to your favorite Generative Pre-trained Transformer (GPT) to get the insights and data you need.
But that’s not all.
You can become a Prompt Engineer and write ChatGPT asking it to help you better understand your audience. For example, if you’re trying to come up with a persona for people who enjoy marathons but also love kombucha you could write a prompt like this to ChatGPT:

The response that ChatGPT provided back is quite good:
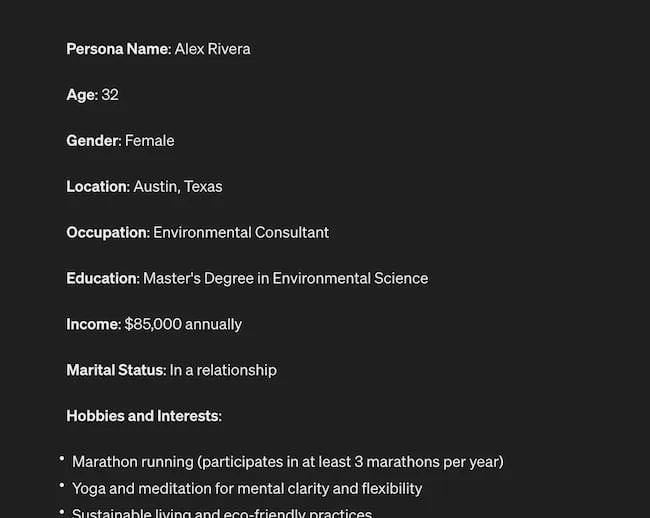
Below this it went even deeper by including a lot of valuable customer research data:
- Demographics
- Psychographics
- Consumer behaviors
- Needs and preferences
And best of all…
It also included marketing recommendations.
The power of AI is unbelievable.
Social Media Content Using AI
AI’s helping hand can be unburdening for the creative spirit.
Instead of marketers having to come up with new copy every single month for posts, AI Social Caption generators are making it easier than ever to craft catchy status updates in the matter of seconds.
Tools like HubSpot make it as easy as clicking a button and telling the AI tool what you’re looking to create a post about:
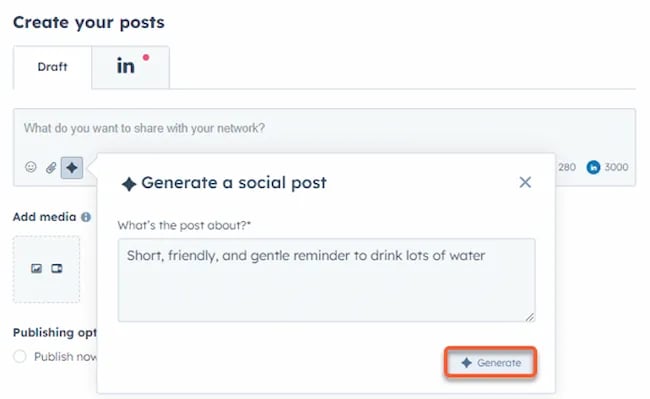
The best part of these AI tools is that they’re not limited to one channel.
Your AI social media content assistant can help you with LinkedIn content, X content, Facebook content, and even the captions that support your post on Instagram.
It can also help you navigate hashtags:
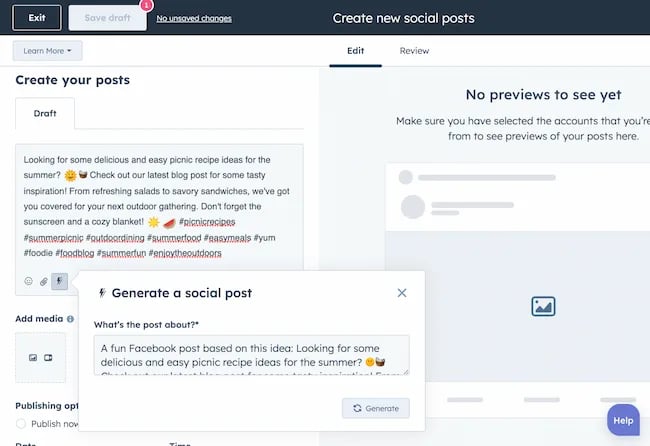
With AI social media tools that generate content ideas or even write posts, it’s not about robots replacing humans. It’s about making sure that the human creators on your team are focused on what really matters — adding that irreplaceable human touch.
Enhanced Personalization
You know that feeling when a brand gets you, like, really gets you?
AI makes that possible through targeted content that’s tailored with a level of personalization you’d think was fortune-telling if the data didn’t paint a starker, more rational picture.
What do I mean?
Brands can engage more quickly with AI than ever before. In the early 2000s, a lot of brands spent millions of dollars to create social media listening rooms where they would hire social media managers to find and engage with any conversation happening online.
Thanks to AI, brands now have the ability to do this at scale with much fewer people all while still delivering quality engagement with the recipient.
Analytics and Insights
Tapping into AI to dissect the data gives you a CSI-like precision to figure out what works, what doesn’t, and what makes your audience tick. It’s the difference between guessing and knowing.
The best part about AI is that it can give you almost any expert at your fingertips.
If you run a report surrounding the results of your social media content strategy directly from a site like LinkedIn, AI can review the top posts you’ve shared and give you clear feedback on what type of content is performing, why you should create more of it, and what days of the week your content is performing best.
This type of insight that would typically take hours to understand.
Now …
Thanks to the power of AI you can upload a spreadsheet filled with rows and columns of data just to be met with a handful of valuable insights a few minutes later.
Improved Customer Service
Want 24/7 support for your customers?
It’s now possible without human touch.
Chatbots powered by AI are taking the lead on direct messaging experiences for brands on Facebook and other Meta properties to offer round-the-clock assistance.
The fact that AI can be trained on past customer queries and data to inform future queries and problems is a powerful development for social media managers.
Advertising on Social Media with AI
The majority of ad networks have used some variation of AI to manage their bidding system for years. Now, thanks to AI and its ability to be incorporated in more tools, brands are now able to use AI to create better and more interesting ad campaigns than ever before.
Brands can use AI to create images using tools like Midjourney and DALL-E in seconds.
Brands can use AI to create better copy for their social media ads.
Brands can use AI tools to support their bidding strategies.
The power of AI and social media is continuing to evolve daily and it’s not exclusively found in the organic side of the coin. Paid media on social media is being shaken up due to AI just the same.
How to Implement AI into Your Social Media Strategy
Ready to hit “Go” on your AI-powered social media revolution?
Don’t just start the engine and hope for the best. Remember the importance of building a strategy first. In this video, you can learn some of the most important factors ranging from (but not limited to) SMART goals and leveraging influencers in your day-to-day work:
The following seven steps are crucial to building a social media strategy:
- Identify Your AI and Social Media Goals
- Validate Your AI-Related Assumptions
- Conduct Persona and Audience Research
- Select the Right Social Channels
- Identify Key Metrics and KPIs
- Choose the Right AI Tools
- Evaluate and Refine Your Social Media and AI Strategy
Keep reading, roll up your sleeves, and follow this roadmap:
1. Identify Your AI and Social Media Goals
If you’re just dipping your toes into the AI sea, start by defining clear objectives.
Is it to boost engagement? Streamline your content creation? Or simply understand your audience better? It’s important that you spend time understanding what you want to achieve.
For example, say you’re a content marketing agency like Foundation and you’re trying to increase your presence on LinkedIn. The specificity of this goal will help you understand the initiatives you want to achieve and determine which AI tools could help you make that happen.
Are there AI tools that will help you create content more efficiently? Are there AI tools that will help you optimize LinkedIn Ads? Are there AI tools that can help with content repurposing? All of these things are possible and having a goal clearly identified will help maximize the impact. Learn more in this Foundation Marketing piece on incorporating AI into your content workflow.
Once you have identified your goals, it’s time to get your team on board and assess what tools are available in the market.
Recommended Resources:
2. Validate Your AI-Related Assumptions
Assumptions are dangerous — especially when it comes to implementing new tech.
Don’t assume AI is going to fix all your problems.
Instead, start with small experiments and track their progress carefully.
3. Conduct Persona and Audience Research
Social media isn’t something that you can just jump into.
You need to understand your audience and ideal customers. AI can help with this, but you’ll need to be familiar with best practices. If you need a primer, this will help:
Once you understand the basics, consider ways in which AI can augment your approach.
4. Select the Right Social Channels
Not every social media channel is the same.
It’s important that you understand what channel is right for you and embrace it.
The way you use AI for X is going to be different from the way you use AI for LinkedIn. On X, you might use AI to help you develop a long-form thread that is filled with facts and figures. On LinkedIn however, you might use AI to repurpose a blog post and turn it into a carousel PDF. The content that works on X and that AI can facilitate creating is different from the content that you can create and use on LinkedIn.
The audiences are different.
The content formats are different.
So operate and create a plan accordingly.
Recommended Tools and Resources:
5. Identify Key Metrics and KPIs
What metrics are you trying to influence the most?
Spend time understanding the social media metrics that matter to your business and make sure that they’re prioritized as you think about the ways in which you use AI.
These are a few that matter most:
- Reach: Post reach signifies the count of unique users who viewed your post. How much of your content truly makes its way to users’ feeds?
- Clicks: This refers to the number of clicks on your content or account. Monitoring clicks per campaign is crucial for grasping what sparks curiosity or motivates people to make a purchase.
- Engagement: The total social interactions divided by the number of impressions. This metric reveals how effectively your audience perceives you and their readiness to engage.
Of course, it’s going to depend greatly on your business.
But with this information, you can ensure that your AI social media strategy is rooted in goals.
6. Choose the Right AI Tools
The AI landscape is filled with trash and treasure.
Pick AI tools that are most likely to align with your needs and your level of tech-savviness.
For example, if you’re a blogger creating content about pizza recipes, you can use HubSpot’s AI social caption generator to write the message on your behalf:
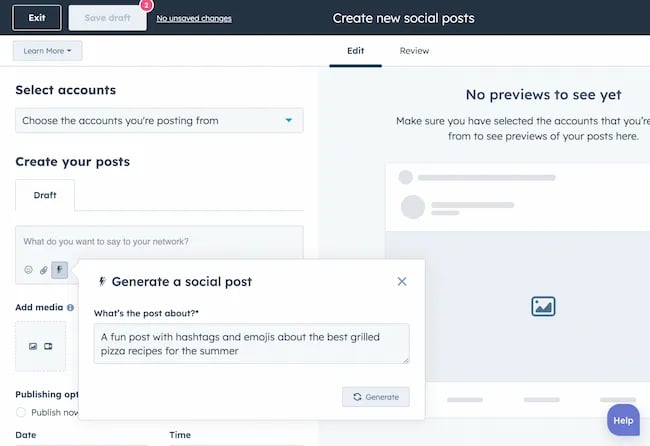
The benefit of an AI tool like HubSpot and the caption generator is that what at one point took 30-40 minutes to come up with — you can now have it at your fingertips in seconds. The HubSpot AI caption generator is trained on tons of data around social media content and makes it easy for you to get inspiration or final drafts on what can be used to create great content.
Consider your budget, the learning curve, and what kind of support the tool offers.
7. Evaluate and Refine Your Social Media and AI Strategy
AI isn’t a magic wand; it’s a set of complex tools and technology.
You need to be willing to pivot as things come to fruition.
If you notice that a certain activity is falling flat, consider how AI can support that process.
Did you notice that your engagement isn’t where you want it to be? Consider using an AI tool to assist with crafting more engaging social media posts.
Make AI Work for You — Now and in the Future
AI has the power to revolutionize your social media strategy in ways you may have never thought possible. With its ability to conduct customer research, create personalized content, and so much more, thinking about the future of social media is fascinating.
We’re going through one of the most interesting times in history.
Stay equipped to ride the way of AI and ensure that you’re embracing the best practices outlined in this piece to get the most out of the technology.
MARKETING
Advertising in local markets: A playbook for success

Many brands, such as those in the home services industry or a local grocery chain, market to specific locations, cities or regions. There are also national brands that want to expand in specific local markets.
Regardless of the company or purpose, advertising on a local scale has different tactics than on a national scale. Brands need to connect their messaging directly with the specific communities they serve and media to their target demo. Here’s a playbook to help your company succeed when marketing on a local scale.
1. Understand local vs. national campaigns
Local advertising differs from national campaigns in several ways:
- Audience specificity: By zooming in on precise geographic areas, brands can tailor messaging to align with local communities’ customs, preferences and nuances. This precision targeting ensures that your message resonates with the right target audience.
- Budget friendliness: Local advertising is often more accessible for small businesses. Local campaign costs are lower, enabling brands to invest strategically within targeted locales. This budget-friendly nature does not diminish the need for strategic planning; instead, it emphasizes allocating resources wisely to maximize returns. As a result, testing budgets can be allocated across multiple markets to maximize learnings for further market expansion.
- Channel selection: Selecting the correct channels is vital for effective local advertising. Local newspapers, radio stations, digital platforms and community events each offer advantages. The key lies in understanding where your target audience spends time and focusing efforts to ensure optimal engagement.
- Flexibility and agility: Local campaigns can be adjusted more swiftly in response to market feedback or changes, allowing brands to stay relevant and responsive.
Maintaining brand consistency across local touchpoints reinforces brand identity and builds a strong, recognizable brand across markets.
2. Leverage customized audience segmentation
Customized audience segmentation is the process of dividing a market into distinct groups based on specific demographic criteria. This marketing segmentation supports the development of targeted messaging and media plans for local markets.
For example, a coffee chain might cater to two distinct segments: young professionals and retirees. After identifying these segments, the chain can craft messages, offers and media strategies relating to each group’s preferences and lifestyle.
To reach young professionals in downtown areas, the chain might focus on convenience, quality coffee and a vibrant atmosphere that is conducive to work and socializing. Targeted advertising on Facebook, Instagram or Connected TV, along with digital signage near office complexes, could capture the attention of this demographic, emphasizing quick service and premium blends.
Conversely, for retirees in residential areas, the chain could highlight a cozy ambiance, friendly service and promotions such as senior discounts. Advertisements in local print publications, community newsletters, radio stations and events like senior coffee mornings would foster a sense of community and belonging.
Dig deeper: Niche advertising: 7 actionable tactics for targeted marketing
3. Adapt to local market dynamics
Various factors influence local market dynamics. Brands that navigate changes effectively maintain a strong audience connection and stay ahead in the market. Here’s how consumer sentiment and behavior may evolve within a local market and the corresponding adjustments brands can make.
- Cultural shifts, such as changes in demographics or societal norms, can alter consumer preferences within a local community. For example, a neighborhood experiencing gentrification may see demand rise for specific products or services.
- Respond by updating your messaging to reflect the evolving cultural landscape, ensuring it resonates with the new demographic profile.
- Economic conditions are crucial. For example, during downturns, consumers often prioritize value and practicality.
- Highlight affordable options or emphasize the practical benefits of your offerings to ensure messaging aligns with consumers’ financial priorities. The impact is unique to each market and the marketing message must also be dynamic.
- Seasonal trends impact consumer behavior.
- Align your promotions and creative content with changing seasons or local events to make your offerings timely and relevant.
- New competitors. The competitive landscape demands vigilance because new entrants or innovative competitor campaigns can shift consumer preferences.
- Differentiate by focusing on your unique selling propositions, such as quality, customer service or community involvement, to retain consumer interest and loyalty.
4. Apply data and predictive analytics
Data and predictive analytics are indispensable tools for successfully reaching local target markets. These technologies provide consumer behavior insights, enabling you to anticipate market trends and adjust strategies proactively.
- Price optimization: By analyzing consumer demand, competitor pricing and market conditions, data analytics enables you to set prices that attract customers while ensuring profitability.
- Competitor analysis: Through analysis, brands can understand their positioning within the local market landscape and identify opportunities and threats. Predictive analytics offer foresight into competitors’ potential moves, allowing you to strategize effectively to maintain a competitive edge.
- Consumer behavior: Forecasting consumer behavior allows your brand to tailor offerings and marketing messages to meet evolving consumer needs and enhance engagement.
- Marketing effectiveness: Analytics track the success of advertising campaigns, providing insights into which strategies drive conversions and sales. This feedback loop enables continuous optimization of marketing efforts for maximum impact.
- Inventory management: In supply chain management, data analytics predict demand fluctuations, ensuring inventory levels align with market needs. This efficiency prevents stockouts or excess inventory, optimizing operational costs and meeting consumer expectations.
Dig deeper: Why you should add predictive modeling to your marketing mix
5. Counter external market influences
Consider a clothing retailer preparing for a spring collection launch. By analyzing historical weather data and using predictive analytics, the brand forecasts an unseasonably cool start to spring. Anticipating this, the retailer adjusts its campaign to highlight transitional pieces suitable for cooler weather, ensuring relevance despite an unexpected chill.
Simultaneously, predictive models signal an upcoming spike in local media advertising rates due to increased market demand. Retailers respond by reallocating a portion of advertising budgets to digital channels, which offer more flexibility and lower costs than traditional media. This shift enables brands to maintain visibility and engagement without exceeding budget, mitigating the impact of external forces on advertising.
6. Build consumer confidence with messaging
Localized messaging and tailored customer service enhance consumer confidence by demonstrating your brand’s understanding of the community. For instance, a grocery store that curates cooking classes featuring local cuisine or sponsors community events shows commitment to local culture and consumer interests.
Similarly, a bookstore highlighting local authors or topics relevant to the community resonates with local customers. Additionally, providing service that addresses local needs — such as bilingual service and local event support — reinforces the brand’s values and response to the community.
Through these localized approaches, brands can build trust and loyalty, bridging the gap between corporate presence and local relevance.
7. Dominate with local advertising
To dominate local markets, brands must:
- Harness hyper-targeted segmentation and geo-targeted advertising to reach and engage precise audiences.
- Create localized content that reflects community values, engage in community events, optimize campaigns for mobile and track results.
- Fine-tune strategies, outperform competitors and foster lasting relationships with customers.
These strategies will enable your message to resonate with local consumers, differentiate you in competitive markets and ensure you become a major player in your specific area.
Dig deeper: The 5 critical elements for local marketing success
Opinions expressed in this article are those of the guest author and not necessarily MarTech. Staff authors are listed here.
-

 PPC5 days ago
19 Best SEO Tools in 2024 (For Every Use Case)
-
SEARCHENGINES7 days ago
Daily Search Forum Recap: April 17, 2024
-
 SEO7 days ago
An In-Depth Guide And Best Practices For Mobile SEO
-
SEARCHENGINES6 days ago
Daily Search Forum Recap: April 18, 2024
-
SEARCHENGINES5 days ago
Daily Search Forum Recap: April 19, 2024
-

 MARKETING6 days ago
Ecommerce evolution: Blurring the lines between B2B and B2C
-

 SEO6 days ago
2024 WordPress Vulnerability Report Shows Errors Sites Keep Making
-
 WORDPRESS5 days ago
How to Make $5000 of Passive Income Every Month in WordPress



![How to Use AI For a More Effective Social Media Strategy, According to Ross Simmonds Download Now: The 2024 State of Social Media Trends [Free Report]](https://articles.entireweb.com/wp-content/uploads/2024/04/How-to-Use-AI-For-a-More-Effective-Social-Media.png)

You must be logged in to post a comment Login