MICROSOFT
Accounting for Future Performance in Paid Media

Changing circumstances can force you to confront the future. Planning ahead is essential and can better prepare you for what comes next. While a model won’t perfectly predict what comes next, it can be vital in preparing and setting realistic expectations.
In this article, we’ll cover a few approaches that you can explore and build on. It’s worth noting that while there is no out-of-the-box solution, the process and business knowledge you can apply are what make these tools valuable.
Simple Math
With a few formulas, you can quickly pace account metrics, understand the direction of your account, and plan for the rest of the month. Sometimes the simple method is all you need.
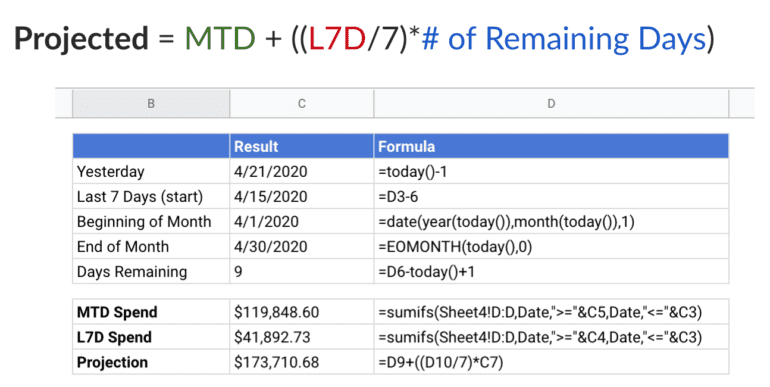
One common method involves taking the current total, taking the average of the last seven days, and multiplying it by the remaining days in the period.
For a month this looks something like a month to date spend + last seven day spend/7 * days remaining in the month.

Simple forecast example in Google Sheets
The simplicity of this method makes it intuitive and easy to adjust for. Seven days is a great starter as most accounts follows a typical cycle as activity rises and falls through a weekly period. You can adjust it for stability by increasing the seven days to 14 or 21. The beauty is that the formula starts so simply that it’s not a big investment to make changes.
If you need to add more nuance you can apply this same method to account segments to account for differences in brand investment, non-brand, shopping, or the product line level. You can also add further modifiers to weight the remaining days differently. The best part of this method is that it can be easily modified, is intuitive, and produces reasonable results with little effort.
You can see more advanced implementations in this post, How to Forecast Spend Potential in Paid Social Campaigns
Data Tables in Excel
Data tables are a great method to estimate the account level effects of changing metrics. You can take an efficiently metric such as ROAS or CPA and create a table with new CPAs/ROAS by different cost per clicks and click through rates. This helps you forecast the impact of performance changes in your account.

Excel Data Table Example
Unlike the previous example, it does not account for time. Instead, it provides useful benchmarks for upper and lower limits in performance. It clarifies possibilities and outlines the bounds of performance. You can use it these as a best-case and a worst-case scenario or see how far metrics would have to change to hit a goal target.
You can find further details in this post,
How to Utilize Excel Data Tables for Better Projections
and this webinar,
Discover More Accurate Projections with Excel Data Tables
Going Further with Your Models
Or course models can go much further. You can explore time series with Holt-Winters, ARIMA, and more. While these are not always directly applicable to daily work and optimizations they can be useful when longer terms forecasts are needed. The main benefit is that they are built to account for trends and seasonality. Something our naïve models don’t account for.

Holt-Winters Output for Web Traffic
The downside here is that these models often require more knowledge on the topic or a tool to pull them off. Notably programming skills and packages like tidymodels in R or statsmodels in Python. If you need further motivation, check out the other benefits of learning Python – How Learning Python can Improve your PPC Campaigns.
Holt-Winters can be quickly applied in Excel though. Here is a fun blog article that walks through a hypothetical example. It’s not directly PPC related but the method is easily adaptable. This method will account for multiple factors such as seasonality and overall trends in predicting future performance. It’s a great tool for spotting anomalies or adding to a quarterly review.
Analytics Made Skeezy – Forecasting Made Skeezy
Wrapping Up
We covered a few approaches in this article. Each one requires a bit of nuance and modification to be directly useful. They are not exclusive though. I encourage you to try multiple methods and models to dive deeper into account performance. Once you get started you might find it to be one of your favorite tasks!


