MARKETING
Are Seasonality & the Economy Impacting Marketers in Q4? [Traffic & Conversion Data from 150K+ Companies]
![Are Seasonality & the Economy Impacting Marketers in Q4? [Traffic & Conversion Data from 150K+ Companies] Are Seasonality & the Economy Impacting Marketers in Q4? [Traffic & Conversion Data from 150K+ Companies]](https://articles.entireweb.com/wp-content/uploads/2022/11/Are-Seasonality-the-Economy-Impacting-Marketers-in-Q4-Traffic.jpgkeepProtocol.jpeg)
This time each year, nature – as well as marketing – slows down as we head into colder seasons.
As we enter Q4, marketing departments are preparing for a slowdown in business that comes as people tune out towards the end of the year.
But, while seasonal change is expected and inevitable, this year’s economic shifts might cause some marketers to worry that this year could bring a flurry of poor numbers.
As you see dips or bumps in early Q4, you might wonder, “Is my marketing department experiencing seasonality or an impact of outside events, or are our numbers solely based on the work we’ve been doing?”
To help you gather evidence that proves or disproves the possibility of outside impacts in Q4, here’s a look at how businesses across industries entered the first month of it in October.
About this Data: These insights are based on data aggregated from 158,000+ HubSpot customers globally between July 2021 and October 2022. Because the data is aggregated from HubSpot customers’ businesses, please keep in mind that the performance of individual businesses, including HubSpot’s, might differ based on their markets, customer base, industry, geography, stage, and/or other factors.
How Marketing Metrics Are Shifting (or Staying the Same) in Early Q4
To learn how metrics were shifting, we looked at data from sample sizes of 120,000+ businesses.
Overall, we’re seeing that most inbound marketing metrics are down year-over-year. Luckily, the good news is that one major, hard-to-win metric, website conversion rate, is trending upward.
When looking month-over-month, numbers seem to be flatter with a mixed bag of small increases and decreases, which could hint that we’re heading into a seasonal time of slow growth, or starting to see some sluggishness due to the economic climate.
Below, I’ll break down each key marketing metric and walk through what we’ve seen across industries in Q4 so far.
Q4 Web Traffic So Far
Month-over-month, we see that fall and winter seasonality hasn’t harmed websites quite yet with most industries seeing flat, low-change in traffic. Only Technology, Information and Media (up 2% MoM) as well as Trade, Transportation and Utilities (up nearly 3%) saw any real change.
While seasonality might not be impacting the industries below, year-over-year data shows significant dips in traffic across industries (a theme we’ve seen throughout the last few months). Professional and Business Services (down 10%) saw the most significant annual loss, while Leisure and Hospitality saw the reverse with a nearly 7% YoY increase.
|
Industry |
MoM |
YoY |
Sample size |
|
All |
1.30% |
-10.80% |
145,150 |
|
Construction |
-1.21% |
-5.39% |
1,405 |
|
Education and Health Services |
-0.42% |
-3.74% |
3,659 |
|
Financial Activities |
1.32% |
-11.12% |
4,084 |
|
Leisure and Hospitality |
-1.31% |
6.99% |
1,114 |
|
Manufacturing |
-0.19% |
-6.43% |
4,463 |
|
Professional and Business Services |
-0.55% |
-9.65% |
12,999 |
|
Technology, Information and Media |
2.32% |
-4.62% |
14,934 |
|
Trade, Transportation and Utilities |
2.92% |
-5.58% |
3,480 |
Why is this happening? Are we continuing to see solid annual traffic drops? We can’t be certain, but a few things that could be causing impacts are:
- More and more, audiences spend time discovering and even shopping for products on social media directly – no longer relying on standalone company sites.
- In 2021, many regions were still at least partially quarantined due to COVID-19. While the pandemic continues, most of the world’s lightened precautions, enabling economies to re-open and allowing more people to go out and spend less time surfing the web.
- Search engines get more and more competitive daily as hundreds of sites aim to rank for the same keywords as their competitors. More competition directly impacts search traffic and, today, search result pages are more saturated than ever..
Website Conversions Grow Despite Traffic Dips
While traffic seems to be a tad sluggish in October, we’re seeing significant YoY gains (+10.95%) overall with Technology, Information and Media leading the pack (+22.1%) and only Trade, Transportation and Utilities, and Construction seeing decreases.
Across the board, we’re seeing a very slight MoM decrease overall, except for Technology, Information and Media which saw a large increase and Trade which saw the greatest decrease (aligning with slow tech business growth reports we’ve seen all over the news.)
|
Industry |
MoM |
YoY |
Sample size |
|
All |
-1.76% |
10.95% |
124,836 |
|
Construction |
-5.36% |
-5.36% |
1,166 |
|
Education and Health Services |
2.26% |
19.35% |
3,316 |
|
Financial Activities |
-4.59% |
7.47% |
3,542 |
|
Leisure and Hospitality |
5.00% |
9.70% |
939 |
|
Manufacturing |
-6.27% |
12.95% |
3,905 |
|
Professional and Business Services |
0.31% |
15.41% |
11,451 |
|
Technology, Information and Media |
17.27% |
22.10% |
13,504 |
|
Trade, Transportation and Utilities |
-8.41% |
-4.39% |
2,984 |
Inbound Leads Stay Fairly Flat… Except in a Few Key Industries
In October, Inbound Leads were a mixed bag. However, the evidence of both positive and negative seasonality patterns become more obvious when looking at this metric.
Month-over-month, inbound leads remained flat with an overall 0.65% decrease. Manufacturing (-6.48%), as well as Transportation and Utilities (-5.6%), saw the biggest dips. Meanwhile, Construction (-8.75%) and Trade, Transportation and Utilities (9.82%) saw significant YoY losses.
Where did inbound leads grow? Technology, Information and Media saw a sizable MoM and YoY increase of 5.22% each. Additionally, inbound leads overall saw a small annual increase with Education and Health Services (16.76%) and Leisure and Hospitality (17.15%) seeing the greatest gains. These boosts contributed to year-over-year growth of 1.63% for overall industries.
|
Industry |
MoM |
YoY |
Sample size |
|
All |
-0.65% |
1.63% |
132,820 |
|
Construction |
-4.48% |
-8.75% |
1,345 |
|
Education and Health Services |
1.70% |
16.76% |
3,636 |
|
Financial Activities |
-2.80% |
-1.97% |
3,876 |
|
Leisure and Hospitality |
2.74% |
17.15% |
1,031 |
|
Manufacturing |
-6.48% |
4.31% |
4,287 |
|
Professional and Business Services |
0.15% |
8.02% |
12,648 |
|
Technology, Information and Media |
5.22% |
5.22% |
14,592 |
|
Trade, Transportation and Utilities |
-5.61% |
-9.82% |
3,251 |
What can we make of this data?
While we can expect year-over-year conversion rate growth with web traffic going down annually, some of the substantial losses and gains are due to more than just web traffic. A few potential impacts could be:
- Products or services sold within manufacturing, trade, transportation, and utilities can be quite expensive or impacted by inflation. As people tighten their budgets with conflicting economic news, high-priced industries could be seeing some sluggish lead generation as people might only be focusing on just the products or services they need.
- Seasonality is likely beginning to take effect as people begin to focus more on experiences driven by education, media, and holiday travel, while putting other industries on the back burner.
- As we keep seeing news of career changes, recession-based company shifts, and the continuing pandemic, people might be more fixated on Education and Health Services industries than in previous quarters, leading to nearly-17% annual lead growth.
Are Marketing Emails Struggling to Be Seen?
In our previous reports, we noted that while marketers have been sending fewer emails – likely to meet the needs of today’s subscribers with heavily cluttered inboxes – they’re still seeing opens and open rates dip.
It’s tricky to guess what the problem could be, but as the HubSpot Blog’s former email manager, one suspicion I have is that email inboxes are far too saturated and competitive these days.
|
Metric |
MoM |
YoY |
Sample size |
|
Email sends |
1.42% |
-1.97% |
141,791 |
|
Email opens |
-1.14% |
-15.85% |
141,791 |
|
Email open rate |
-2.19% |
-13.71% |
141,769 |
Ultimately, if your email isn’t seen in an inbox no one will open it. And, if you’re sending emails with great content, but non-competitive, non-eye-catching subject lines, your readers might not click into them.
Odds are, your subscriber subscribes to many other emails related to your industry. And, because of this, they compare you to competitors sending similar content with similar goals each day. This is why it’s so important for your brand’s emails to seem as interesting, unique, and eye-catching as possible – without looking too desperate.
To learn more about how to boost your open rate and opens, check out this helpful post.
Further Reading
When it comes to key marketing metrics, keeping a pulse on how the business world and your industry are doing can help you determine when and how to get ahead of competition.
For even more helpful data, check out our previous reports, plus a few additional research studies, as you plan your strategies for Q4 and beyond.
Lastly, be sure to check out our free, downloadable 2022 State of Marketing Report below – with data and tips from experts across the global marketing industry.
MARKETING
Ecommerce evolution: Blurring the lines between B2B and B2C
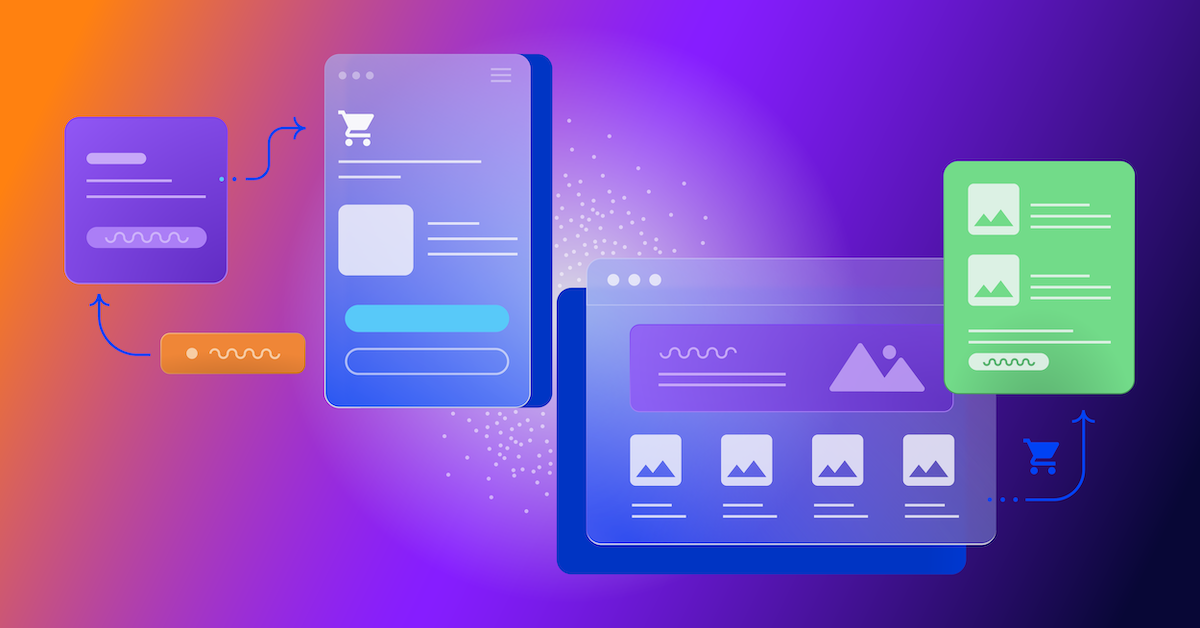
Understanding convergence
B2B and B2C ecommerce are two distinct models of online selling. B2B ecommerce is between businesses, such as wholesalers, distributors, and manufacturers. B2C ecommerce refers to transactions between businesses like retailers and consumer brands, directly to individual shoppers.
However, in recent years, the boundaries between these two models have started to fade. This is known as the convergence between B2B and B2C ecommerce and how they are becoming more similar and integrated.
Source: White Paper: The evolution of the B2B Consumer Buyer (ClientPoint, Jan 2024)
What’s driving this change?
Ever increasing customer expectations
Customers today expect the same level of convenience, speed, and personalization in their B2B transactions as they do in their B2C interactions. B2B buyers are increasingly influenced by their B2C experiences. They want research, compare, and purchase products online, seamlessly transitioning between devices and channels. They also prefer to research and purchase online, using multiple devices and channels.
Forrester, 68% of buyers prefer to research on their own, online . Customers today expect the same level of convenience, speed, and personalization in their B2B transactions as they do in their B2C interactions. B2B buyers are increasingly influenced by their B2C experiences. They want research, compare, and purchase products online, seamlessly transitioning between devices and channels. They also prefer to research and purchase online, using multiple devices and channels
Technology and omnichannel strategies
Technology enables B2B and B2C ecommerce platforms to offer more features and functionalities, such as mobile optimization, chatbots, AI, and augmented reality. Omnichannel strategies allow B2B and B2C ecommerce businesses to provide a seamless and consistent customer experience across different touchpoints, such as websites, social media, email, and physical stores.
However, with every great leap forward comes its own set of challenges. The convergence of B2B and B2C markets means increased competition. Businesses now not only have to compete with their traditional rivals, but also with new entrants and disruptors from different sectors. For example, Amazon Business, a B2B ecommerce platform, has become a major threat to many B2B ecommerce businesses, as it offers a wide range of products, low prices, and fast delivery
“Amazon Business has proven that B2B ecommerce can leverage popular B2C-like functionality” argues Joe Albrecht, CEO / Managing Partner, Xngage. . With features like Subscribe-and-Save (auto-replenishment), one-click buying, and curated assortments by job role or work location, they make it easy for B2B buyers to go to their website and never leave. Plus, with exceptional customer service and promotional incentives like Amazon Business Prime Days, they have created a reinforcing loyalty loop.
And yet, according to Barron’s, Amazon Business is only expected to capture 1.5% of the $5.7 Trillion addressable business market by 2025. If other B2B companies can truly become digital-first organizations, they can compete and win in this fragmented space, too.”
If other B2B companies can truly become digital-first organizations, they can also compete and win in this fragmented space
Joe AlbrechtCEO/Managing Partner, XNGAGE
Increasing complexity
Another challenge is the increased complexity and cost of managing a converging ecommerce business. Businesses have to deal with different customer segments, requirements, and expectations, which may require different strategies, processes, and systems. For instance, B2B ecommerce businesses may have to handle more complex transactions, such as bulk orders, contract negotiations, and invoicing, while B2C ecommerce businesses may have to handle more customer service, returns, and loyalty programs. Moreover, B2B and B2C ecommerce businesses must invest in technology and infrastructure to support their convergence efforts, which may increase their operational and maintenance costs.
How to win
Here are a few ways companies can get ahead of the game:
Adopt B2C-like features in B2B platforms
User-friendly design, easy navigation, product reviews, personalization, recommendations, and ratings can help B2B ecommerce businesses to attract and retain more customers, as well as to increase their conversion and retention rates.
According to McKinsey, ecommerce businesses that offer B2C-like features like personalization can increase their revenues by 15% and reduce their costs by 20%. You can do this through personalization of your website with tools like Product Recommendations that help suggest related products to increase sales.
Focus on personalization and customer experience
B2B and B2C ecommerce businesses need to understand their customers’ needs, preferences, and behaviors, and tailor their offerings and interactions accordingly. Personalization and customer experience can help B2B and B2C ecommerce businesses to increase customer satisfaction, loyalty, and advocacy, as well as to improve their brand reputation and competitive advantage. According to a Salesforce report, 88% of customers say that the experience a company provides is as important as its products or services.
Market based on customer insights
Data and analytics can help B2B and B2C ecommerce businesses to gain insights into their customers, markets, competitors, and performance, and to optimize their strategies and operations accordingly. Data and analytics can also help B2B and B2C ecommerce businesses to identify new opportunities, trends, and innovations, and to anticipate and respond to customer needs and expectations. According to McKinsey, data-driven organizations are 23 times more likely to acquire customers, six times more likely to retain customers, and 19 times more likely to be profitable.
What’s next?
The convergence of B2B and B2C ecommerce is not a temporary phenomenon, but a long-term trend that will continue to shape the future of ecommerce. According to Statista, the global B2B ecommerce market is expected to reach $20.9 trillion by 2027, surpassing the B2C ecommerce market, which is expected to reach $10.5 trillion by 2027. Moreover, the report predicts that the convergence of B2B and B2C ecommerce will create new business models, such as B2B2C, B2A (business to anyone), and C2B (consumer to business).
Therefore, B2B and B2C ecommerce businesses need to prepare for the converging ecommerce landscape and take advantage of the opportunities and challenges it presents. Here are some recommendations for B2B and B2C ecommerce businesses to navigate the converging landscape:
- Conduct a thorough analysis of your customers, competitors, and market, and identify the gaps and opportunities for convergence.
- Develop a clear vision and strategy for convergence, and align your goals, objectives, and metrics with it.
- Invest in technology and infrastructure that can support your convergence efforts, such as cloud, mobile, AI, and omnichannel platforms.
- Implement B2C-like features in your B2B platforms, and vice versa, to enhance your customer experience and satisfaction.
- Personalize your offerings and interactions with your customers, and provide them with relevant and valuable content and solutions.
- Leverage data and analytics to optimize your performance and decision making, and to innovate and differentiate your business.
- Collaborate and partner with other B2B and B2C ecommerce businesses, as well as with other stakeholders, such as suppliers, distributors, and customers, to create value and synergy.
- Monitor and evaluate your convergence efforts, and adapt and improve them as needed.
By following these recommendations, B2B and B2C ecommerce businesses can bridge the gap between their models and create a more integrated and seamless ecommerce experience for their customers and themselves.
MARKETING
Streamlining Processes for Increased Efficiency and Results

How can businesses succeed nowadays when technology rules? With competition getting tougher and customers changing their preferences often, it’s a challenge. But using marketing automation can help make things easier and get better results. And in the future, it’s going to be even more important for all kinds of businesses.
So, let’s discuss how businesses can leverage marketing automation to stay ahead and thrive.
Benefits of automation marketing automation to boost your efforts
First, let’s explore the benefits of marketing automation to supercharge your efforts:
Marketing automation simplifies repetitive tasks, saving time and effort.
With automated workflows, processes become more efficient, leading to better productivity. For instance, automation not only streamlines tasks like email campaigns but also optimizes website speed, ensuring a seamless user experience. A faster website not only enhances customer satisfaction but also positively impacts search engine rankings, driving more organic traffic and ultimately boosting conversions.
Automation allows for precise targeting, reaching the right audience with personalized messages.
With automated workflows, processes become more efficient, leading to better productivity. A great example of automated workflow is Pipedrive & WhatsApp Integration in which an automated welcome message pops up on their WhatsApp
within seconds once a potential customer expresses interest in your business.
Increases ROI
By optimizing campaigns and reducing manual labor, automation can significantly improve return on investment.
Leveraging automation enables businesses to scale their marketing efforts effectively, driving growth and success. Additionally, incorporating lead scoring into automated marketing processes can streamline the identification of high-potential prospects, further optimizing resource allocation and maximizing conversion rates.
Harnessing the power of marketing automation can revolutionize your marketing strategy, leading to increased efficiency, higher returns, and sustainable growth in today’s competitive market. So, why wait? Start automating your marketing efforts today and propel your business to new heights, moreover if you have just learned ways on how to create an online business
How marketing automation can simplify operations and increase efficiency
Understanding the Change
Marketing automation has evolved significantly over time, from basic email marketing campaigns to sophisticated platforms that can manage entire marketing strategies. This progress has been fueled by advances in technology, particularly artificial intelligence (AI) and machine learning, making automation smarter and more adaptable.
One of the main reasons for this shift is the vast amount of data available to marketers today. From understanding customer demographics to analyzing behavior, the sheer volume of data is staggering. Marketing automation platforms use this data to create highly personalized and targeted campaigns, allowing businesses to connect with their audience on a deeper level.
The Emergence of AI-Powered Automation
In the future, AI-powered automation will play an even bigger role in marketing strategies. AI algorithms can analyze huge amounts of data in real-time, helping marketers identify trends, predict consumer behavior, and optimize campaigns as they go. This agility and responsiveness are crucial in today’s fast-moving digital world, where opportunities come and go in the blink of an eye. For example, we’re witnessing the rise of AI-based tools from AI website builders, to AI logo generators and even more, showing that we’re competing with time and efficiency.
Combining AI-powered automation with WordPress management services streamlines marketing efforts, enabling quick adaptation to changing trends and efficient management of online presence.
Moreover, AI can take care of routine tasks like content creation, scheduling, and testing, giving marketers more time to focus on strategic activities. By automating these repetitive tasks, businesses can work more efficiently, leading to better outcomes. AI can create social media ads tailored to specific demographics and preferences, ensuring that the content resonates with the target audience. With the help of an AI ad maker tool, businesses can efficiently produce high-quality advertisements that drive engagement and conversions across various social media platforms.
Personalization on a Large Scale
Personalization has always been important in marketing, and automation is making it possible on a larger scale. By using AI and machine learning, marketers can create tailored experiences for each customer based on their preferences, behaviors, and past interactions with the brand.
This level of personalization not only boosts customer satisfaction but also increases engagement and loyalty. When consumers feel understood and valued, they are more likely to become loyal customers and brand advocates. As automation technology continues to evolve, we can expect personalization to become even more advanced, enabling businesses to forge deeper connections with their audience. As your company has tiny homes for sale California, personalized experiences will ensure each customer finds their perfect fit, fostering lasting connections.
Integration Across Channels
Another trend shaping the future of marketing automation is the integration of multiple channels into a cohesive strategy. Today’s consumers interact with brands across various touchpoints, from social media and email to websites and mobile apps. Marketing automation platforms that can seamlessly integrate these channels and deliver consistent messaging will have a competitive edge. When creating a comparison website it’s important to ensure that the platform effectively aggregates data from diverse sources and presents it in a user-friendly manner, empowering consumers to make informed decisions.
Omni-channel integration not only betters the customer experience but also provides marketers with a comprehensive view of the customer journey. By tracking interactions across channels, businesses can gain valuable insights into how consumers engage with their brand, allowing them to refine their marketing strategies for maximum impact. Lastly, integrating SEO services into omni-channel strategies boosts visibility and helps businesses better understand and engage with their customers across different platforms.
The Human Element
While automation offers many benefits, it’s crucial not to overlook the human aspect of marketing. Despite advances in AI and machine learning, there are still elements of marketing that require human creativity, empathy, and strategic thinking.
Successful marketing automation strikes a balance between technology and human expertise. By using automation to handle routine tasks and data analysis, marketers can focus on what they do best – storytelling, building relationships, and driving innovation.
Conclusion
The future of marketing automation looks promising, offering improved efficiency and results for businesses of all sizes.
As AI continues to advance and consumer expectations change, automation will play an increasingly vital role in keeping businesses competitive.
By embracing automation technologies, marketers can simplify processes, deliver more personalized experiences, and ultimately, achieve their business goals more effectively than ever before.
MARKETING
Will Google Buy HubSpot? | Content Marketing Institute
Google + HubSpot. Is it a thing?
This week, a flurry of news came down about Google’s consideration of purchasing HubSpot.
The prospect dismayed some. It delighted others.
But is it likely? Is it even possible? What would it mean for marketers? What does the consideration even mean for marketers?
Well, we asked CMI’s chief strategy advisor, Robert Rose, for his take. Watch this video or read on:
Why Alphabet may want HubSpot
Alphabet, the parent company of Google, apparently is contemplating the acquisition of inbound marketing giant HubSpot.
The potential price could be in the range of $30 billion to $40 billion. That would make Alphabet’s largest acquisition by far. The current deal holding that title happened in 2011 when it acquired Motorola Mobility for more than $12 billion. It later sold it to Lenovo for less than $3 billion.
If the HubSpot deal happens, it would not be in character with what the classic evil villain has been doing for the past 20 years.
At first glance, you might think the deal would make no sense. Why would Google want to spend three times as much as it’s ever spent to get into the inbound marketing — the CRM and marketing automation business?
At a second glance, it makes a ton of sense.
I don’t know if you’ve noticed, but I and others at CMI spend a lot of time discussing privacy, owned media, and the deprecation of the third-party cookie. I just talked about it two weeks ago. It’s really happening.
All that oxygen being sucked out of the ad tech space presents a compelling case that Alphabet should diversify from third-party data and classic surveillance-based marketing.
Yes, this potential acquisition is about data. HubSpot would give Alphabet the keys to the kingdom of 205,000 business customers — and their customers’ data that almost certainly numbers in the tens of millions. Alphabet would also gain access to the content, marketing, and sales information those customers consumed.
Conversely, the deal would provide an immediate tip of the spear for HubSpot clients to create more targeted programs in the Alphabet ecosystem and upload their data to drive even more personalized experiences on their own properties and connect them to the Google Workspace infrastructure.
When you add in the idea of Gemini, you can start to see how Google might monetize its generative AI tool beyond figuring out how to use it on ads on search results pages.
What acquisition could mean for HubSpot customers
I may be stretching here but imagine this world. As a Hubspoogle customer, you can access an interface that prioritizes your owned media data (e.g., your website, your e-commerce catalog, blog) when Google’s Gemini answers a question).
Recent reports also say Google may put up a paywall around the new premium features of its artificial intelligence-powered Search Generative Experience. Imagine this as the new gating for marketing. In other words, users can subscribe to Google’s AI for free, but Hubspoogle customers can access that data and use it to create targeted offers.
The acquisition of HubSpot would immediately make Google Workspace a more robust competitor to Microsoft 365 Office for small- and medium-sized businesses as they would receive the ADDED capability of inbound marketing.
But in the world of rented land where Google is the landlord, the government will take notice of the acquisition. But — and it’s a big but, I cannot lie (yes, I just did that). The big but is whether this acquisition dance can happen without going afoul of regulatory issues.
Some analysts say it should be no problem. Others say, “Yeah, it wouldn’t go.” Either way, would anybody touch it in an election year? That’s a whole other story.
What marketers should realize
So, what’s my takeaway?
It’s a remote chance that Google will jump on this hard, but stranger things have happened. It would be an exciting disruption in the market.
The sure bet is this. The acquisition conversation — as if you needed more data points — says getting good at owned media to attract and build audiences and using that first-party data to provide better communication and collaboration with your customers are a must.
It’s just a matter of time until Google makes a move. They might just be testing the waters now, but they will move here. But no matter what they do, if you have your customer data house in order, you’ll be primed for success.
HANDPICKED RELATED CONTENT:
Cover image by Joseph Kalinowski/Content Marketing Institute
-

 MARKETING7 days ago
Roundel Media Studio: What to Expect From Target’s New Self-Service Platform
-

 SEO6 days ago
Google Limits News Links In California Over Proposed ‘Link Tax’ Law
-
SEARCHENGINES6 days ago
Daily Search Forum Recap: April 12, 2024
-

 SEARCHENGINES5 days ago
Google Core Update Volatility, Helpful Content Update Gone, Dangerous Google Search Results & Google Ads Confusion
-

 SEO5 days ago
10 Paid Search & PPC Planning Best Practices
-

 SEO7 days ago
Google Unplugs “Notes on Search” Experiment
-

 MARKETING6 days ago
2 Ways to Take Back the Power in Your Business: Part 2
-
 MARKETING4 days ago
5 Psychological Tactics to Write Better Emails

![Are Seasonality & the Economy Impacting Marketers in Q4? [Traffic & Conversion Data from 150K+ Companies] Download Now: Free State of Marketing Report [Updated for 2022]](https://articles.entireweb.com/wp-content/uploads/2022/07/The-Top-Channels-Consumers-Use-to-Learn-About-Products-New.png)
![Are Seasonality & the Economy Impacting Marketers in Q4? [Traffic & Conversion Data from 150K+ Companies] New Call-to-action](https://articles.entireweb.com/wp-content/uploads/2022/07/1657545233_159_The-Ultimate-List-of-Email-Marketing-Stats-for-2022.png)







You must be logged in to post a comment Login