MARKETING
Content Marketing Measurement Guide: 23 Definitions To Know
Every time I use the words “analytics,” “metrics,” or “KPIs” in a discussion about the impact of content, a little voice goes off in my head. It’s the voice of Inigo Montoya from the movie, The Princess Bride: “You keep using that word. I don’t think it means what you think it means.”
While content marketers may recognize these terms relate to content measurement, it’s easy to confuse their distinctions. Read on for explanations of 23 common measurement terms and how they fit into your content’s performance strategy.
Content measurement definitions
Analytics
Marketo defines analytics as the practice of managing and studying metrics data to determine the ROI of marketing efforts like calls to action, blog posts, channel performance, and thought leadership pieces, and to identify opportunities for improvement.
Bounce rate
According to Google Analytics, a bounce rate is a single-page session divided by all sessions on your site. A bounce is a session that triggers a single request to the analytics server, such as when a user visits a page on your site and exits without taking further action. While a site exit doesn’t tell you much about your content (everyone leaves your site at some point), a page with both high exit and bounce rates may need changes to the content.
The bounce rate is a single-page session divided by all sessions on your site, says @joderama via @CMIContent @Acrolinx. Click To Tweet
Click-through rate (CTR)
A click-through rate is the percent of total viewers or recipients who clicked a link in a content asset (clicks divided by total recipients). It’s commonly used to gauge success for email campaigns, newsletter-driven website visits, and content promotions (e.g., display ads, native advertising), where the total number of recipients can be quantified (rather than estimated).
Conversion/conversion rate
A conversion happens when a consumer takes an action after engaging with your content. The action is what your organization designates as meaningful – purchasing a product, registering for an event or a gated asset, subscribing to a blog or newsletter, or joining a social media community. Calculate the conversion rate by dividing the number of visitors to the content who converted by the total interactions with that piece of content.
Customer acquisition cost
A customer acquisition cost is how much the company spent to obtain that customer. Take all the expenses – product research, development, manufacturing, marketing, advertising, etc. Divide that total by the number of customers within a designated time frame.
Calculate the customer acquisition cost by adding up all expenses and divide by number of customers in the time frame, says @joderama via @CMIContent @Acrolinx. Click To Tweet
Downloads
The download metric is commonly used to gauge performance for lead-magnet content assets like white papers, e-books, and infographics. It indicates a deeper level of engagement and interest than a view or visit because the user found the content valuable enough to save a copy to explore in more detail or share with others in their networks.
Engagement
Engagement is considered both a fundamental content metric and a content marketing goal. As a metric, it’s broadly defined as an act of content consumption –opening an email newsletter, reading a blog article, clicking on an ad or an interactive asset, or liking/commenting on a social media post. While engagement indicates at least a passing interest in your content, it’s not a particularly informative indicator of why the content captured audience interest. It’s often best used to contextualize other metrics rather than as a definitive decision-making tool.
ADVERTISEMENT
The Definitive Guide to Content Analytics: Understanding the Data That Matters Most for Successful Marketing
Want to optimize your content? Start with the right metrics and measure how your content is engaging with your audience. Get the guide to learn more!
Entrances/exits
Entrances are the number of times visitors enter your site through a specific page or set of pages. Likewise, exits indicate how often visitors end their site visit on that page. A page with a high entrance rate could indicate it’s well-optimized for search. However, neither entrance nor exit rates are clear indicators of content success (or failure) on their own. It’s a good idea to correlate this data with other insights – bounce rates, time on site, user flow, and referral traffic sources – to get a clearer picture of what it indicates about your content performance.
Goals
Goals are the desired business outcomes to be achieved through your content marketing strategy. While the stated goal of content marketing is to drive a profitable action, your goals should be more specific and quantifiable, such as increasing sales conversions, saving the company money, building (or growing) a subscribed audience, or driving greater customer loyalty and brand satisfaction.
#ContentMarketing goals should be specific and quantifiable, says @joderama via @CMIContent @Acrolinx. Click To Tweet
KPI
KPI stands for key performance indicators. They are standard, agreed-on measurements for assessing progress against your content marketing goals. Potential KPIs might be average conversion rates, number of leads, quality of leads, or revenue per new customer.
Marketing-qualified lead (MQL)
MQLs are leads generated by the marketing team that satisfy the criteria to pass along to the sales team for further outreach.
Metrics
In contrast to KPIs, metrics are the business-as-usual measurements for things that add value to your organization but aren’t focused on the most critical goals. They might include website page views or likes on social media posts. Think of these as the “what-needs-to-be-true” numbers that can help you achieve or optimize your KPIs.
Objectives and key results (OKR)
OKR is a method to determine which metrics best gauge performance against your goals. It starts with designing a measurement pyramid that includes goals, key performance indicators, and metrics. CMI’s chief strategy advisor Robert Rose details the OKR process here. The end result should be your business mission segmented into strategic objectives. Each segment should connect to the OKR pyramid and be a source tool for each metric that goes into it.

An example of OKR architecture results, mapped out.
Open rate
An open rate is a metric related to content delivered via email. It measures the percentage of subscribers who opened the email regardless if they clicked on any of the links in that content. Already limited in value due to its narrow focus, its reliability has come into question even further with the advent of Apple’s iOS email tracking changes.
Page views vs. unique page views
Commonly used to gauge website traffic, page views are the total number of times a site page is loaded by all visitors over a set time called a session, usually lasting 30 minutes. If a visitor views the same page three times during a session, total page views increase by three.
In contrast, a unique page view tracks views based on the visitor’s unique IP address, device, and browser. In the example above, the visitor who viewed the same page three times in a session would count as one unique page view. However, let’s say the visitor viewed the page two times in a Google Chrome browser and one time in a Microsoft Edge browser from the same URL. That would count as two unique page views.
If your website content is configured for Google’s Universal Analytics, look for page views and unique page views for each of your site page URLs under Behavior > Site Content > All Pages. If you’re working with Google Analytics 4, you’ll find the pages report under Engagement > Pages and screens, but will need to do some additional configuration to view data by page URL instead of the page title.
Referral traffic/rates
When a visitor reaches your domain through a third-party link (other than a search engine), it’s tracked by Google as referral traffic. In Universal Analytics, you can find referral data under Attribution > All Traffic > Referrals. For GA4, click on the Reports link in the left-side menu, navigate to Acquisition > Traffic acquisition, then type “referral” in the search box and hit enter.
You can see the sources that led visitors to your site, how many visits were referred from each source, and additional data on their behaviors after arriving on your site. As a metric, it’s a useful indicator of brand awareness and thought leadership. The more sources that send traffic your way, the more highly regarded your domain likely is – an outcome that leads to better domain authority and better rankings of your content on search.
The more sources that send traffic your way, the better domain authority and ranking of your #content on search, says @joderama via @CMIContent @Acrolinx. Click To Tweet
Registrations/subscription numbers
While gaining subscribers is among the top goals for content marketing (particularly for content brands and entrepreneurs), it’s also a metric tracked to gauge progress toward other achievements in the marketing funnel.
It refers to the total number of people who completed a form or other action to gain access to your content – attend an event, download a lead-magnet asset, receive email newsletters, join your brand community, etc.
When registrants or subscribers renew, that renewal rate is a metric that can be used to gauge brand loyalty.
Return on investment (ROI)
Return on investment is a broad term to describe how a company’s marketing initiatives drive profitable actions and business growth. Knowing ROI for content campaigns enables marketers to determine appropriate budget allocations, maximize the efficiency of each marketing expense, and demonstrate the impact of their efforts to their executive stakeholders.
Though it’s (arguably) the most critical measurement of a marketing technique’s effectiveness, the complex nature of attributing conversions to a particular asset can make content ROI difficult to calculate precisely, let alone prove definitively.
Sales-qualified lead (SQL)
An SQL is lead qualified by the sales team as active in the market. These leads are more likely to become a customer than an MQL.
Subscriber count
Subscribers are defined as audience members who have taken an action around your content (and provided some personal data to do so) in exchange for an expectation of receiving ongoing value. It is a core metric for measuring content marketing value.
Time on site/time on page
These metrics indicate how long a visitor spends on the site or a page. Visits that exceed the average time on page (or site) are a positive indication of interest and engagement with that content. However, it’s impossible to tell using this metric alone whether the user actively engaged with the content all that time or simply left it open on their browser.
Video views/duration
Video views measure how many times a video asset is watched. Duration indicates the time the average viewer plays that video. Just because a video was viewed in its entirety does not mean the viewer actively engaged with all of it.
Visits/unique visitors
A visitor is any internet user who arrives on your website (or mobile website). Seems simple, right? But what’s involved in characterizing that visit and how it gets factored into content measurement is more complicated.
In Google Analytics, to track site visits, the user needs to have enabled tracking cookies. (This is why the end of third-party cookies was likened, at least at first, to the end of digital marketing.)
There also is a distinction between visits and unique visitors. Visits encompass any time a user visits your site. Unique visitors refers to the number of people who browsed your site during a session. A unique visitor who visited several times during that session would count as one unique visitor. If they returned after the session, that would count as another unique visit.
Know what’s in the measurement name
Every content marketing program requires a solid measurement strategy. By knowing the terms and understanding how they fit in your brand’s content marketing, you’re at the start of a successful evaluation of your content’s effectiveness.
HANDPICKED RELATED CONTENT:
Cover image by Joseph Kalinowski/Content Marketing Institute
!function(f,b,e,v,n,t,s)
{if(f.fbq)return;n=f.fbq=function(){n.callMethod?
n.callMethod.apply(n,arguments):n.queue.push(arguments)};
if(!f._fbq)f._fbq=n;n.push=n;n.loaded=!0;n.version=’2.0′;
n.queue=[];t=b.createElement(e);t.async=!0;
t.src=v;s=b.getElementsByTagName(e)[0];
s.parentNode.insertBefore(t,s)}(window, document,’script’,
‘https://connect.facebook.net/en_US/fbevents.js’);
fbq(‘init’, ‘1432232210459613’);
fbq(‘track’, ‘PageView’);
MARKETING
Streamlining Processes for Increased Efficiency and Results

How can businesses succeed nowadays when technology rules? With competition getting tougher and customers changing their preferences often, it’s a challenge. But using marketing automation can help make things easier and get better results. And in the future, it’s going to be even more important for all kinds of businesses.
So, let’s discuss how businesses can leverage marketing automation to stay ahead and thrive.
Benefits of automation marketing automation to boost your efforts
First, let’s explore the benefits of marketing automation to supercharge your efforts:
Marketing automation simplifies repetitive tasks, saving time and effort.
With automated workflows, processes become more efficient, leading to better productivity. For instance, automation not only streamlines tasks like email campaigns but also optimizes website speed, ensuring a seamless user experience. A faster website not only enhances customer satisfaction but also positively impacts search engine rankings, driving more organic traffic and ultimately boosting conversions.
Automation allows for precise targeting, reaching the right audience with personalized messages.
With automated workflows, processes become more efficient, leading to better productivity. A great example of automated workflow is Pipedrive & WhatsApp Integration in which an automated welcome message pops up on their WhatsApp
within seconds once a potential customer expresses interest in your business.
Increases ROI
By optimizing campaigns and reducing manual labor, automation can significantly improve return on investment.
Leveraging automation enables businesses to scale their marketing efforts effectively, driving growth and success. Additionally, incorporating lead scoring into automated marketing processes can streamline the identification of high-potential prospects, further optimizing resource allocation and maximizing conversion rates.
Harnessing the power of marketing automation can revolutionize your marketing strategy, leading to increased efficiency, higher returns, and sustainable growth in today’s competitive market. So, why wait? Start automating your marketing efforts today and propel your business to new heights, moreover if you have just learned ways on how to create an online business
How marketing automation can simplify operations and increase efficiency
Understanding the Change
Marketing automation has evolved significantly over time, from basic email marketing campaigns to sophisticated platforms that can manage entire marketing strategies. This progress has been fueled by advances in technology, particularly artificial intelligence (AI) and machine learning, making automation smarter and more adaptable.
One of the main reasons for this shift is the vast amount of data available to marketers today. From understanding customer demographics to analyzing behavior, the sheer volume of data is staggering. Marketing automation platforms use this data to create highly personalized and targeted campaigns, allowing businesses to connect with their audience on a deeper level.
The Emergence of AI-Powered Automation
In the future, AI-powered automation will play an even bigger role in marketing strategies. AI algorithms can analyze huge amounts of data in real-time, helping marketers identify trends, predict consumer behavior, and optimize campaigns as they go. This agility and responsiveness are crucial in today’s fast-moving digital world, where opportunities come and go in the blink of an eye. For example, we’re witnessing the rise of AI-based tools from AI website builders, to AI logo generators and even more, showing that we’re competing with time and efficiency.
Combining AI-powered automation with WordPress management services streamlines marketing efforts, enabling quick adaptation to changing trends and efficient management of online presence.
Moreover, AI can take care of routine tasks like content creation, scheduling, and testing, giving marketers more time to focus on strategic activities. By automating these repetitive tasks, businesses can work more efficiently, leading to better outcomes. AI can create social media ads tailored to specific demographics and preferences, ensuring that the content resonates with the target audience. With the help of an AI ad maker tool, businesses can efficiently produce high-quality advertisements that drive engagement and conversions across various social media platforms.
Personalization on a Large Scale
Personalization has always been important in marketing, and automation is making it possible on a larger scale. By using AI and machine learning, marketers can create tailored experiences for each customer based on their preferences, behaviors, and past interactions with the brand.
This level of personalization not only boosts customer satisfaction but also increases engagement and loyalty. When consumers feel understood and valued, they are more likely to become loyal customers and brand advocates. As automation technology continues to evolve, we can expect personalization to become even more advanced, enabling businesses to forge deeper connections with their audience. As your company has tiny homes for sale California, personalized experiences will ensure each customer finds their perfect fit, fostering lasting connections.
Integration Across Channels
Another trend shaping the future of marketing automation is the integration of multiple channels into a cohesive strategy. Today’s consumers interact with brands across various touchpoints, from social media and email to websites and mobile apps. Marketing automation platforms that can seamlessly integrate these channels and deliver consistent messaging will have a competitive edge. When creating a comparison website it’s important to ensure that the platform effectively aggregates data from diverse sources and presents it in a user-friendly manner, empowering consumers to make informed decisions.
Omni-channel integration not only betters the customer experience but also provides marketers with a comprehensive view of the customer journey. By tracking interactions across channels, businesses can gain valuable insights into how consumers engage with their brand, allowing them to refine their marketing strategies for maximum impact. Lastly, integrating SEO services into omni-channel strategies boosts visibility and helps businesses better understand and engage with their customers across different platforms.
The Human Element
While automation offers many benefits, it’s crucial not to overlook the human aspect of marketing. Despite advances in AI and machine learning, there are still elements of marketing that require human creativity, empathy, and strategic thinking.
Successful marketing automation strikes a balance between technology and human expertise. By using automation to handle routine tasks and data analysis, marketers can focus on what they do best – storytelling, building relationships, and driving innovation.
Conclusion
The future of marketing automation looks promising, offering improved efficiency and results for businesses of all sizes.
As AI continues to advance and consumer expectations change, automation will play an increasingly vital role in keeping businesses competitive.
By embracing automation technologies, marketers can simplify processes, deliver more personalized experiences, and ultimately, achieve their business goals more effectively than ever before.
MARKETING
Will Google Buy HubSpot? | Content Marketing Institute
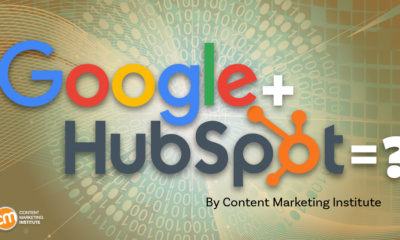
Google + HubSpot. Is it a thing?
This week, a flurry of news came down about Google’s consideration of purchasing HubSpot.
The prospect dismayed some. It delighted others.
But is it likely? Is it even possible? What would it mean for marketers? What does the consideration even mean for marketers?
Well, we asked CMI’s chief strategy advisor, Robert Rose, for his take. Watch this video or read on:
Why Alphabet may want HubSpot
Alphabet, the parent company of Google, apparently is contemplating the acquisition of inbound marketing giant HubSpot.
The potential price could be in the range of $30 billion to $40 billion. That would make Alphabet’s largest acquisition by far. The current deal holding that title happened in 2011 when it acquired Motorola Mobility for more than $12 billion. It later sold it to Lenovo for less than $3 billion.
If the HubSpot deal happens, it would not be in character with what the classic evil villain has been doing for the past 20 years.
At first glance, you might think the deal would make no sense. Why would Google want to spend three times as much as it’s ever spent to get into the inbound marketing — the CRM and marketing automation business?
At a second glance, it makes a ton of sense.
I don’t know if you’ve noticed, but I and others at CMI spend a lot of time discussing privacy, owned media, and the deprecation of the third-party cookie. I just talked about it two weeks ago. It’s really happening.
All that oxygen being sucked out of the ad tech space presents a compelling case that Alphabet should diversify from third-party data and classic surveillance-based marketing.
Yes, this potential acquisition is about data. HubSpot would give Alphabet the keys to the kingdom of 205,000 business customers — and their customers’ data that almost certainly numbers in the tens of millions. Alphabet would also gain access to the content, marketing, and sales information those customers consumed.
Conversely, the deal would provide an immediate tip of the spear for HubSpot clients to create more targeted programs in the Alphabet ecosystem and upload their data to drive even more personalized experiences on their own properties and connect them to the Google Workspace infrastructure.
When you add in the idea of Gemini, you can start to see how Google might monetize its generative AI tool beyond figuring out how to use it on ads on search results pages.
What acquisition could mean for HubSpot customers
I may be stretching here but imagine this world. As a Hubspoogle customer, you can access an interface that prioritizes your owned media data (e.g., your website, your e-commerce catalog, blog) when Google’s Gemini answers a question).
Recent reports also say Google may put up a paywall around the new premium features of its artificial intelligence-powered Search Generative Experience. Imagine this as the new gating for marketing. In other words, users can subscribe to Google’s AI for free, but Hubspoogle customers can access that data and use it to create targeted offers.
The acquisition of HubSpot would immediately make Google Workspace a more robust competitor to Microsoft 365 Office for small- and medium-sized businesses as they would receive the ADDED capability of inbound marketing.
But in the world of rented land where Google is the landlord, the government will take notice of the acquisition. But — and it’s a big but, I cannot lie (yes, I just did that). The big but is whether this acquisition dance can happen without going afoul of regulatory issues.
Some analysts say it should be no problem. Others say, “Yeah, it wouldn’t go.” Either way, would anybody touch it in an election year? That’s a whole other story.
What marketers should realize
So, what’s my takeaway?
It’s a remote chance that Google will jump on this hard, but stranger things have happened. It would be an exciting disruption in the market.
The sure bet is this. The acquisition conversation — as if you needed more data points — says getting good at owned media to attract and build audiences and using that first-party data to provide better communication and collaboration with your customers are a must.
It’s just a matter of time until Google makes a move. They might just be testing the waters now, but they will move here. But no matter what they do, if you have your customer data house in order, you’ll be primed for success.
HANDPICKED RELATED CONTENT:
Cover image by Joseph Kalinowski/Content Marketing Institute
MARKETING
5 Psychological Tactics to Write Better Emails

Welcome to Creator Columns, where we bring expert HubSpot Creator voices to the Blogs that inspire and help you grow better.
I’ve tested 100s of psychological tactics on my email subscribers. In this blog, I reveal the five tactics that actually work.
You’ll learn about the email tactic that got one marketer a job at the White House.
You’ll learn how I doubled my 5 star reviews with one email, and why one strange email from Barack Obama broke all records for donations.
5 Psychological Tactics to Write Better Emails
Imagine writing an email that’s so effective it lands you a job at the White House.
Well, that’s what happened to Maya Shankar, a PhD cognitive neuroscientist. In 2014, the Department of Veterans Affairs asked her to help increase signups in their veteran benefit scheme.
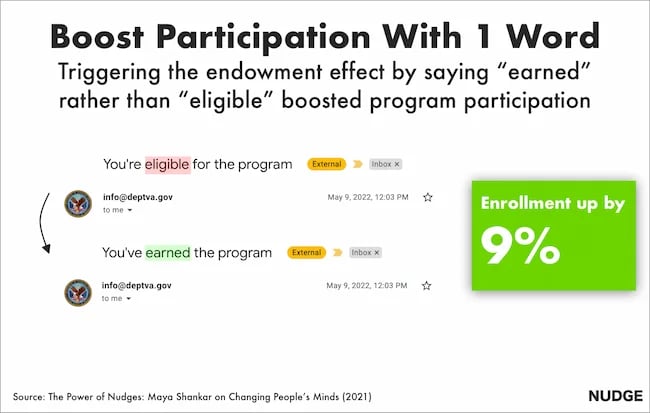
Maya had a plan. She was well aware of a cognitive bias that affects us all—the endowment effect. This bias suggests that people value items higher if they own them. So, she changed the subject line in the Veterans’ enrollment email.
Previously it read:
- Veterans, you’re eligible for the benefit program. Sign up today.
She tweaked one word, changing it to:
- Veterans, you’ve earned the benefits program. Sign up today.
This tiny tweak had a big impact. The amount of veterans enrolling in the program went up by 9%. And Maya landed a job working at the White House
Inspired by these psychological tweaks to emails, I started to run my own tests.
Alongside my podcast Nudge, I’ve run 100s of email tests on my 1,000s of newsletter subscribers.
Here are the five best tactics I’ve uncovered.
1. Show readers what they’re missing.
Nobel prize winning behavioral scientists Daniel Kahneman and Amos Tversky uncovered a principle called loss aversion.
Loss aversion means that losses feel more painful than equivalent gains. In real-world terms, losing $10 feels worse than how gaining $10 feels good. And I wondered if this simple nudge could help increase the number of my podcast listeners.
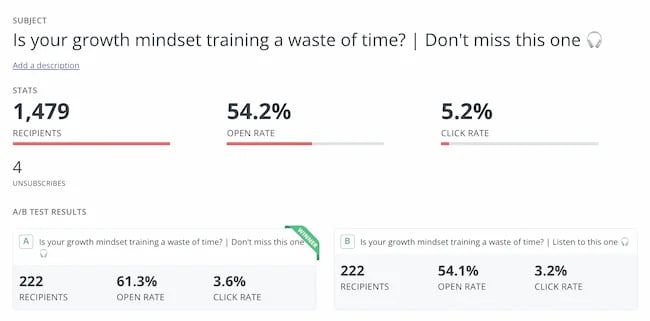
For my test, I tweaked the subject line of the email announcing an episode. The control read:
“Listen to this one”
In the loss aversion variant it read:
“Don’t miss this one”
It is very subtle loss aversion. Rather than asking someone to listen, I’m saying they shouldn’t miss out. And it worked. It increased the open rate by 13.3% and the click rate by 12.5%. Plus, it was a small change that cost me nothing at all.
2. People follow the crowd.
In general, humans like to follow the masses. When picking a dish, we’ll often opt for the most popular. When choosing a movie to watch, we tend to pick the box office hit. It’s a well-known psychological bias called social proof.
I’ve always wondered if it works for emails. So, I set up an A/B experiment with two subject lines. Both promoted my show, but one contained social proof.
The control read: New Nudge: Why Brands Should Flaunt Their Flaws
The social proof variant read: New Nudge: Why Brands Should Flaunt Their Flaws (100,000 Downloads)
I hoped that by highlighting the episode’s high number of downloads, I’d encourage more people to listen. Fortunately, it worked.
The open rate went from 22% to 28% for the social proof version, and the click rate, (the number of people actually listening to the episode), doubled.
3. Praise loyal subscribers.
The consistency principle suggests that people are likely to stick to behaviours they’ve previously taken. A retired taxi driver won’t swap his car for a bike. A hairdresser won’t change to a cheap shampoo. We like to stay consistent with our past behaviors.
I decided to test this in an email.
For my test, I attempted to encourage my subscribers to leave a review for my podcast. I sent emails to 400 subscribers who had been following the show for a year.
The control read: “Could you leave a review for Nudge?”
The consistency variant read: “You’ve been following Nudge for 12 months, could you leave a review?”
My hypothesis was simple. If I remind people that they’ve consistently supported the show they’ll be more likely to leave a review.
It worked.
The open rate on the consistency version of the email was 7% higher.
But more importantly, the click rate, (the number of people who actually left a review), was almost 2x higher for the consistency version. Merely telling people they’d been a fan for a while doubled my reviews.
4. Showcase scarcity.
We prefer scarce resources. Taylor Swift gigs sell out in seconds not just because she’s popular, but because her tickets are hard to come by.
Swifties aren’t the first to experience this. Back in 1975, three researchers proved how powerful scarcity is. For the study, the researchers occupied a cafe. On alternating weeks they’d make one small change in the cafe.
On some weeks they’d ensure the cookie jar was full.
On other weeks they’d ensure the cookie jar only contained two cookies (never more or less).
In other words, sometimes the cookies looked abundantly available. Sometimes they looked like they were almost out.
This changed behaviour. Customers who saw the two cookie jar bought 43% more cookies than those who saw the full jar.
It sounds too good to be true, so I tested it for myself.
I sent an email to 260 subscribers offering free access to my Science of Marketing course for one day only.
In the control, the subject line read: “Free access to the Science of Marketing course”
For the scarcity variant it read: “Only Today: Get free access to the Science of Marketing Course | Only one enrol per person.”
130 people received the first email, 130 received the second. And the result was almost as good as the cookie finding. The scarcity version had a 15.1% higher open rate.

5. Spark curiosity.
All of the email tips I’ve shared have only been tested on my relatively small audience. So, I thought I’d end with a tip that was tested on the masses.
Back in 2012, Barack Obama and his campaign team sent hundreds of emails to raise funds for his campaign.
Of the $690 million he raised, most came from direct email appeals. But there was one email, according to ABC news, that was far more effective than the rest. And it was an odd one.
The email that drew in the most cash, had a strange subject line. It simply said “Hey.”
The actual email asked the reader to donate, sharing all the expected reasons, but the subject line was different.
It sparked curiosity, it got people wondering, is Obama saying Hey just to me?
Readers were curious and couldn’t help but open the email. According to ABC it was “the most effective pitch of all.”
Because more people opened, it raised more money than any other email. The bias Obama used here is the curiosity gap. We’re more likely to act on something when our curiosity is piqued.

Loss aversion, social proof, consistency, scarcity and curiosity—all these nudges have helped me improve my emails. And I reckon they’ll work for you.
It’s not guaranteed of course. Many might fail. But running some simple a/b tests for your emails is cost free, so why not try it out?
This blog is part of Phill Agnew’s Marketing Cheat Sheet series where he reveals the scientifically proven tips to help you improve your marketing. To learn more, listen to his podcast Nudge, a proud member of the Hubspot Podcast Network.
-

 WORDPRESS6 days ago
Turkish startup ikas attracts $20M for its e-commerce platform designed for small businesses
-

 PPC7 days ago
A History of Google AdWords and Google Ads: Revolutionizing Digital Advertising & Marketing Since 2000
-

 MARKETING6 days ago
Roundel Media Studio: What to Expect From Target’s New Self-Service Platform
-

 SEO5 days ago
Google Limits News Links In California Over Proposed ‘Link Tax’ Law
-

 MARKETING6 days ago
Unlocking the Power of AI Transcription for Enhanced Content Marketing Strategies
-

 SEARCHENGINES6 days ago
Google Search Results Can Be Harmful & Dangerous In Some Cases
-
SEARCHENGINES5 days ago
Daily Search Forum Recap: April 12, 2024
-

 SEO4 days ago
10 Paid Search & PPC Planning Best Practices





![5 Psychological Tactics to Write Better Emails → Download Now: The Beginner's Guide to Email Marketing [Free Ebook]](https://articles.entireweb.com/wp-content/uploads/2023/02/11-Free-Email-Hacks-to-Step-Up-Your-Productivity.png)

You must be logged in to post a comment Login