Connect with us
Cloak And Track Your Affiliate Links With Our User-Friendly Link Cloaking Tool, Try It Free

SEO

How to Visualize Ahrefs Data with ChatGPT

Published

on

How to Visualize Ahrefs Data with ChatGPT

SEOs have access to so much data that sometimes, it’s hard to know what to do with it all. I’ve been experimenting with visualizing Ahrefs data using GPT-4, so I thought I’d share the results with you all.

We’ve already launched some AI-enhanced features like search intent, but we made it even better by adding the traffic share for each intent. Check out this write-up from Si Quan for some more things we might add.

For the visualizations, you’ll need GPT-4. There’s an API, but you can also just use ChatGPT Plus for $20 a month. I’m hoping to bring many of these visuals to life within the tool, but these things take time and you can create them now. Let me know your favorites and any other use cases you find that you want to see us add!

IMPORTANT

For all these, export the data in UTF-8 format from the report indicated and run the prompt. Note that your results may differ a bit because of how LLMs work. You may need to ask for some adjustments to get exactly what you want.

Use case:

This allows you to see outliers. If you have some terms ranking better on Desktop vs Mobile, then you might want to look at mobile issues or Core Web Vitals.

You can see both mobile issues and Core Web Vitals in Ahrefs’ Site Audit. You’ll need to run Site Audit as mobile and connect to PageSpeed Insights.
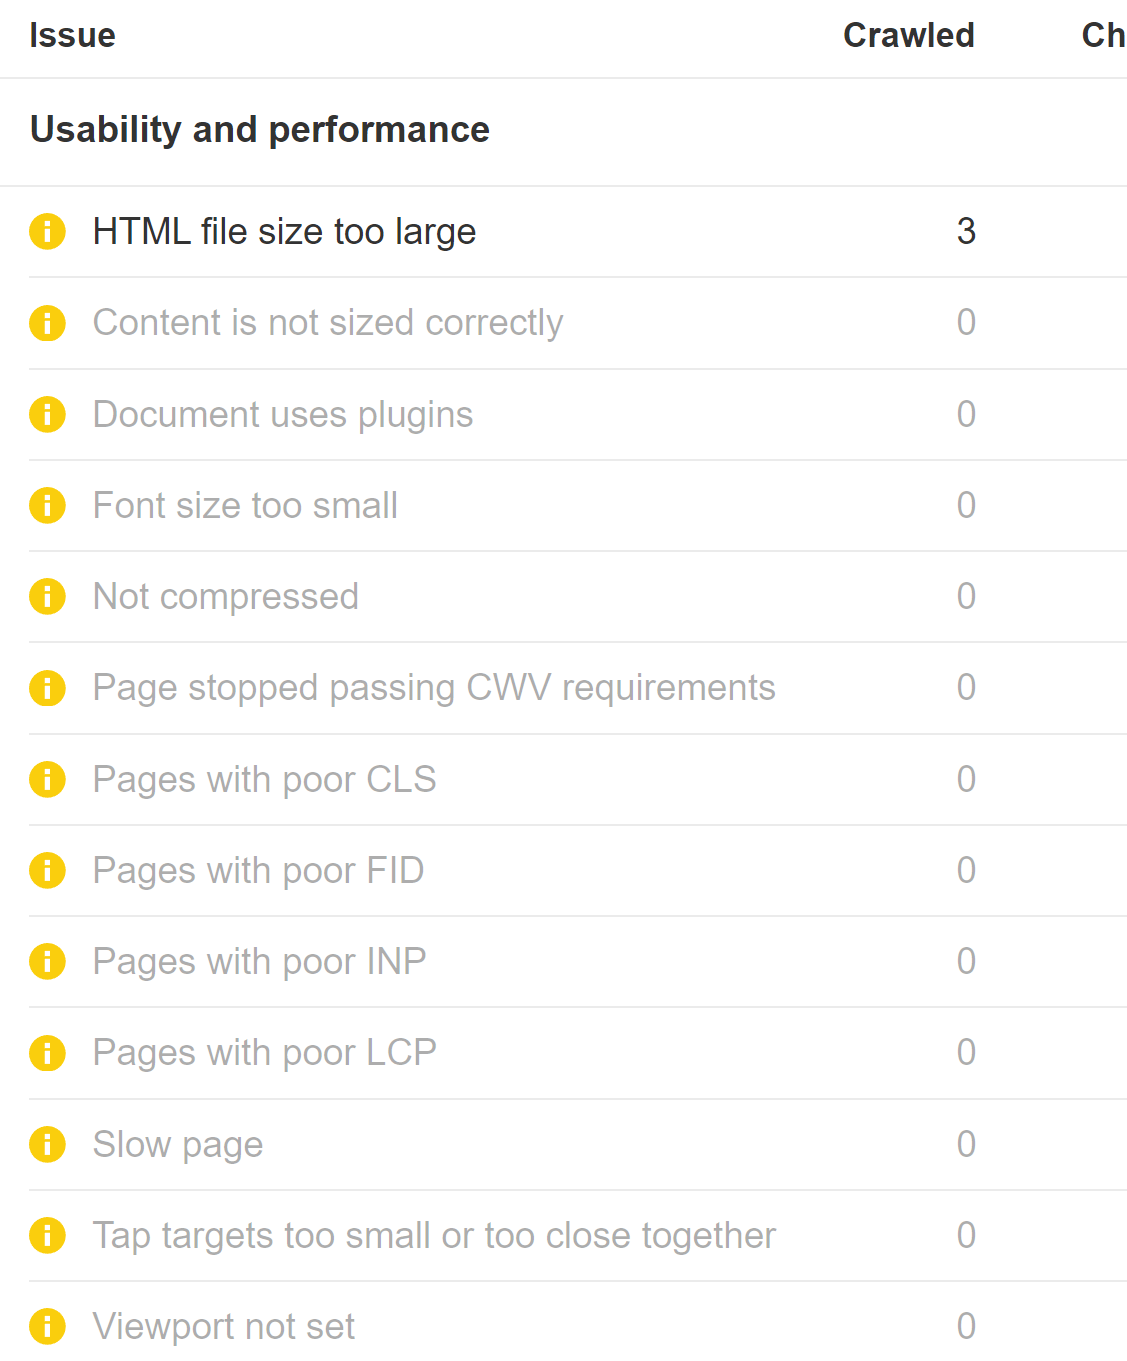
Core Web Vital and mobile usability issues in Ahrefs' Site AuditCore Web Vital and mobile usability issues in Ahrefs' Site Audit

Data source:

Download your desktop and mobile rankings from the Overview report in Rank Tracker (remember to choose the UTF-8 format). Upload both files to ChatGPT.
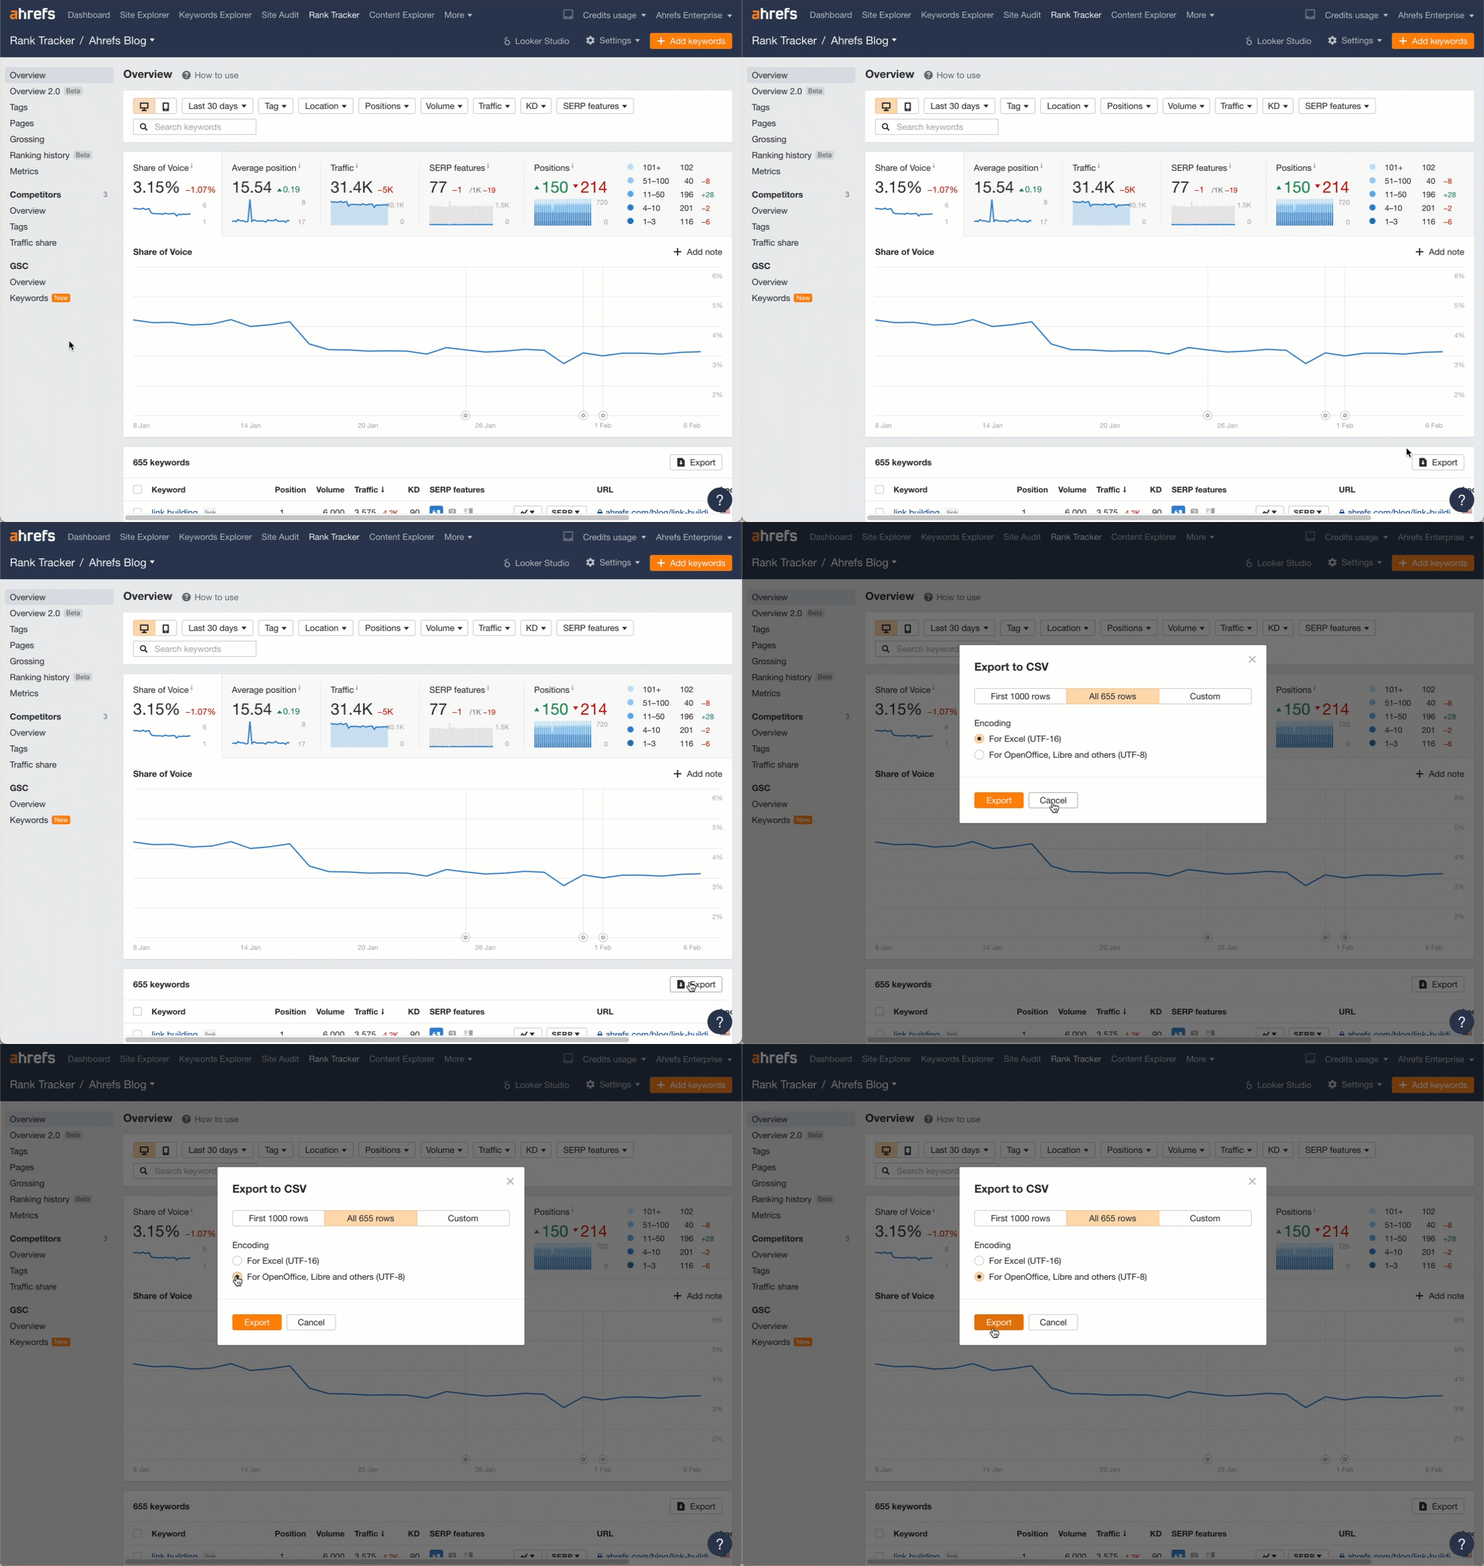
Exporting the data from AhrefsExporting the data from Ahrefs

Prompt:

Read these 2 files that contain desktop and mobile keyword rankings.

Show me a scatter plot comparing the desktop and mobile positions for each keyword.

Label ones that have the biggest gap between rankings.
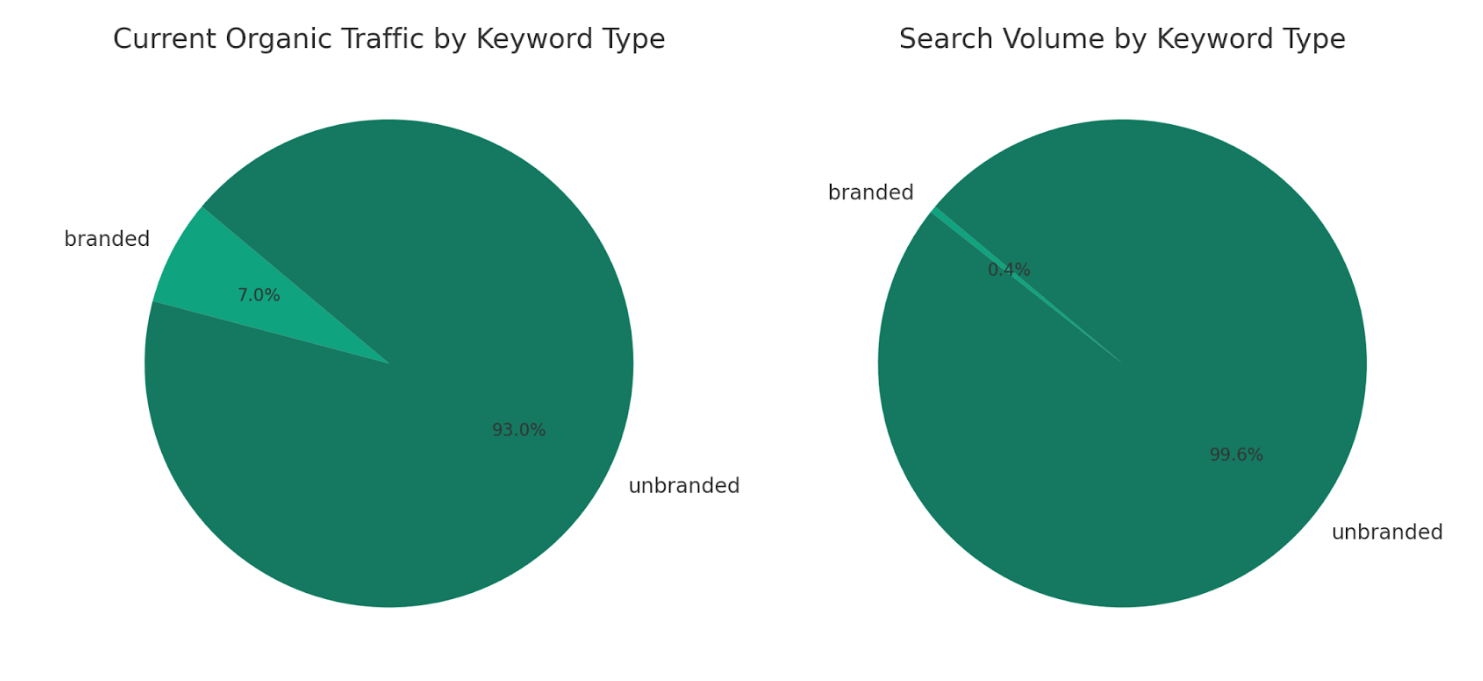
Branded and unbranded organic traffic and volumeBranded and unbranded organic traffic and volume

Use case:

See the breakdown of traffic and total volume by branded and unbranded terms. At a glance, I can see that the majority of our traffic comes from unbranded terms.

Data source:

Download your keyword rankings from the Organic Keywords report in Site Explorer (make sure to select the UTF-8 file format) and upload the file to ChatGPT.
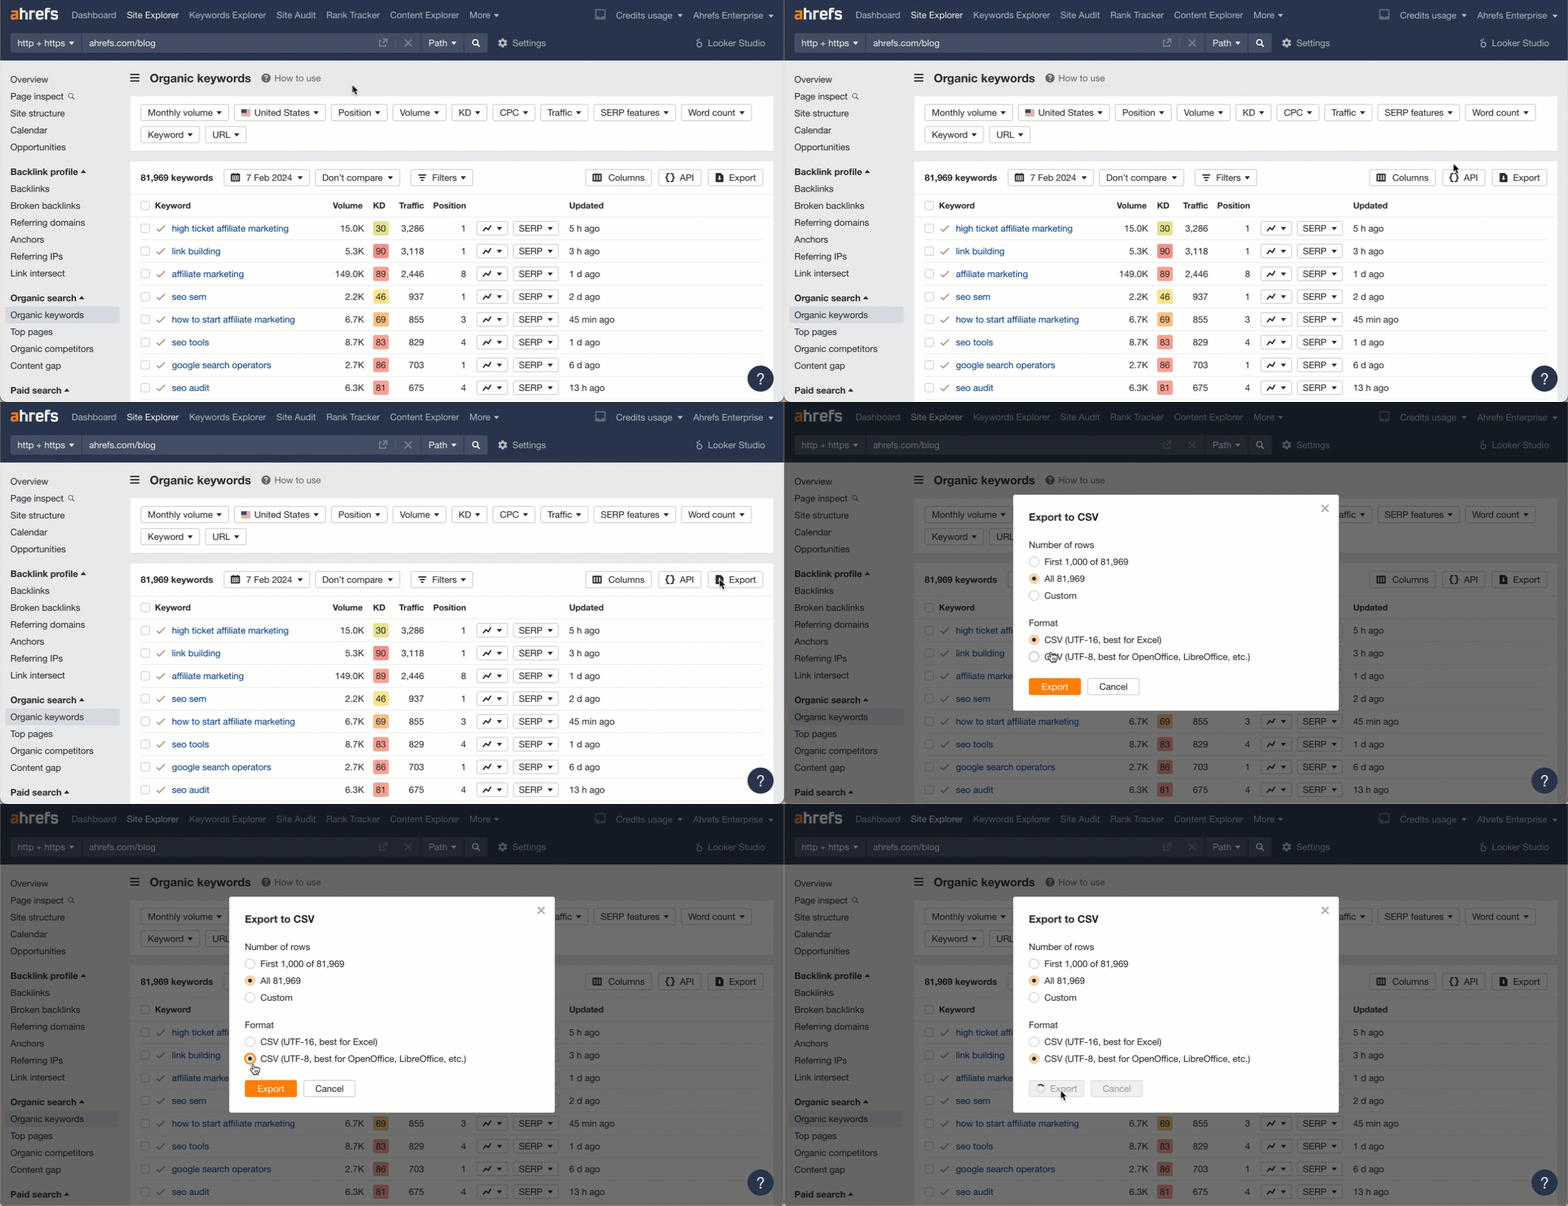
Exporting the data from AhrefsExporting the data from Ahrefs

Prompt:

Label each keyword in the “Keyword” column as branded or unbranded. Then create a pie chart that shows the sum of “Current organic traffic” for both categories.

Also create this chart with the sum of “Volume” for each.
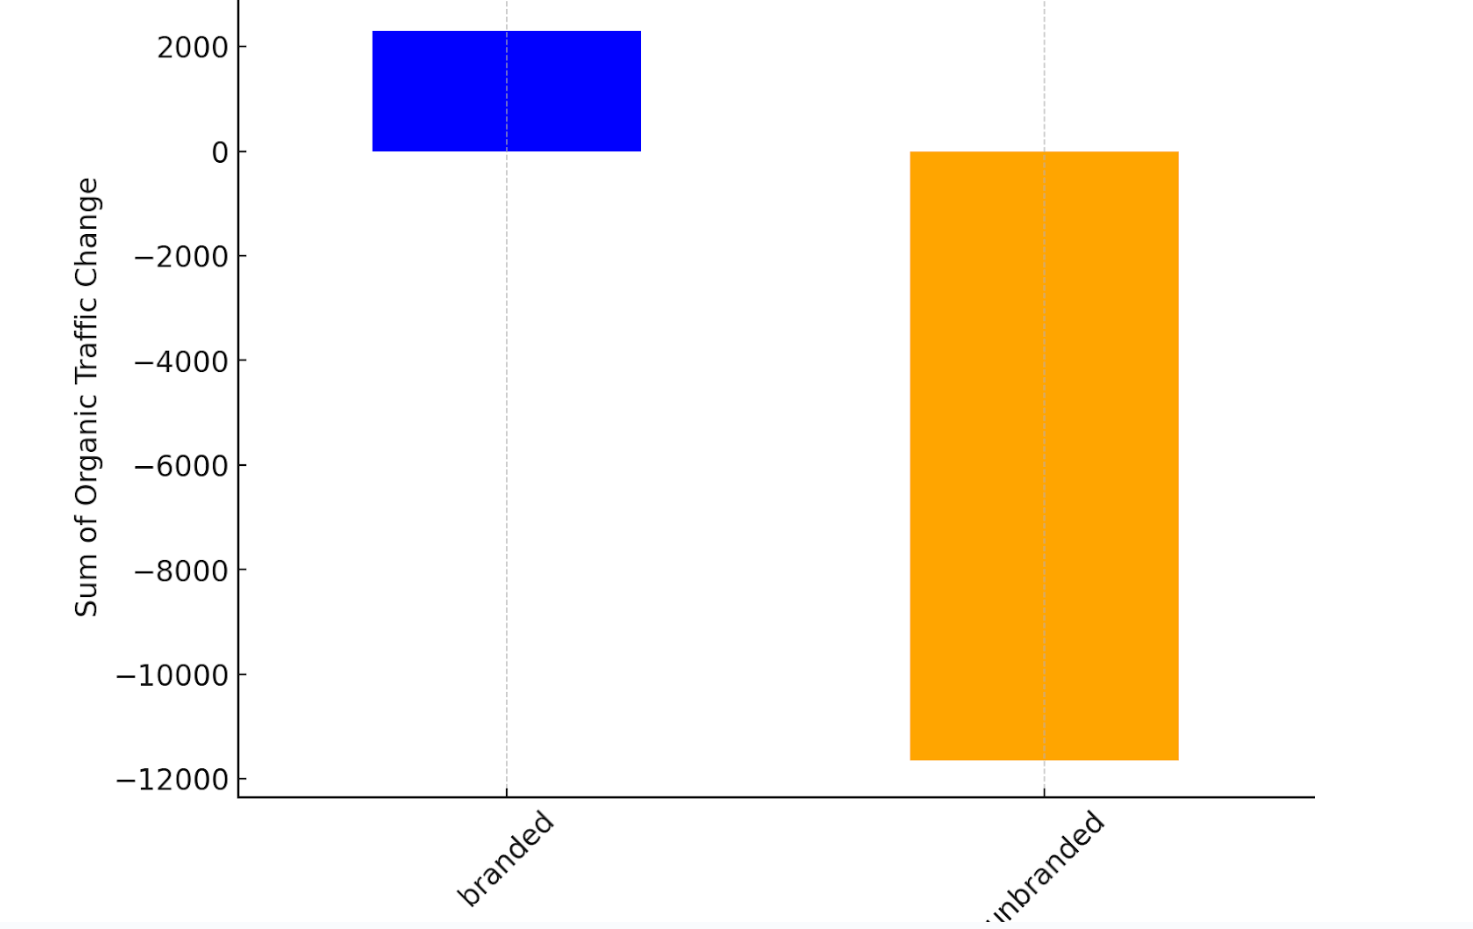
Change in traffic for branded and unbranded termsChange in traffic for branded and unbranded terms

Use case:

See if you’re gaining or losing clicks for branded or unbranded terms between two dates. You need to have compare mode enabled for this to work.

Data source:

Like the previous one, download your keyword rankings from the Organic Keywords report in Site Explorer and upload the file.

Prompt:

Label each keyword in the “Keyword” column as branded or unbranded.

Create a visual that shows me how the organic traffic changed overall for branded and unbranded keywords based on the sum of the data for each in the “Organic traffic change” column.
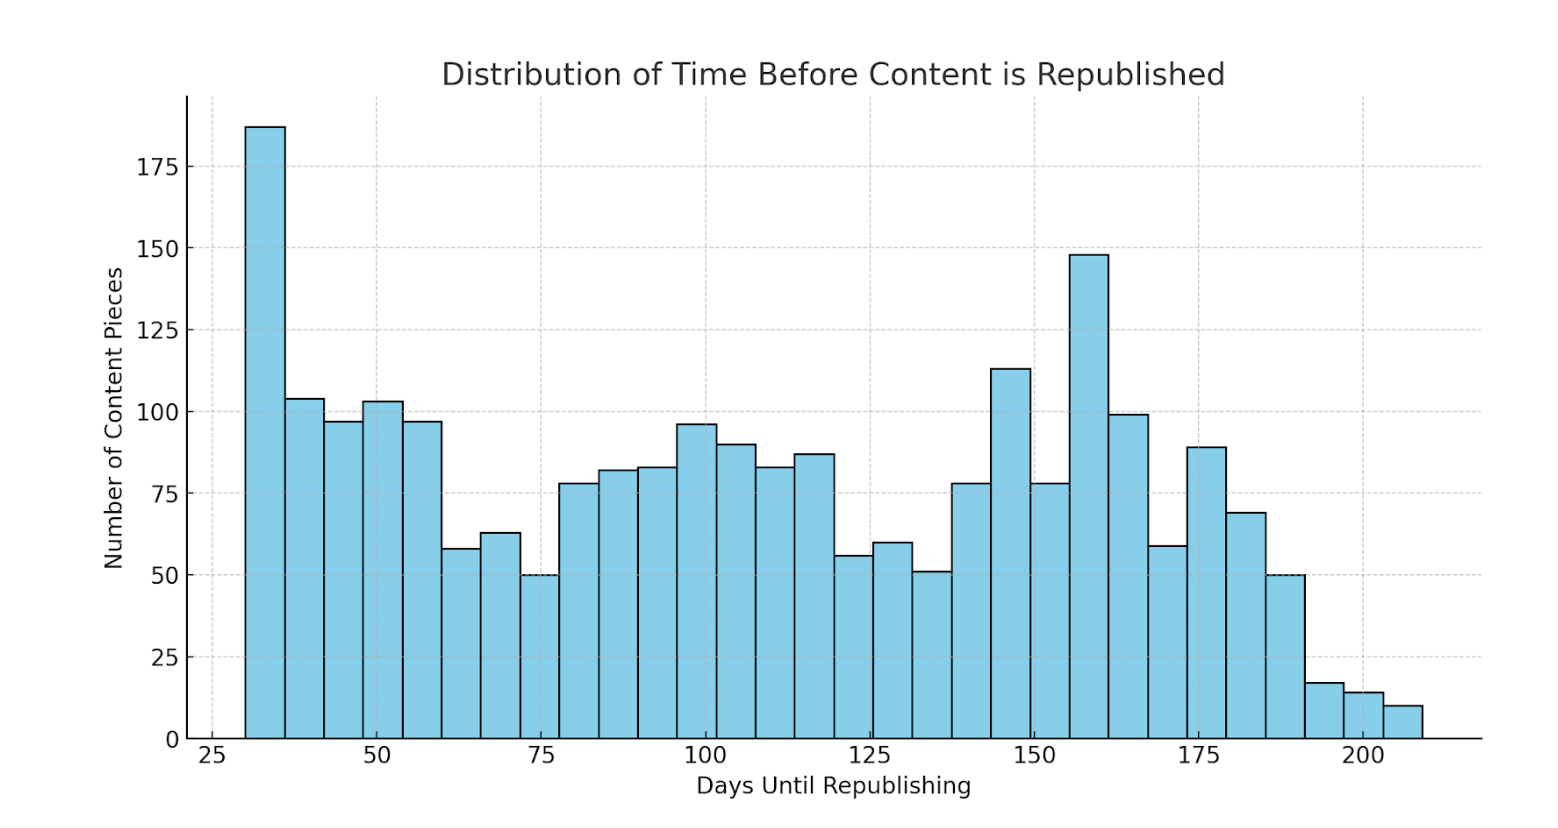
Histogram showing how long it's been since competing content was republishedHistogram showing how long it's been since competing content was republished

Use case:

See the last time competing content was updated. If competitors are updating their content a lot, it can indicate a more competitive market.

Data source:

Enter a competitor’s website into Content Explorer and export the list of pages (choose UTF-8 as the export format). This can also be done with a keyword or topic.
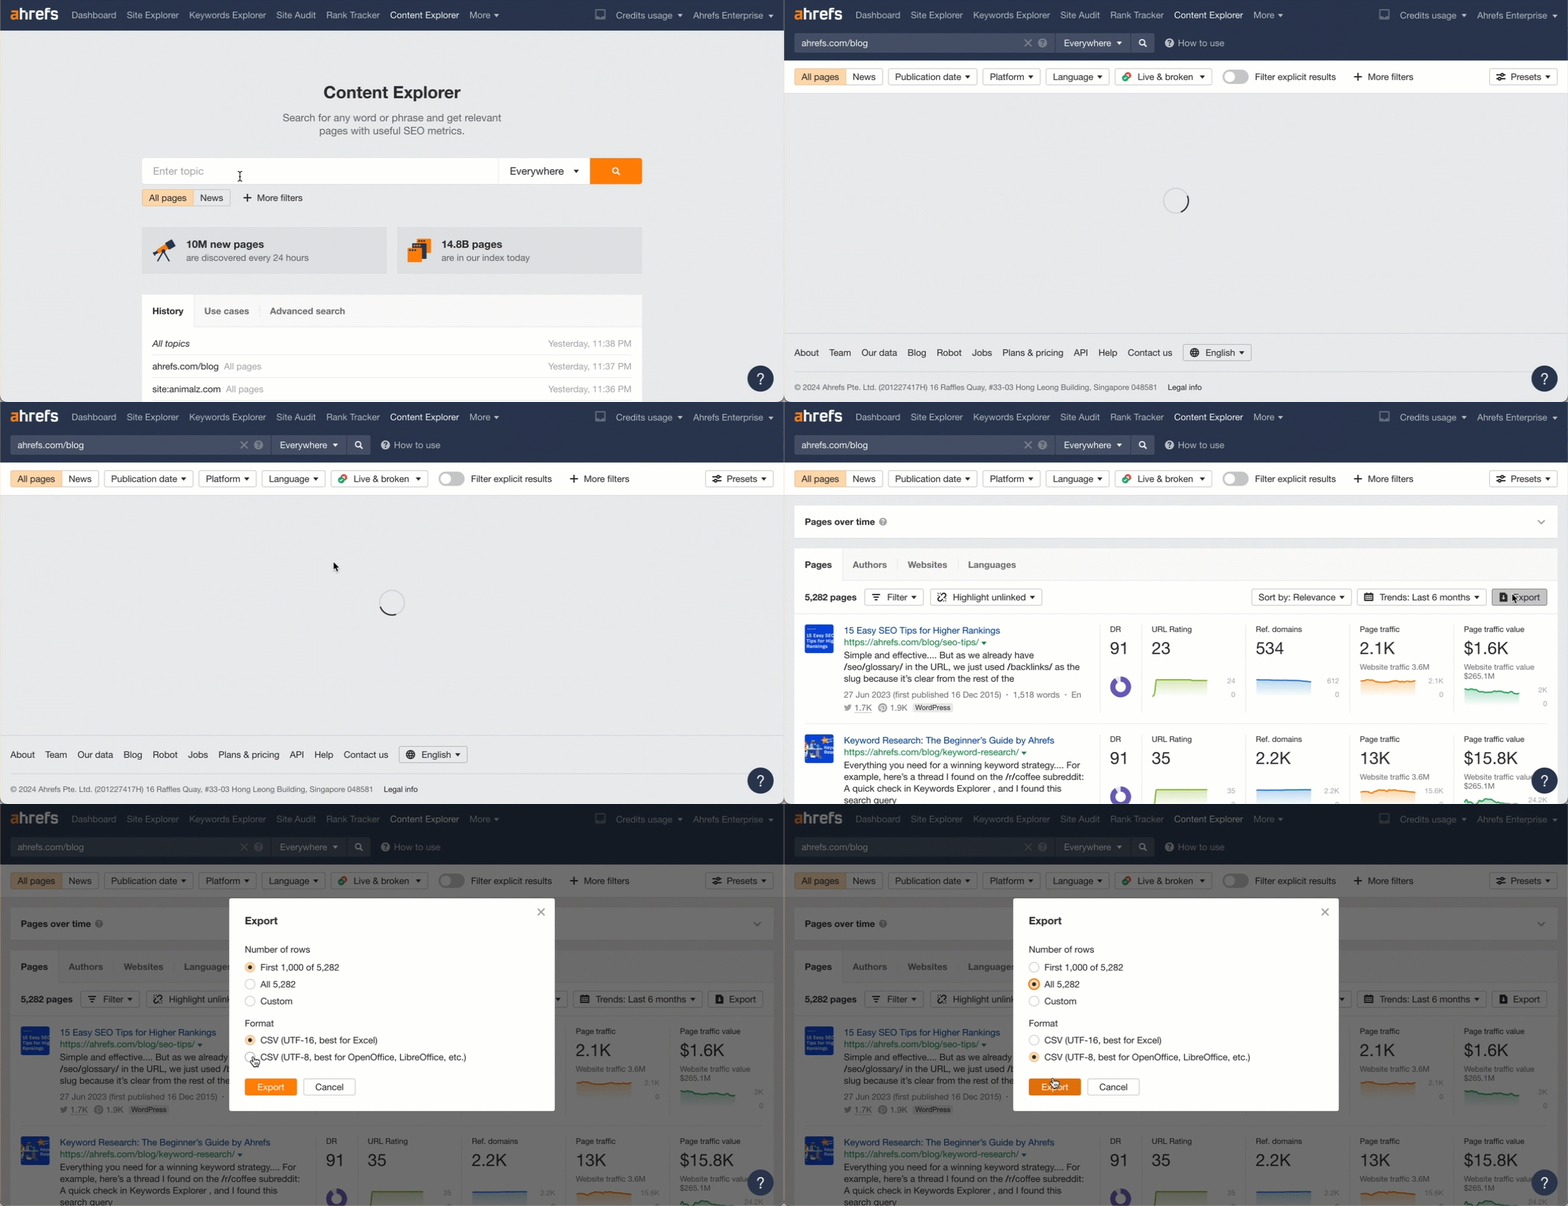
Exporting the data from AhrefsExporting the data from Ahrefs

Prompt:

Show me how many days since the content was updated.
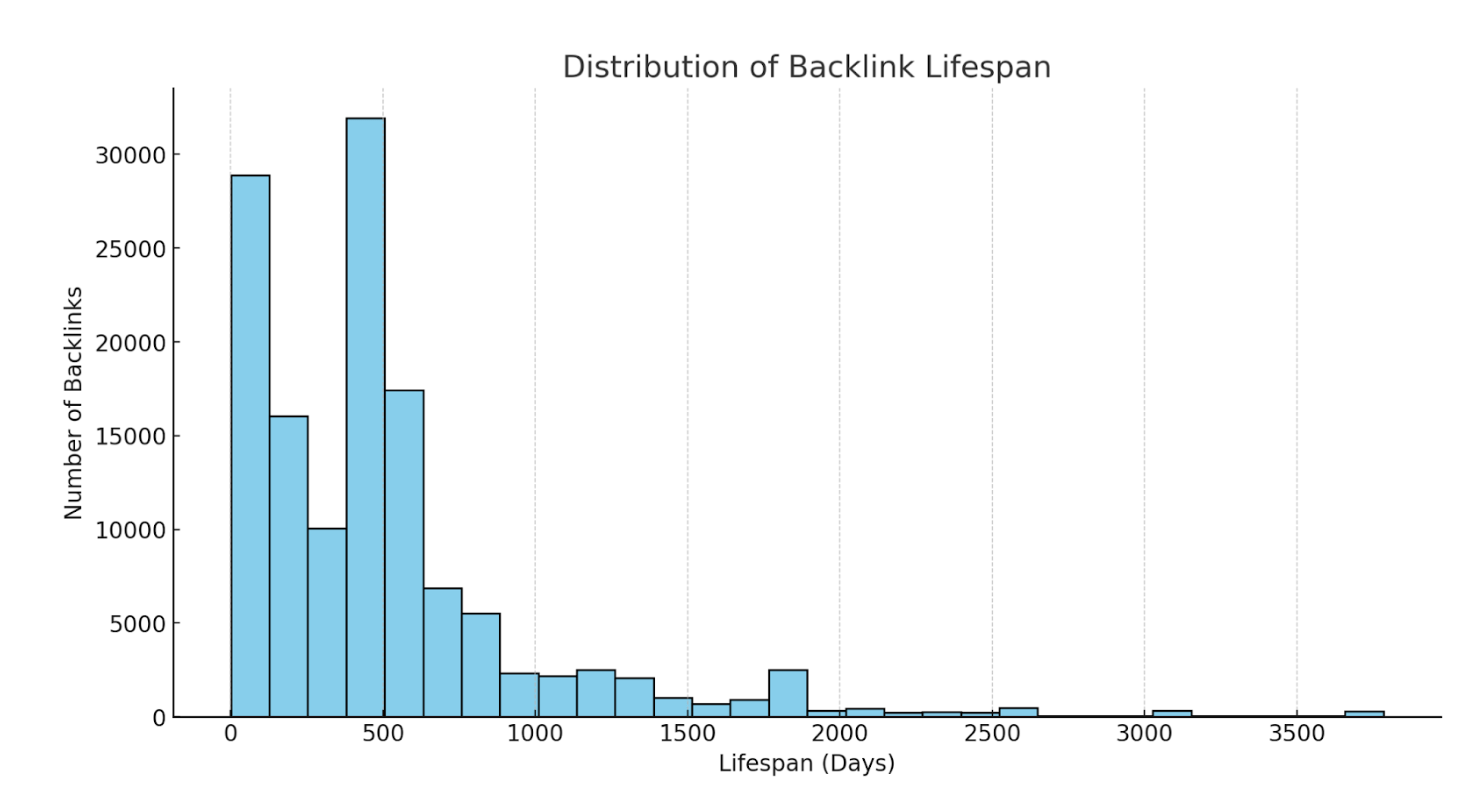
Histogram showing how long it's been since competing content was republishedHistogram showing how long it's been since competing content was republished

Use case:

See how long backlinks were live on average. If you’re losing a lot of backlinks early, you may want to look into the reasons why. Read our study on link rot to see many of the common reasons.

You can filter the Backlinks report for many of the common reasons why links are lost.
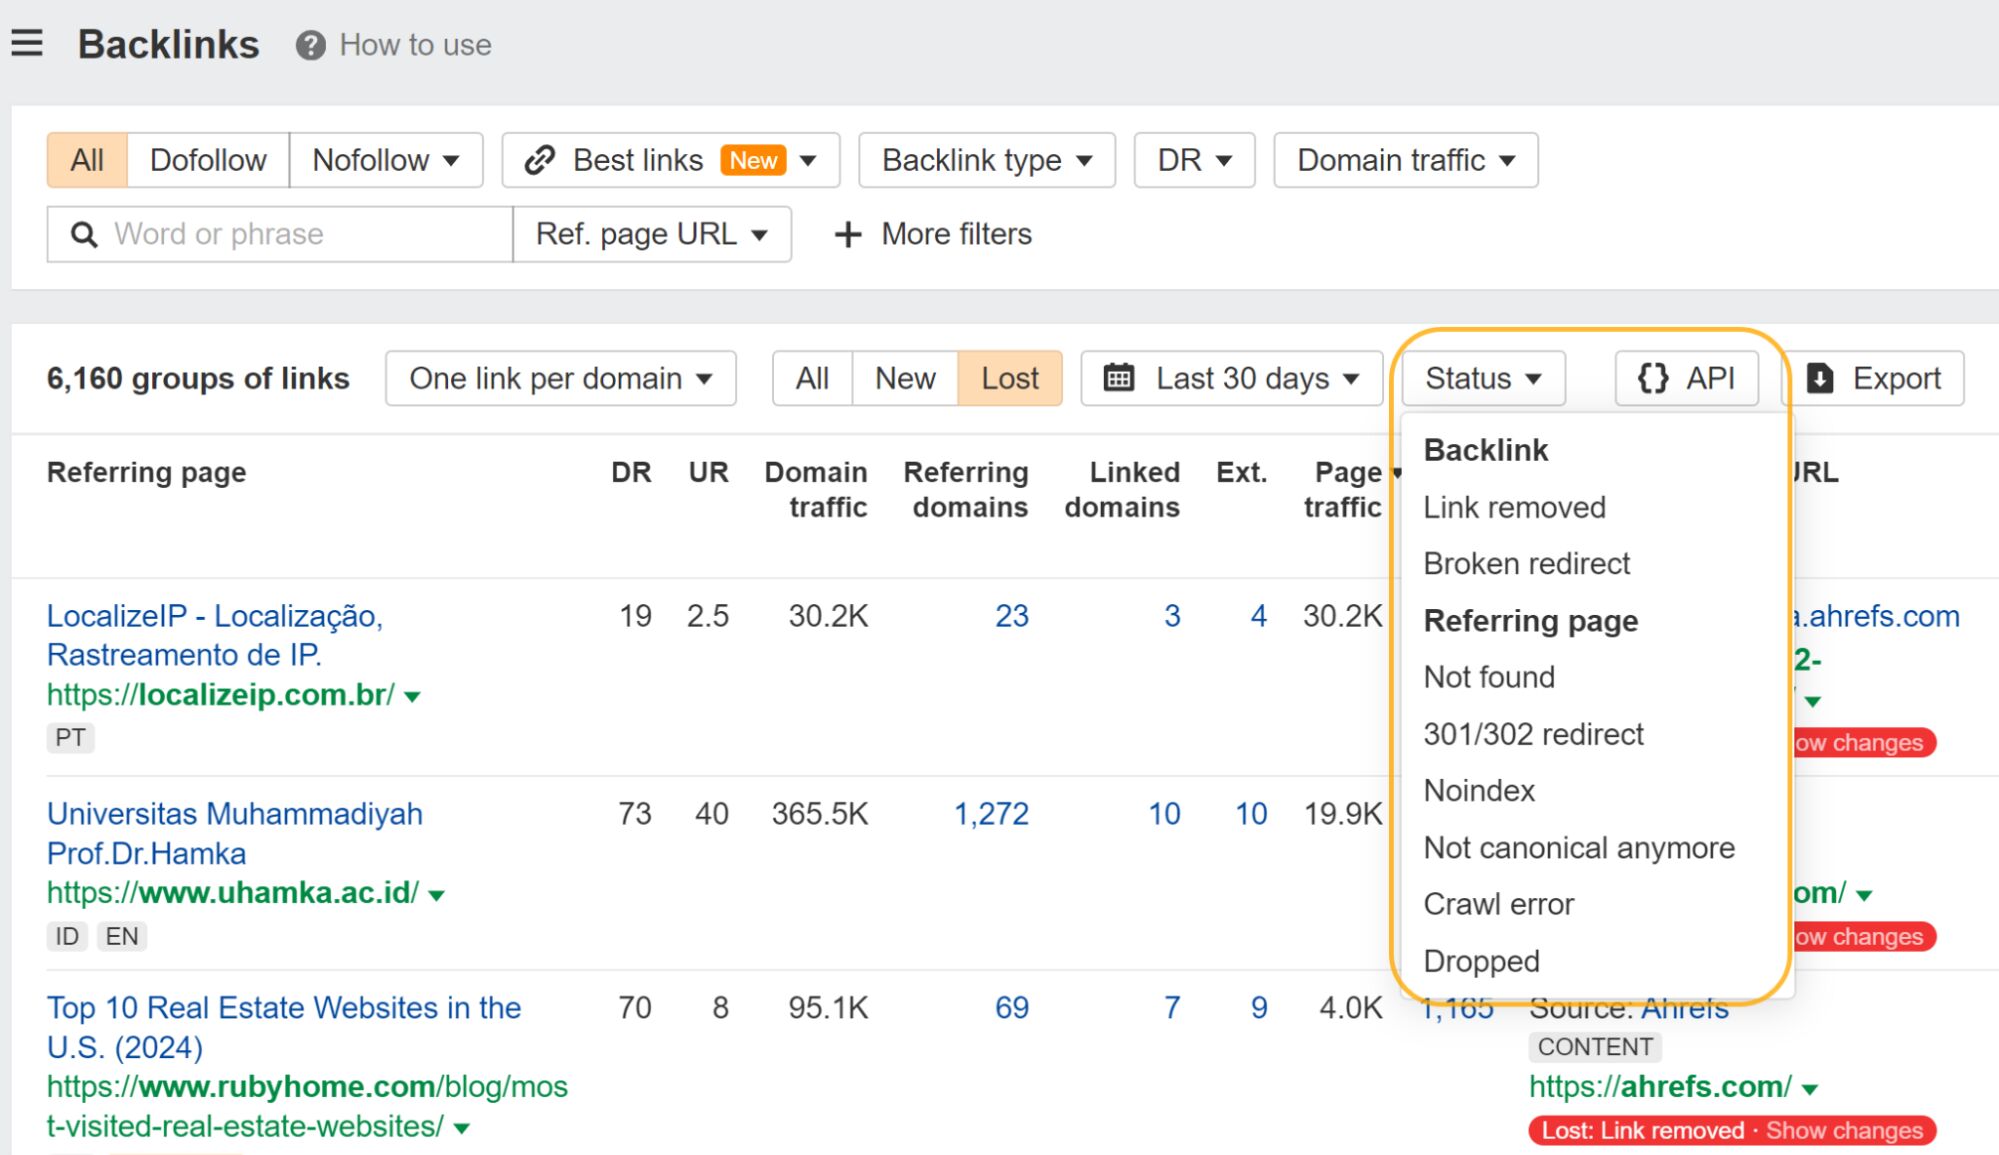
Backlinks filters for the reason they're lostBacklinks filters for the reason they're lost

Data source:

Export your link profile from the Backlinks report in Site Explorer (choose UTF-8 as the file format). Upload this to ChatGPT.
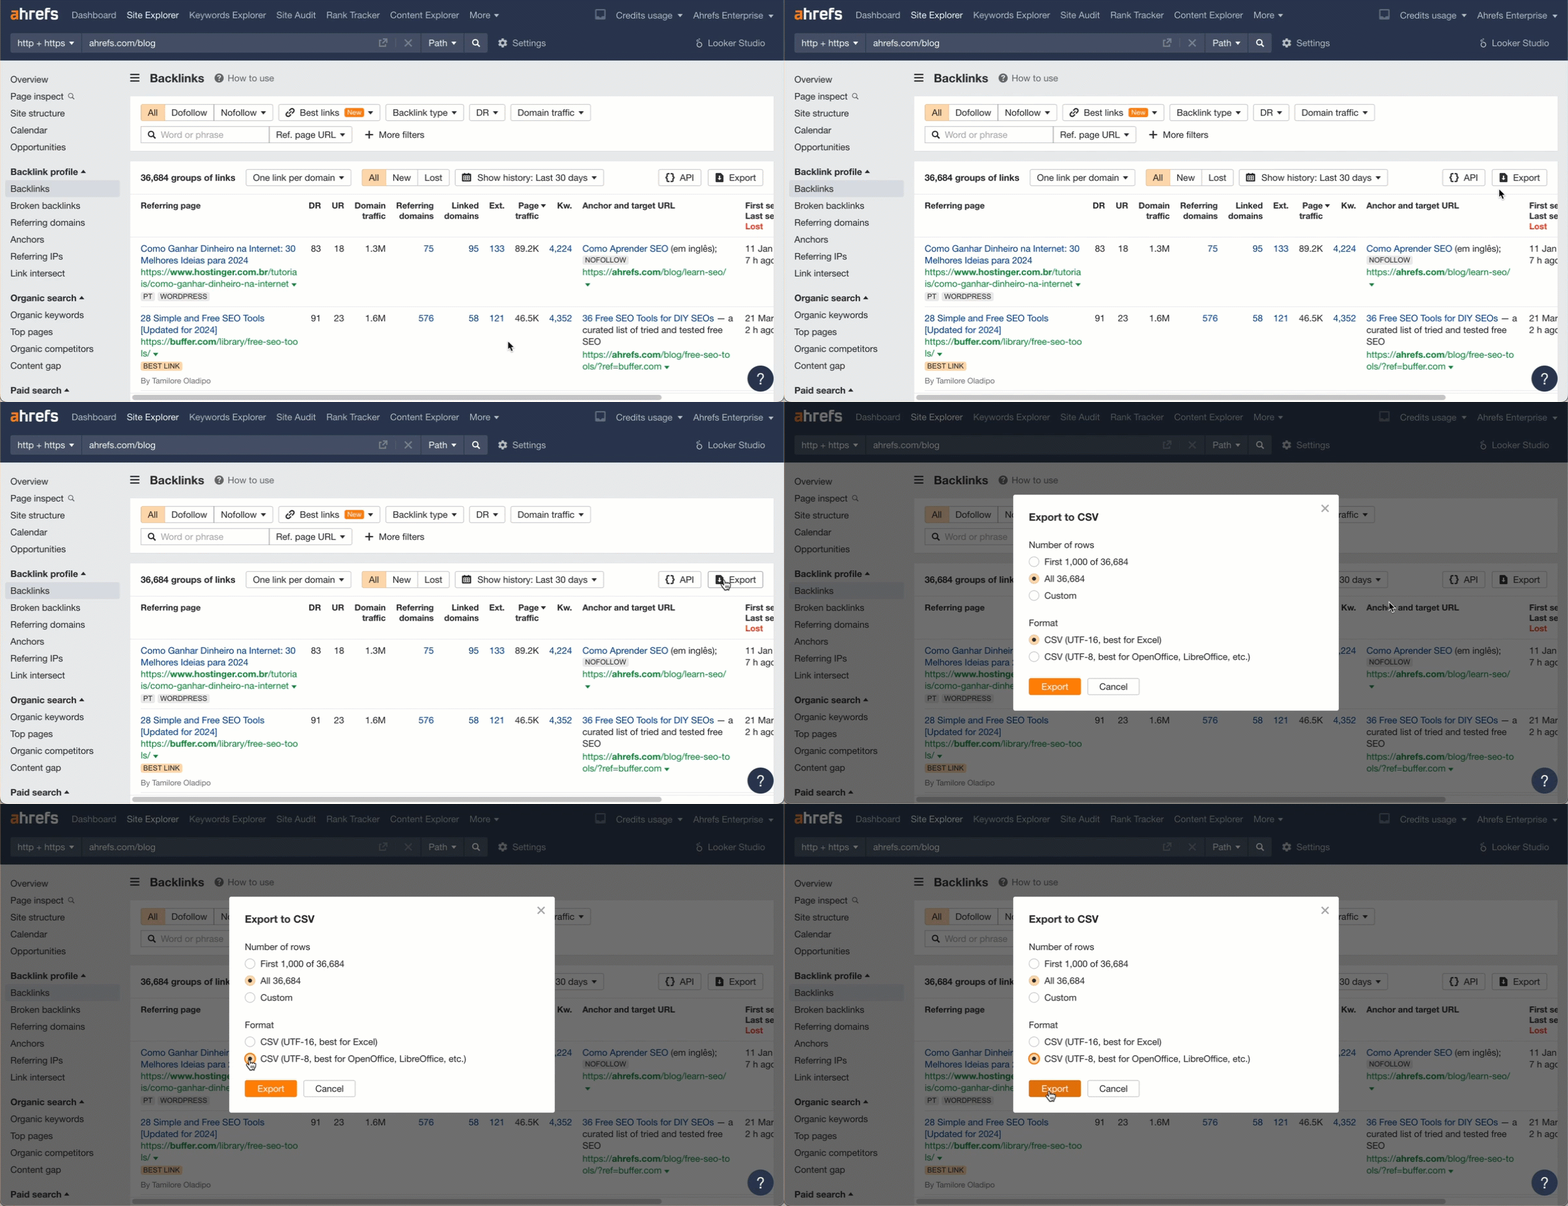
Exporting the data from AhrefsExporting the data from Ahrefs

Prompt:

Read this file and give me a histogram to show the distribution of backlink lifespans.
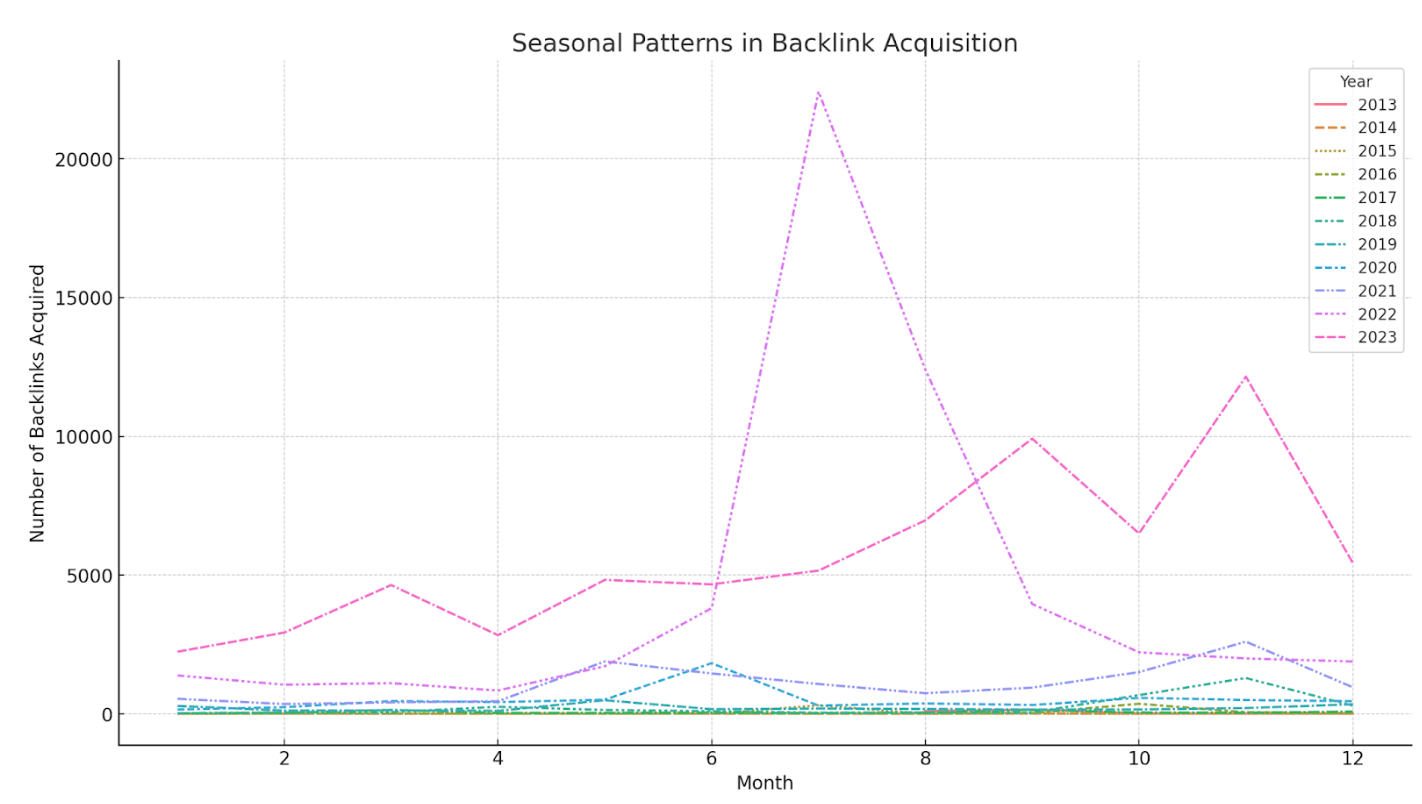
Line chart with a line for each year showing the seasonal patterns in link acquisitionLine chart with a line for each year showing the seasonal patterns in link acquisition

Use case:

See any seasonal patterns for your acquired links. Here, I see a big spike in the middle of 2022 and what seems to be a bit of a spike in November the last few years.

Data source:

Like the previous one, export your link profile from the Backlinks report in Site Explorer. Upload this to ChatGPT.

Prompt:

Look for seasonal patterns in backlink acquisition.

If you’d prefer a heatmap like the one below, use this prompt instead:

Analyze patterns in link acquisition (e.g., weekdays vs. weekends, monthly trends) using line charts or heatmaps to identify when most backlinks are acquired.
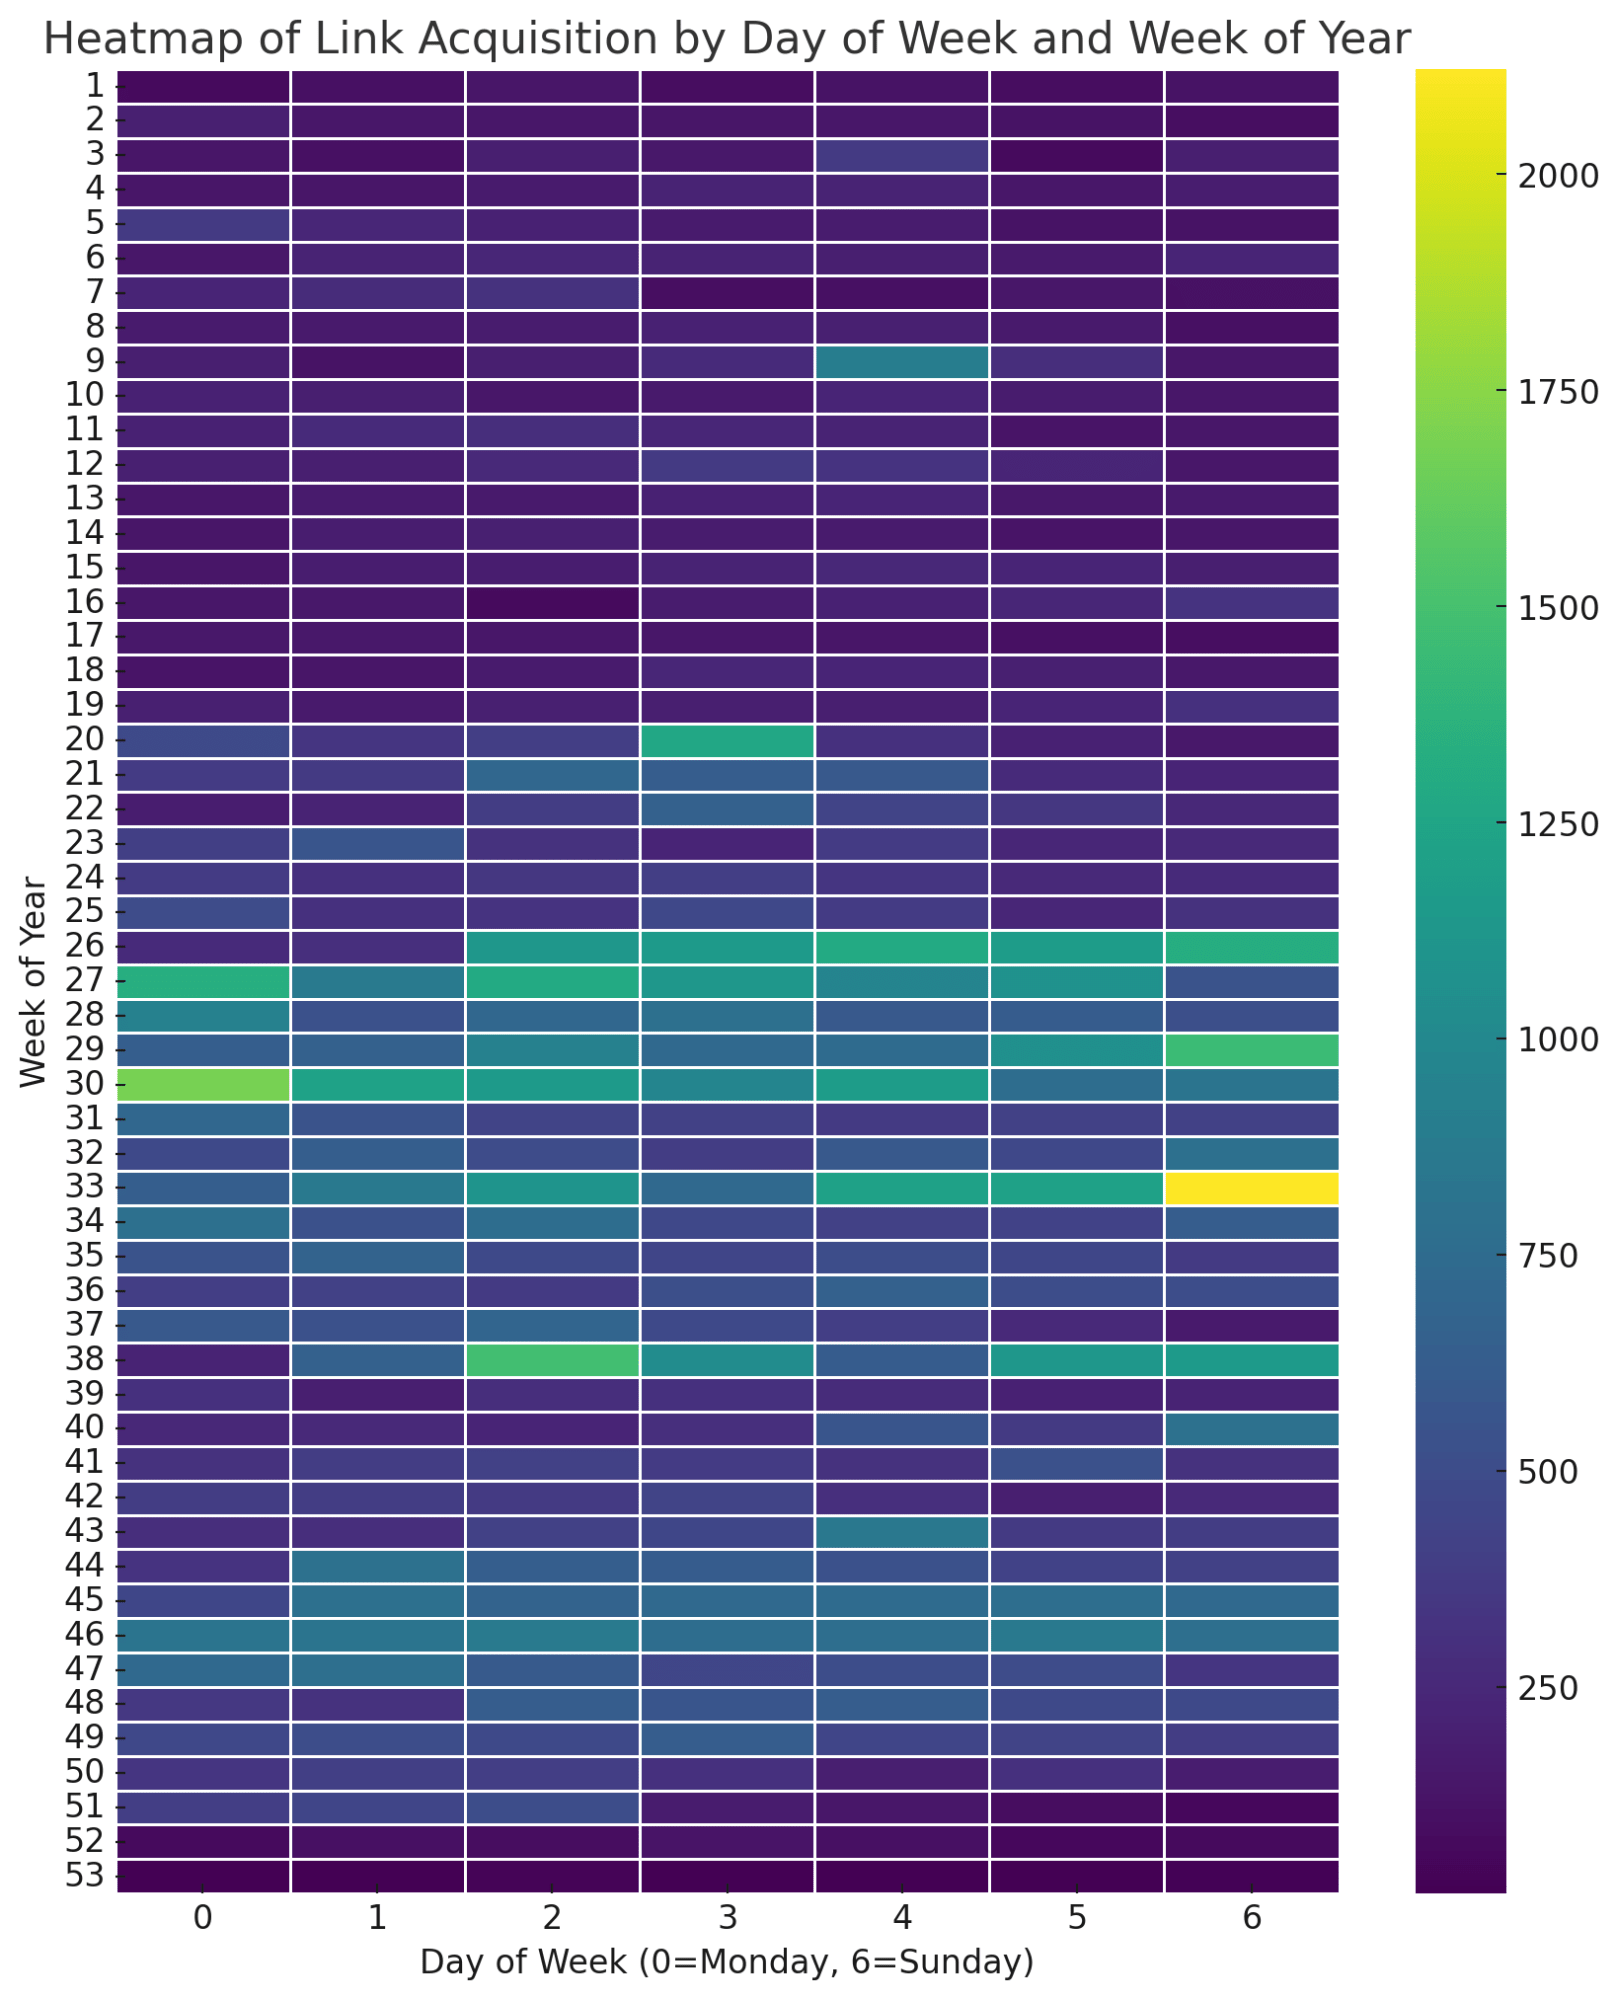
Heatmap showing days and weeks when the site got more linksHeatmap showing days and weeks when the site got more links

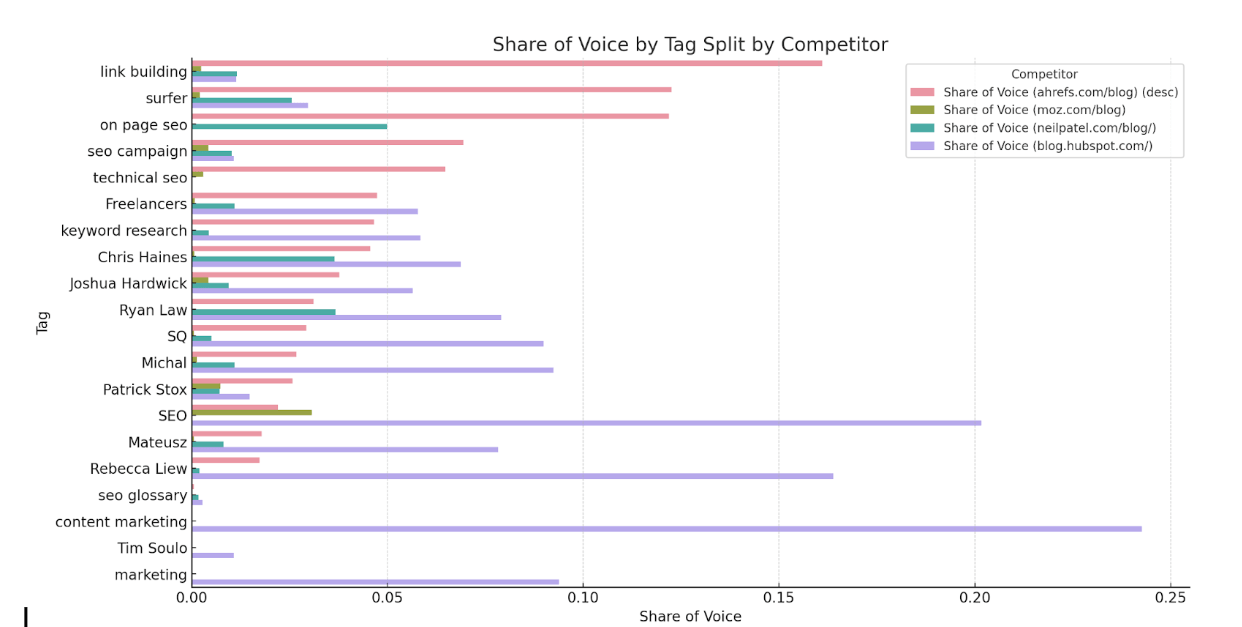
Share of voice for each tag group and measured against competitorsShare of voice for each tag group and measured against competitors

Use case:

See which tag groups are strong or weak vs competitors. I can quickly see we dominate for things like link building, but we’re weak for the terms in our general marketing bucket, probably because we mostly focus on SEO.

Data source:

Export the data from the Competitors – Tags report in Rank Tracker (use UTF-8 format).
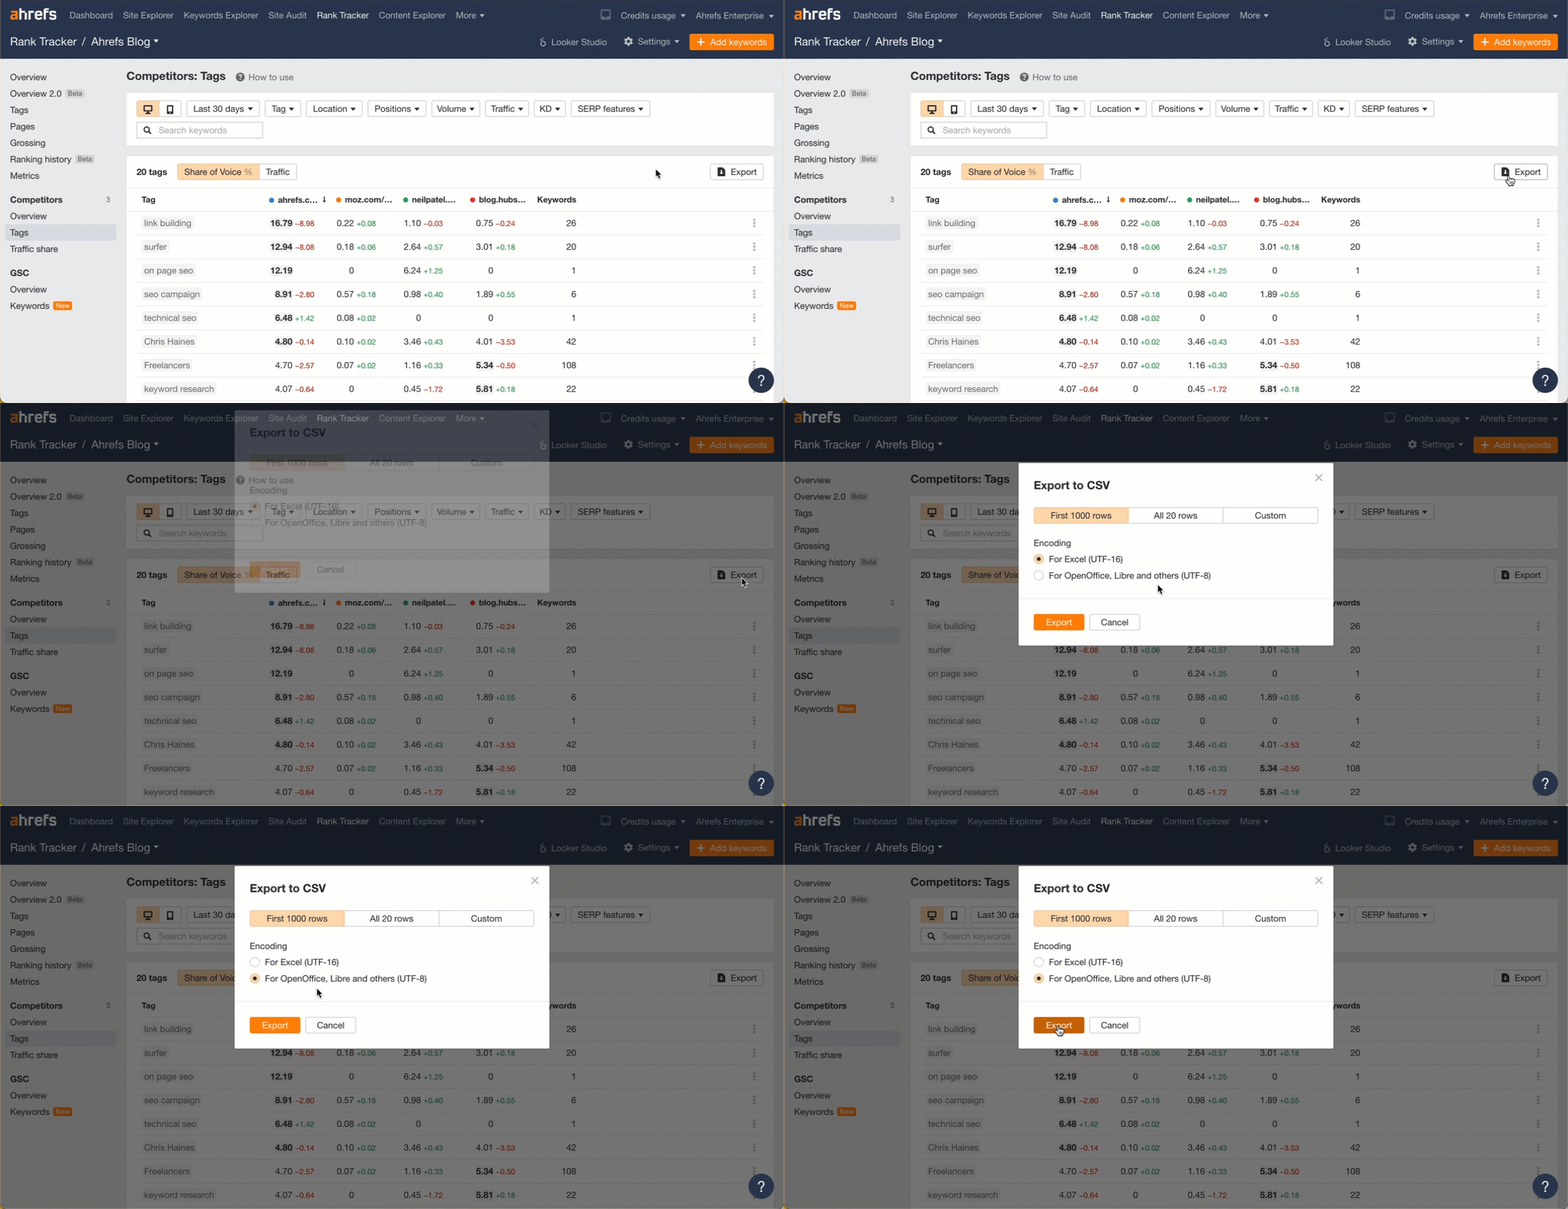
Exporting the data from AhrefsExporting the data from Ahrefs

Prompt:

Show me share of voice by tag and split it by competitor as well.
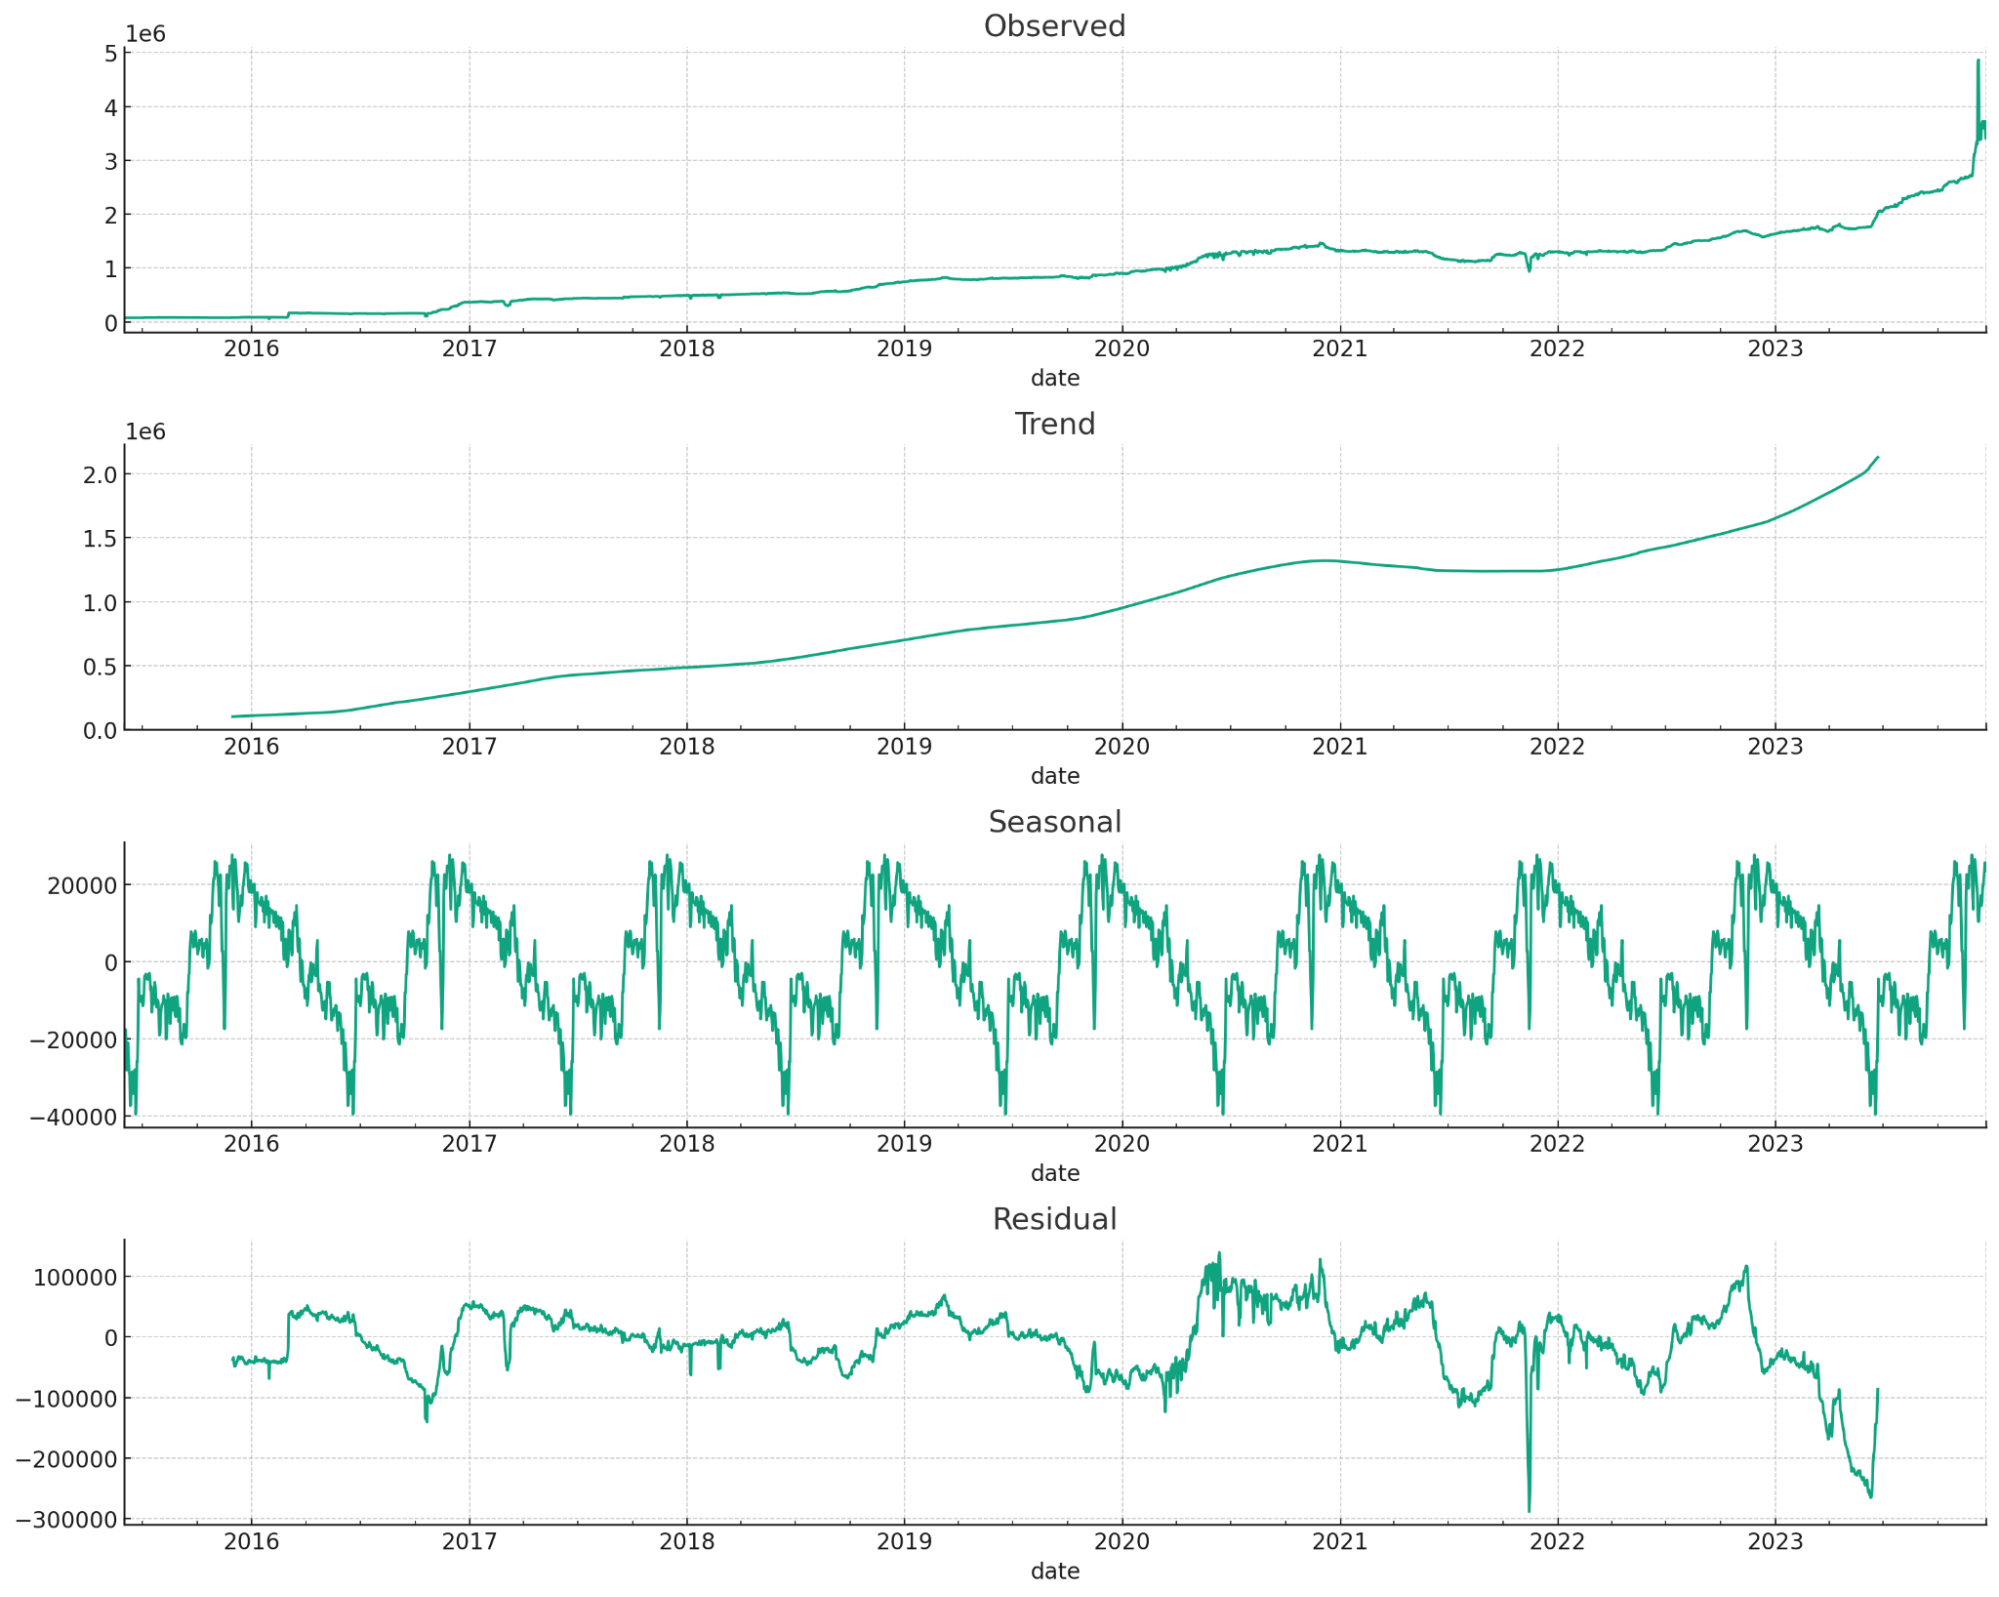
Forecasted time series data for organic trafficForecasted time series data for organic traffic

Use case:

Forecasting traffic or other metrics forward. This is great for getting buy-in.

Data source:

Export graph data from the Overview report in Site Explorer. You can choose any time-series graph you like (organic traffic, referring domains, etc.)
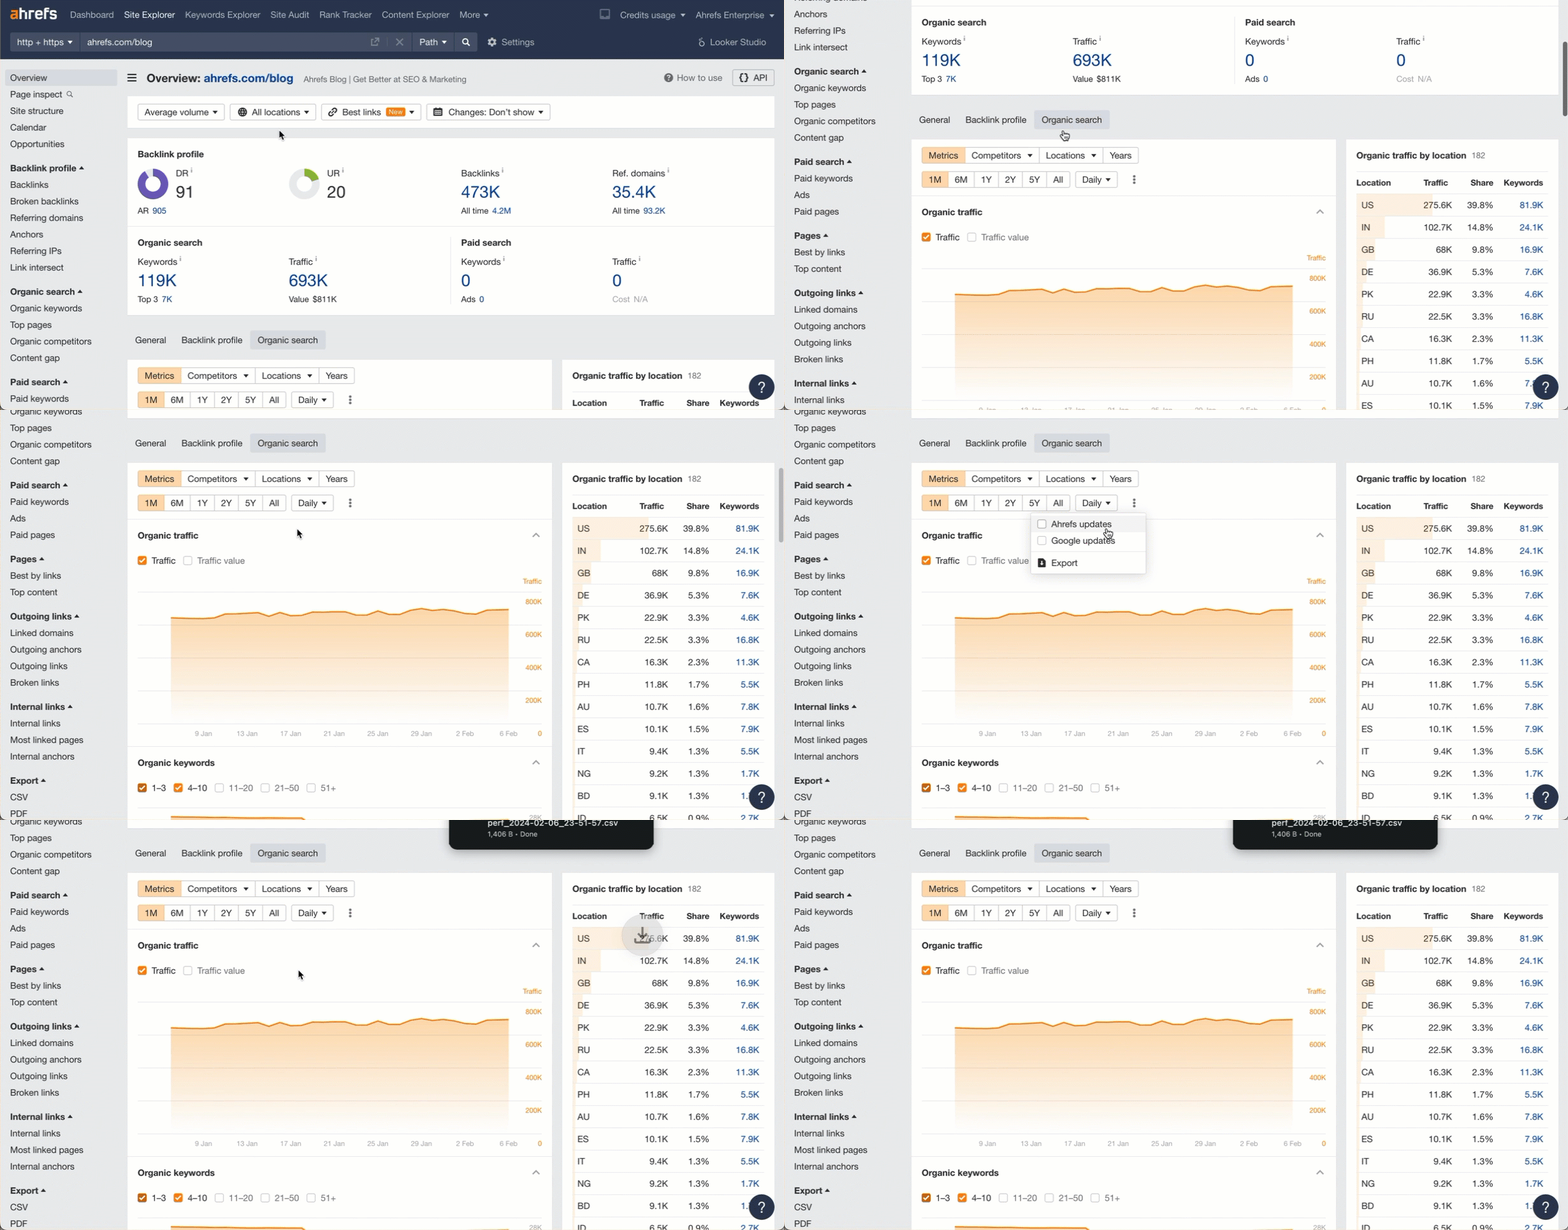
Exporting the data from AhrefsExporting the data from Ahrefs

Prompt:

Forecast this time series data forward one year
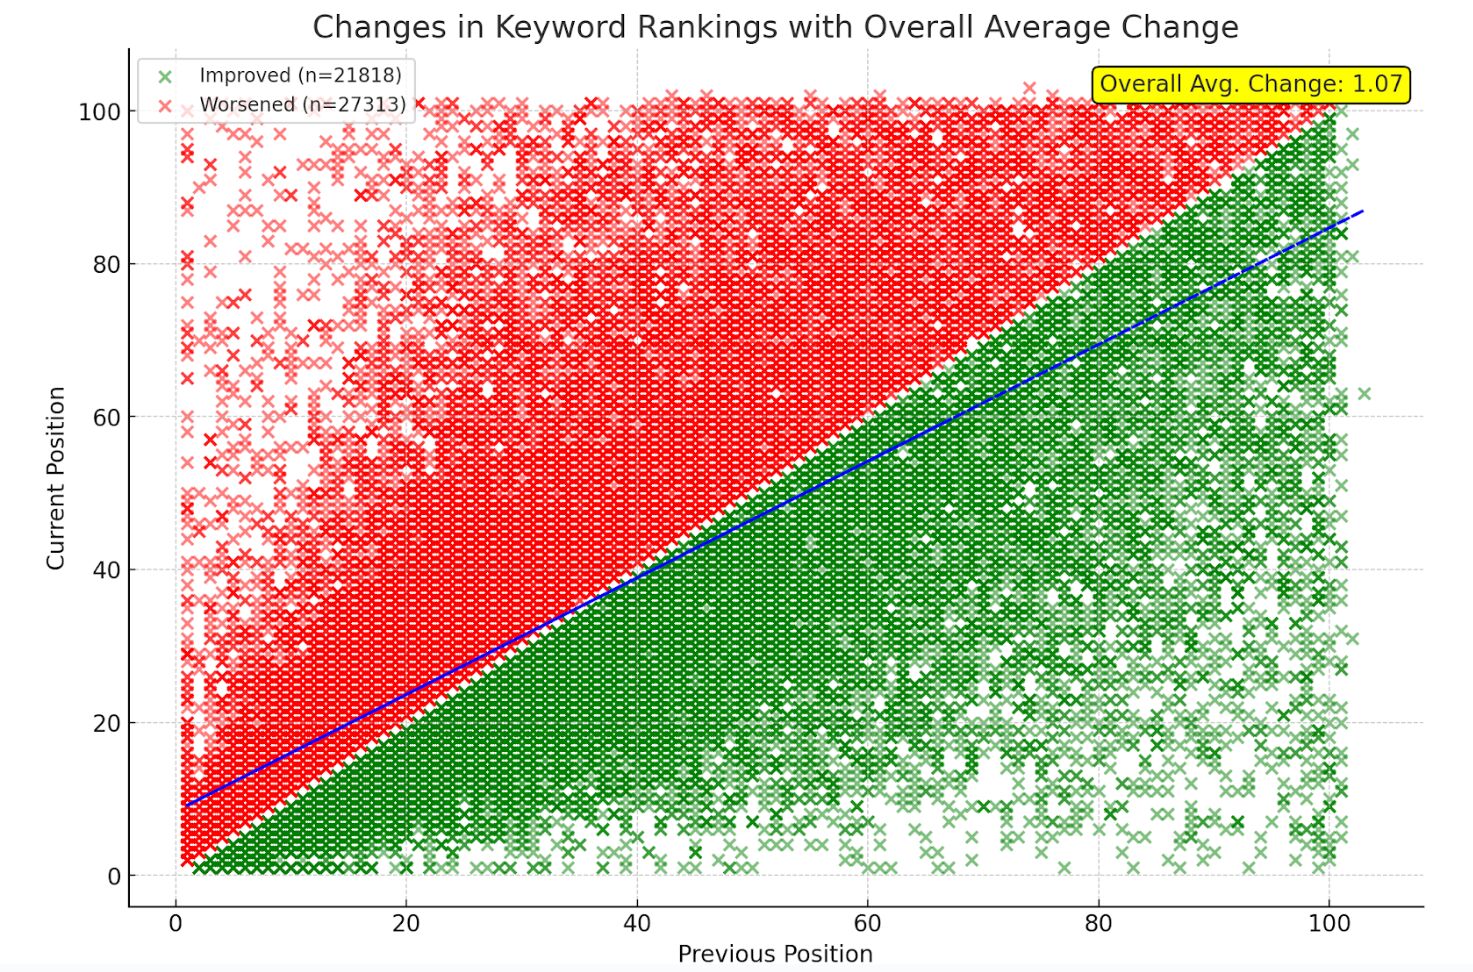
Changes in keyword rankings shown in a scatterplot with winners/losers separatedChanges in keyword rankings shown in a scatterplot with winners/losers separated

Long story short on this one. I had a version that wasn’t as good as what Marie Haynes came up with, but I added to her visualization to make it even better.

Use case:

The chart visualizes winners/losers for keyword rankings and shows me overall if I’m doing better or worse. From this image, I can see that more keywords overall are ranking worse, but overall rankings are up, so the positive ones moved up a lot more than the negative ones lost.

Data source:

Download your keyword rankings from the Organic Keywords report in Site Explorer and upload the file.

Prompt:

I used multiple prompts to get the final chart, but they might be able to be simplified into one.

Show me a scatter plot that shows the changes from the previous position and the current position. Include changes to a lower position as green and changes to a higher position as red. Include a legend and trendline.

Add a count for improved and worsened on the previous chart. Also show me on the chart on average, how much did rankings improve or decline

Remove the averages as they are. I want the overall average change in ranking position as one number.

Move the average to the right side of the chart so it’s readable
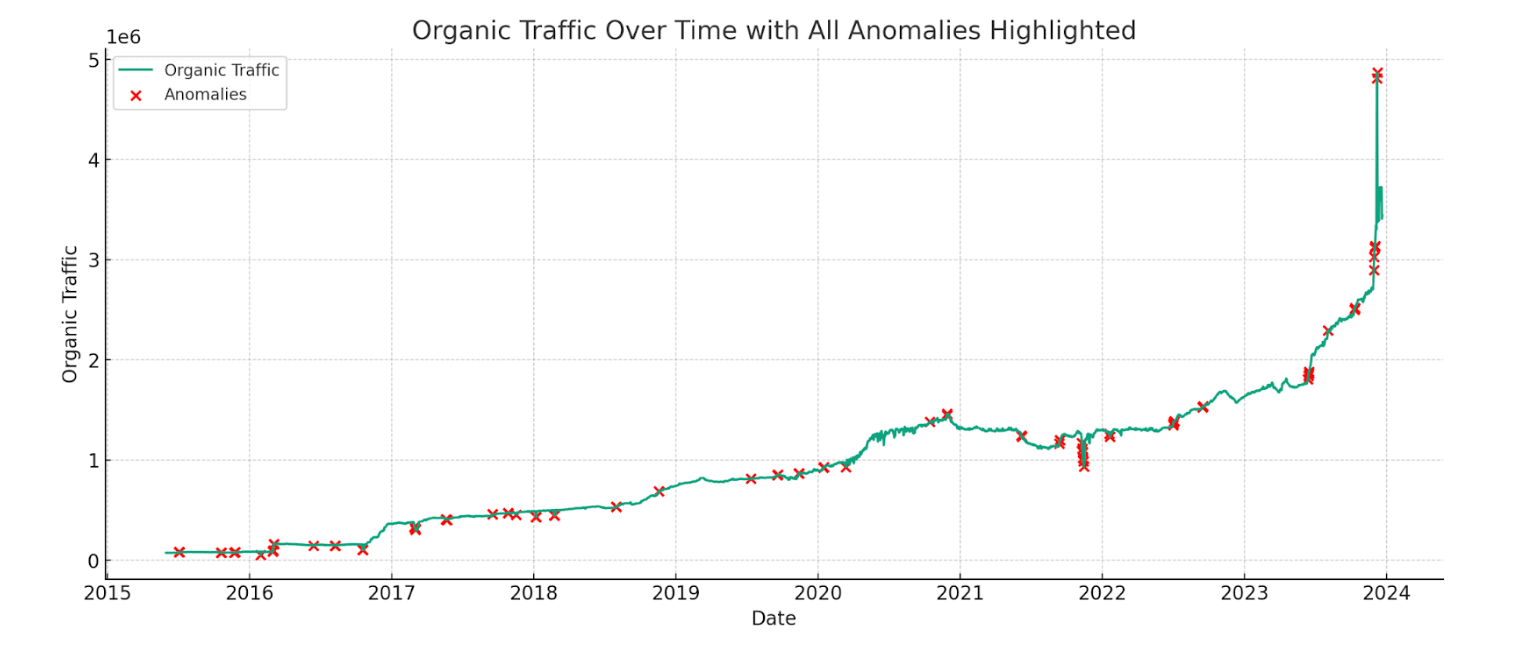
Anomalies in the traffic graph denoting major shifts such as algorithm updates or website changesAnomalies in the traffic graph denoting major shifts such as algorithm updates or website changes

Use case:

Find anomalies in time series data. In this case, most of the anomalies line up with major website changes and Google algorithm updates.

Data source:

Export organic traffic graph data from the Overview report in Site Explorer.
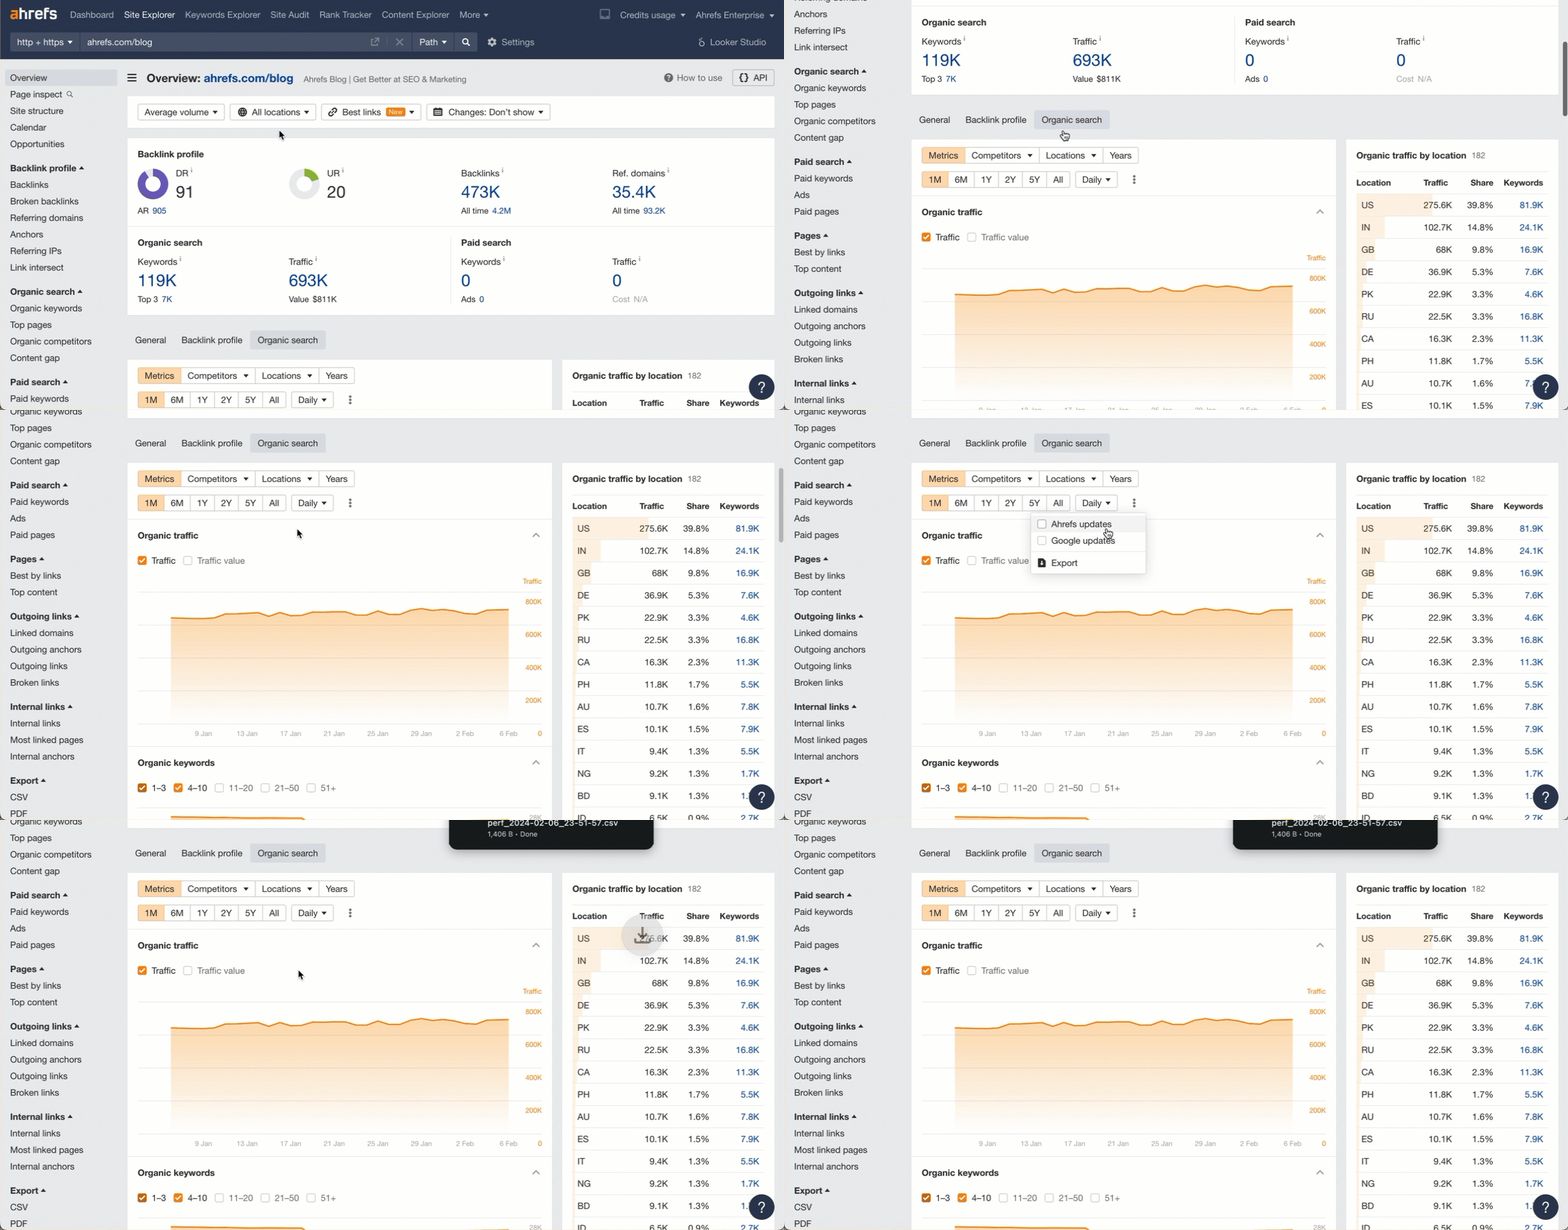
1707348373 914 How to Visualize Ahrefs Data with ChatGPT1707348373 914 How to Visualize Ahrefs Data with ChatGPT

Prompt:

Identify anomalies in this traffic chart
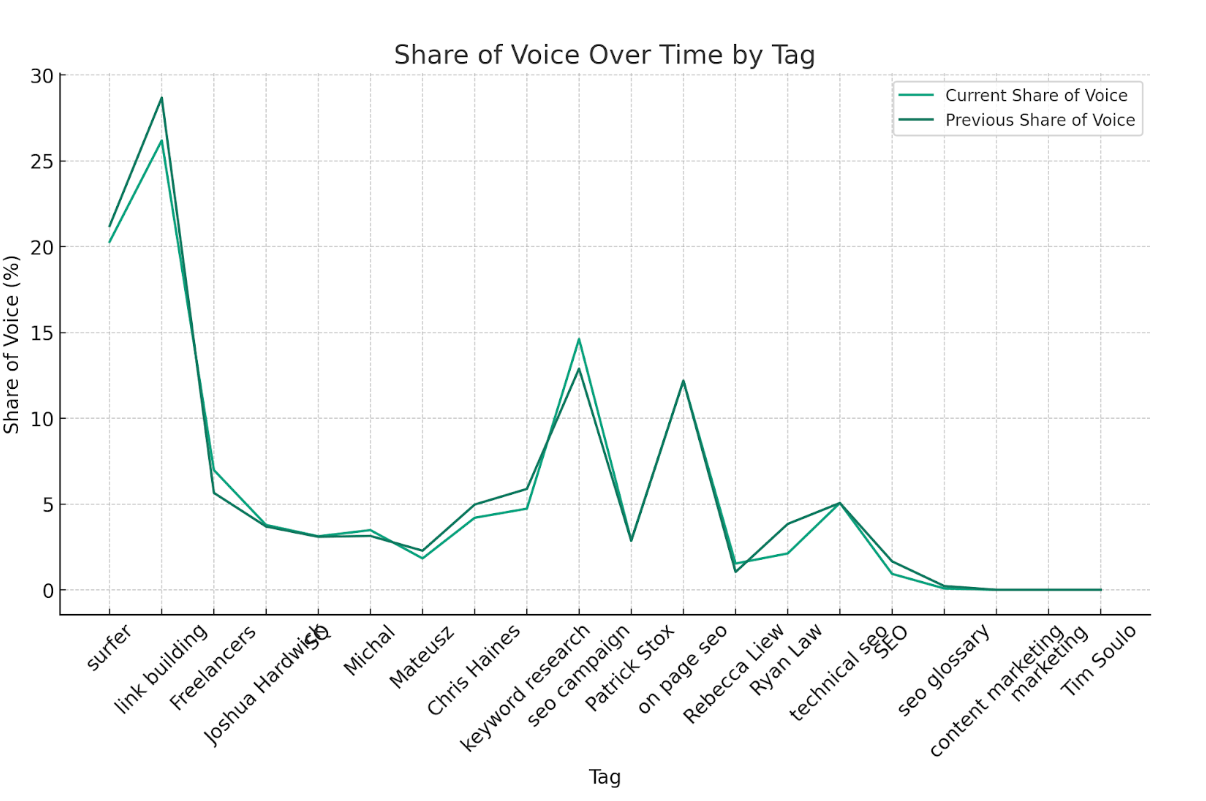
Share of voice between two time points for each tagged group of keywords

Use case:

This tells me if certain tagged groups are doing better or worse between the dates.

Data source:

Export data from the Tags report in Rank Tracker.
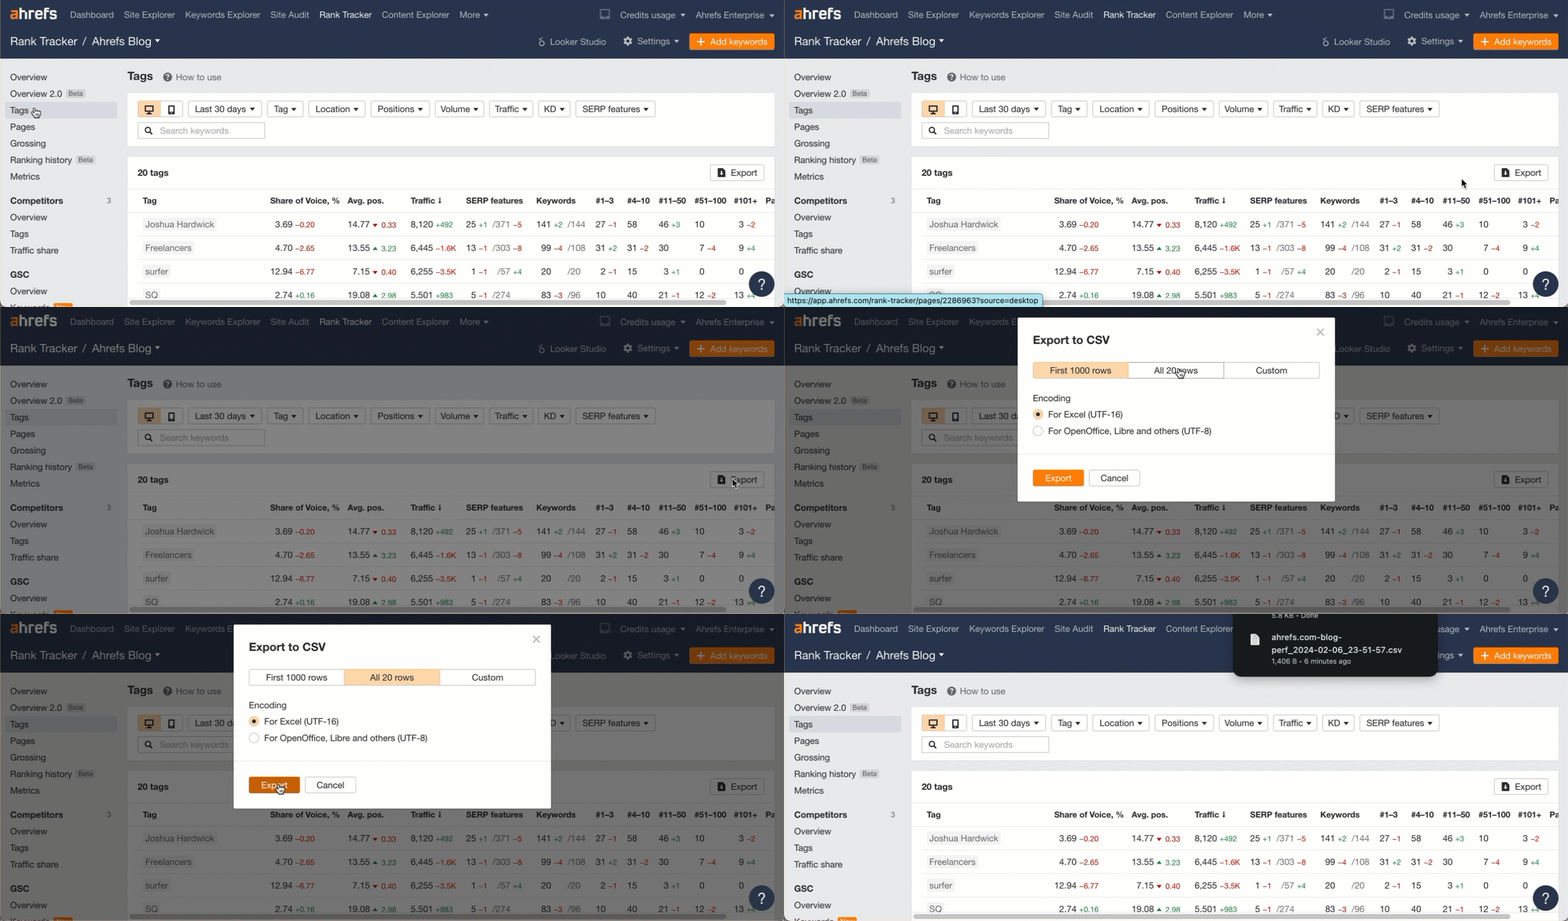
Exporting the data from AhrefsExporting the data from Ahrefs

Prompt:

Show me share of voice over time by tag.

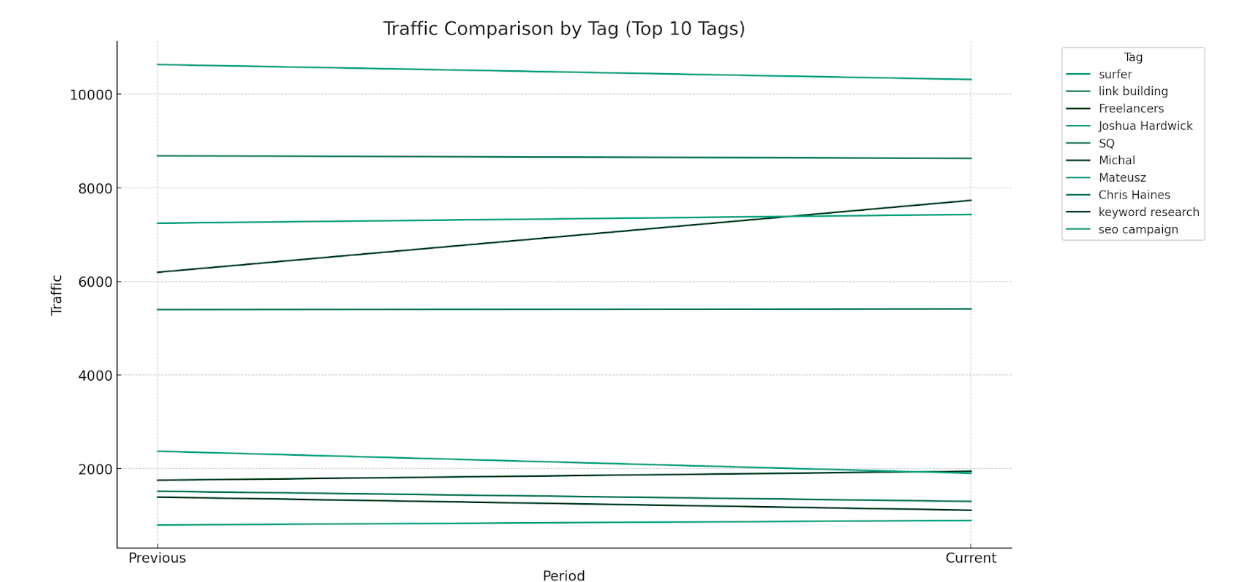
Traffic between two time points for each tagged group of keywordsTraffic between two time points for each tagged group of keywords

Use case:

See how traffic changed for each tag between two dates. We have a better view for this coming in Rank Tracker that will show the evolution over time.

Data source:

Like the previous one, export data from the Tags report in Rank Tracker.

Prompt:

Show me how traffic is evolving for each tag.
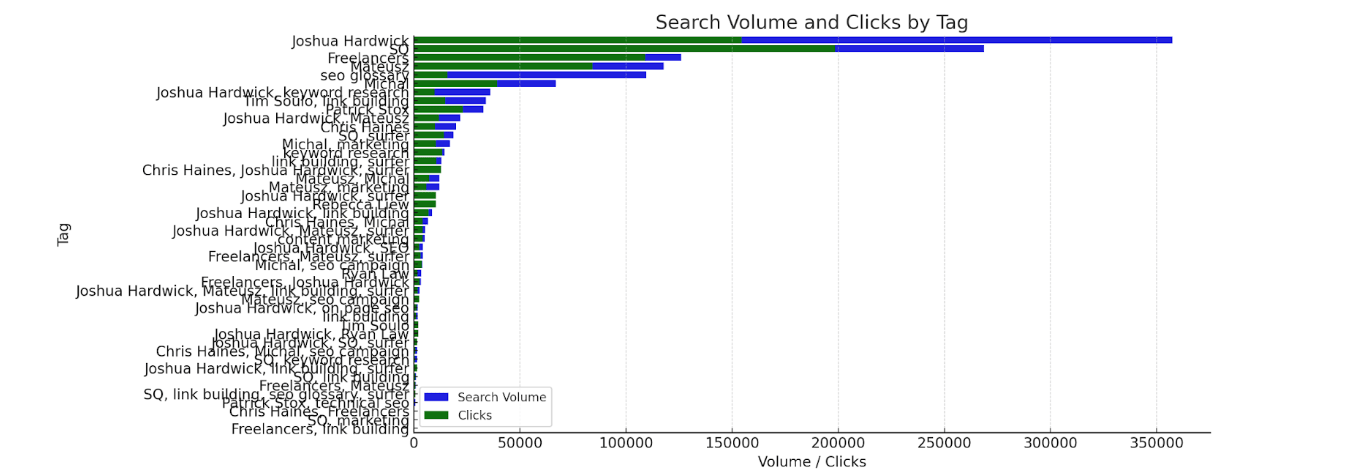
Search volume and clicks by tagSearch volume and clicks by tag

Use case:

See which groups of terms have the most volume vs the clicks that they’re getting. High total volume and low clicks means you have a lot to work on.

Data source:

Export keywords from the Overview report in Rank Tracker. (You can choose between desktop or mobile ranking data with the toggle).
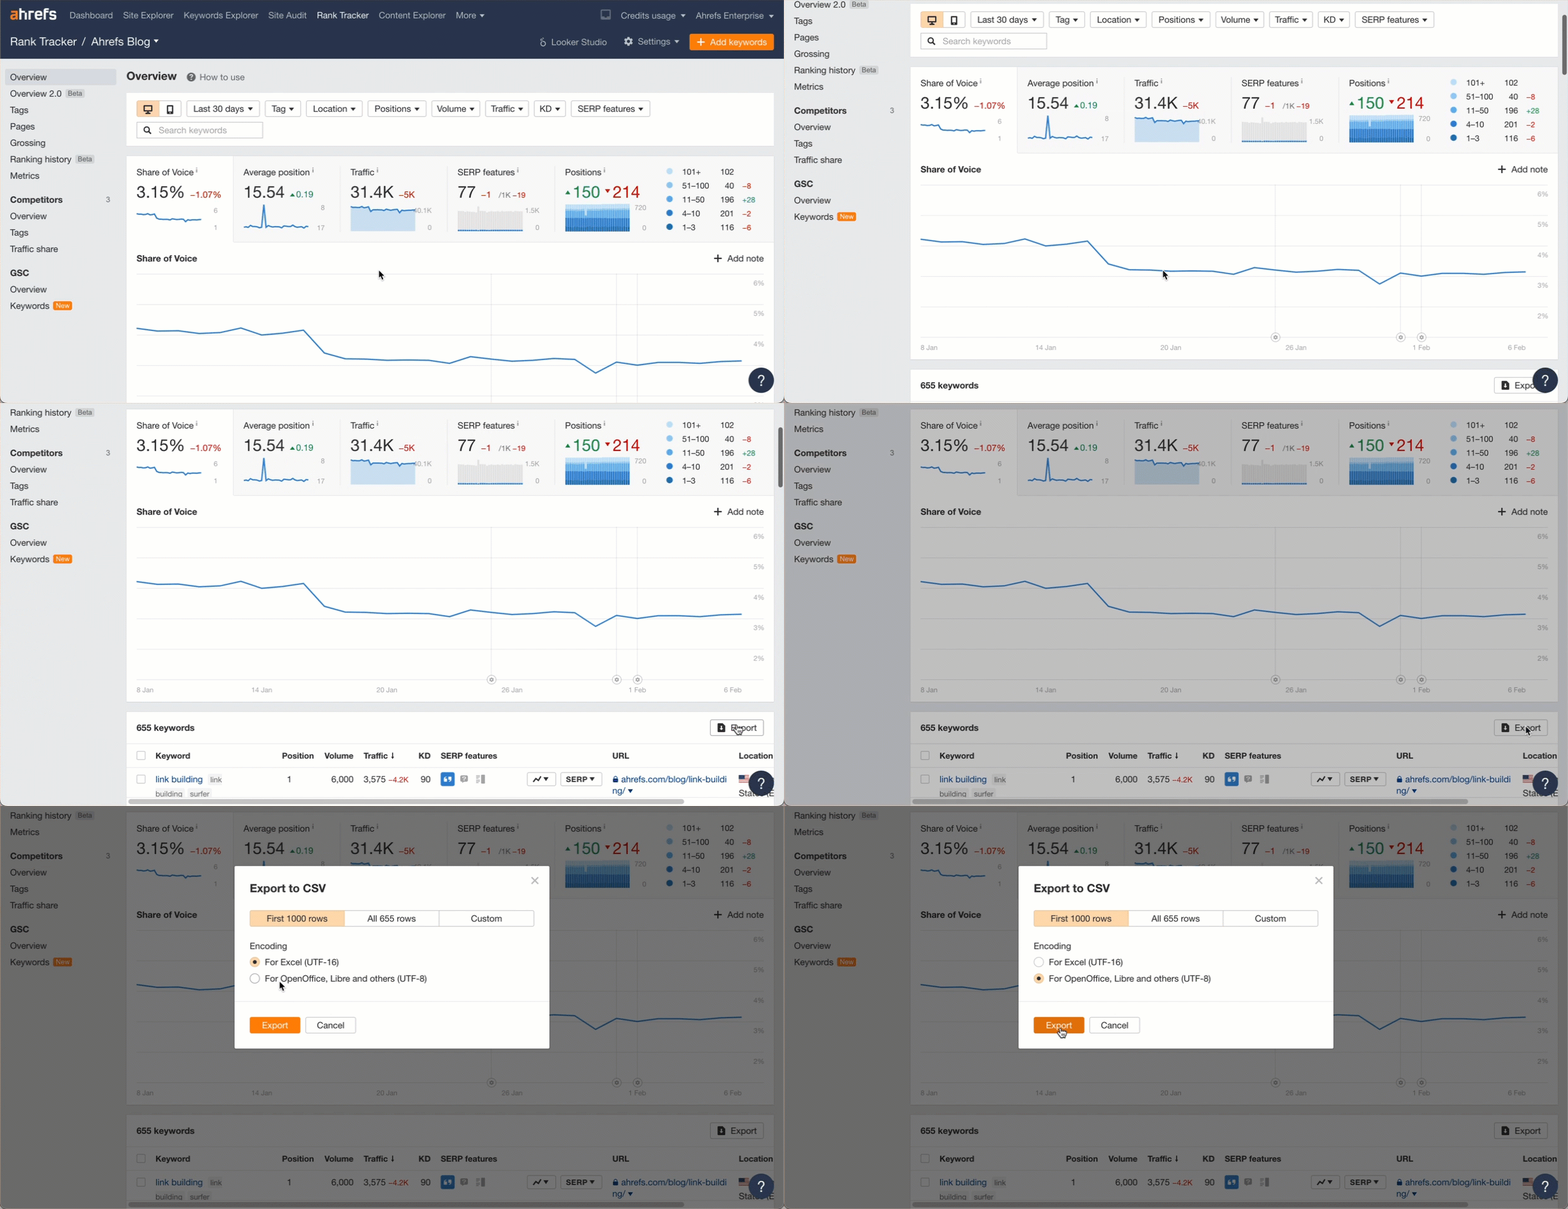
Exporting the data from AhrefsExporting the data from Ahrefs

Prompt:

Visualize search volume and clicks by tag.
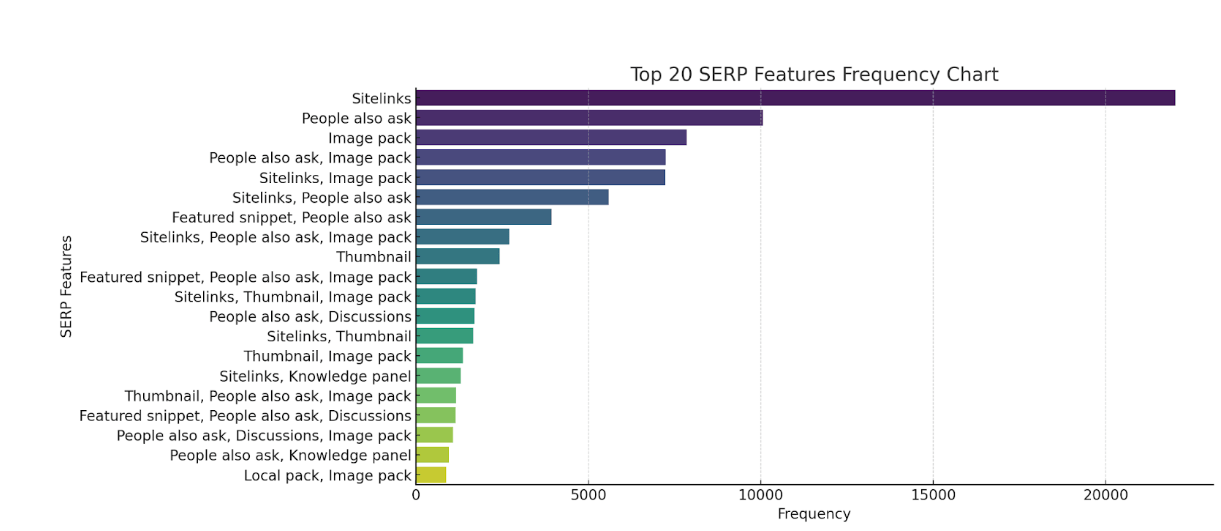
Most common SERP features for you and competitorsMost common SERP features for you and competitors

Use case:

Shows common SERP features for you and competitors that you may want to target. If certain schema markup is required but you’re not using it, it can lead to an easy win.

You may also have an issue with your schema markup. Ahrefs’ Site Audit validates against both schema.org and Google standards.
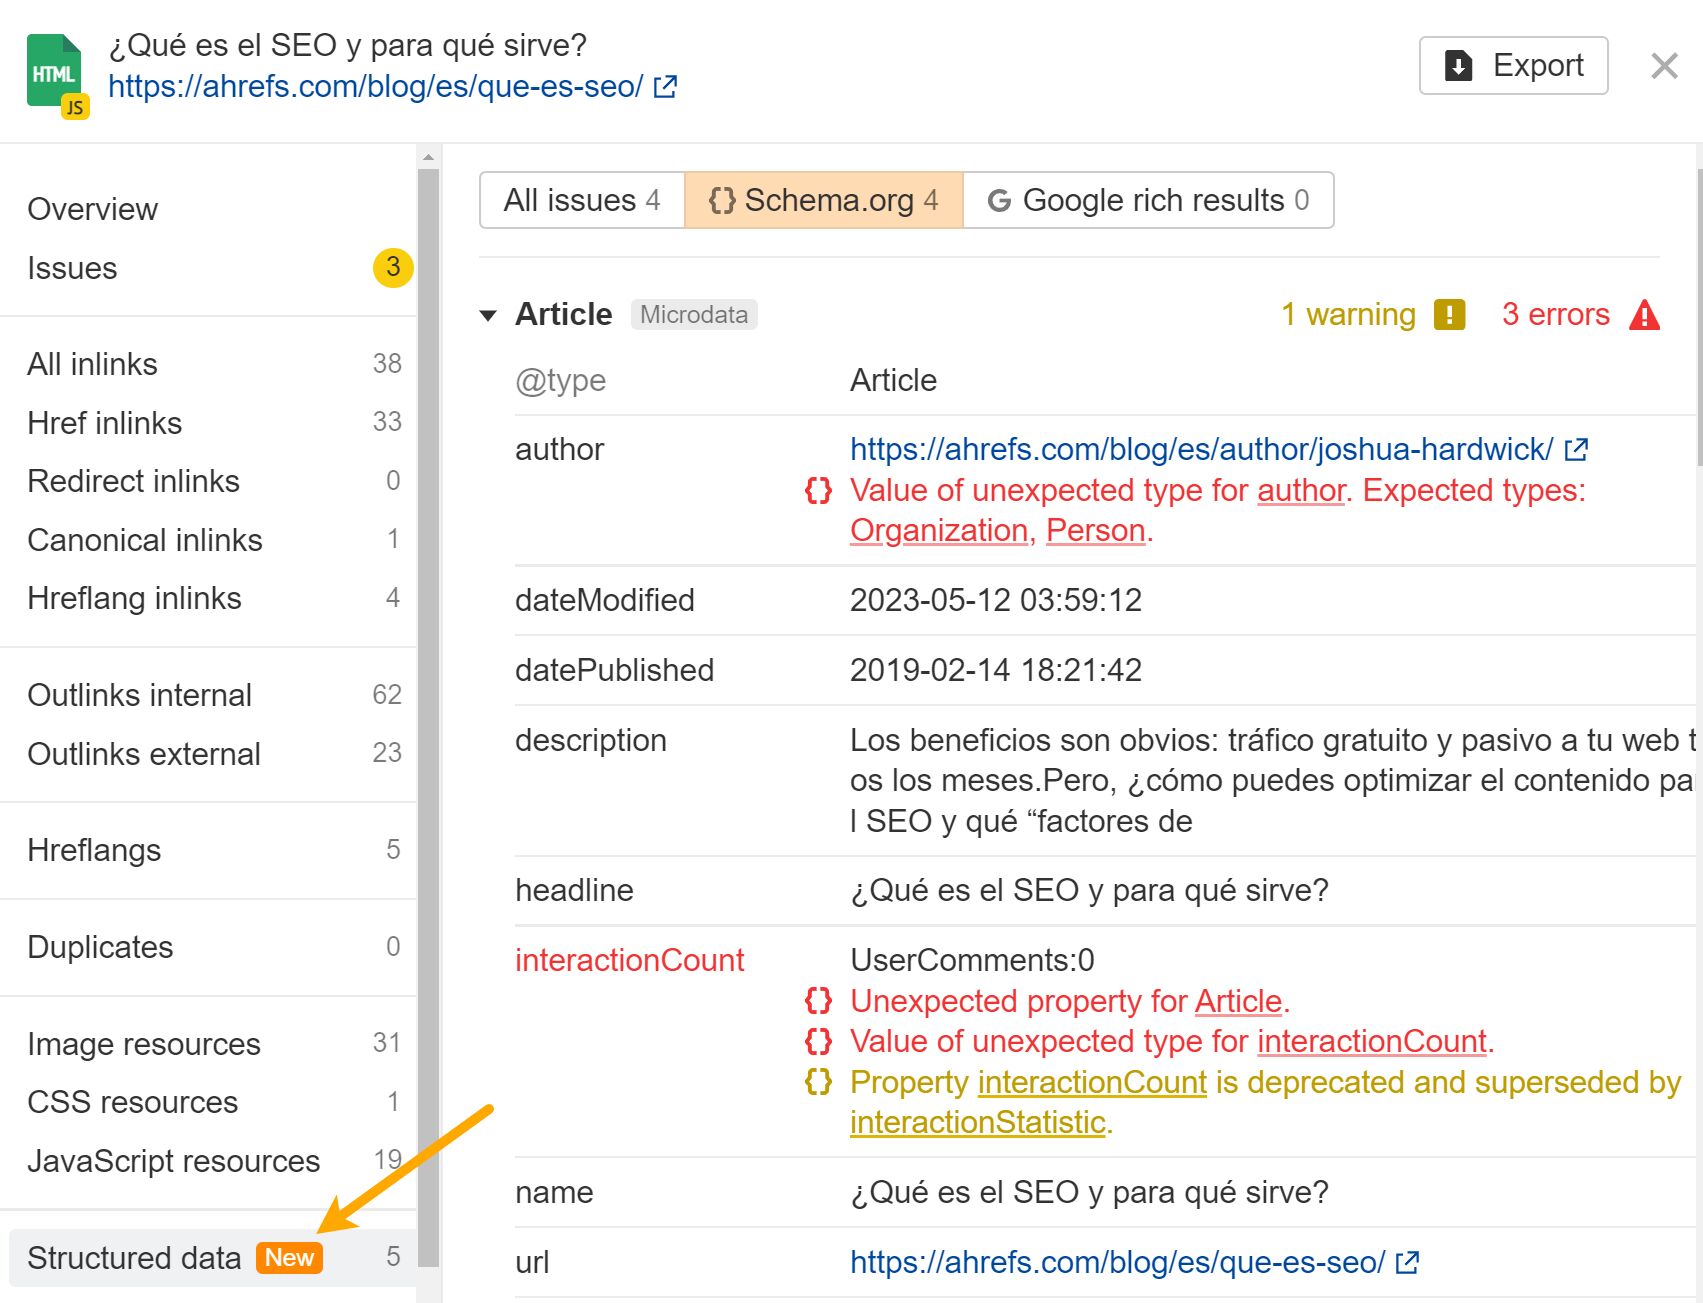
Structured data validation in Ahrefs' Site AuditStructured data validation in Ahrefs' Site Audit

Data source:

Export the data from the Content Gap report in our Competitive Analysis tool.
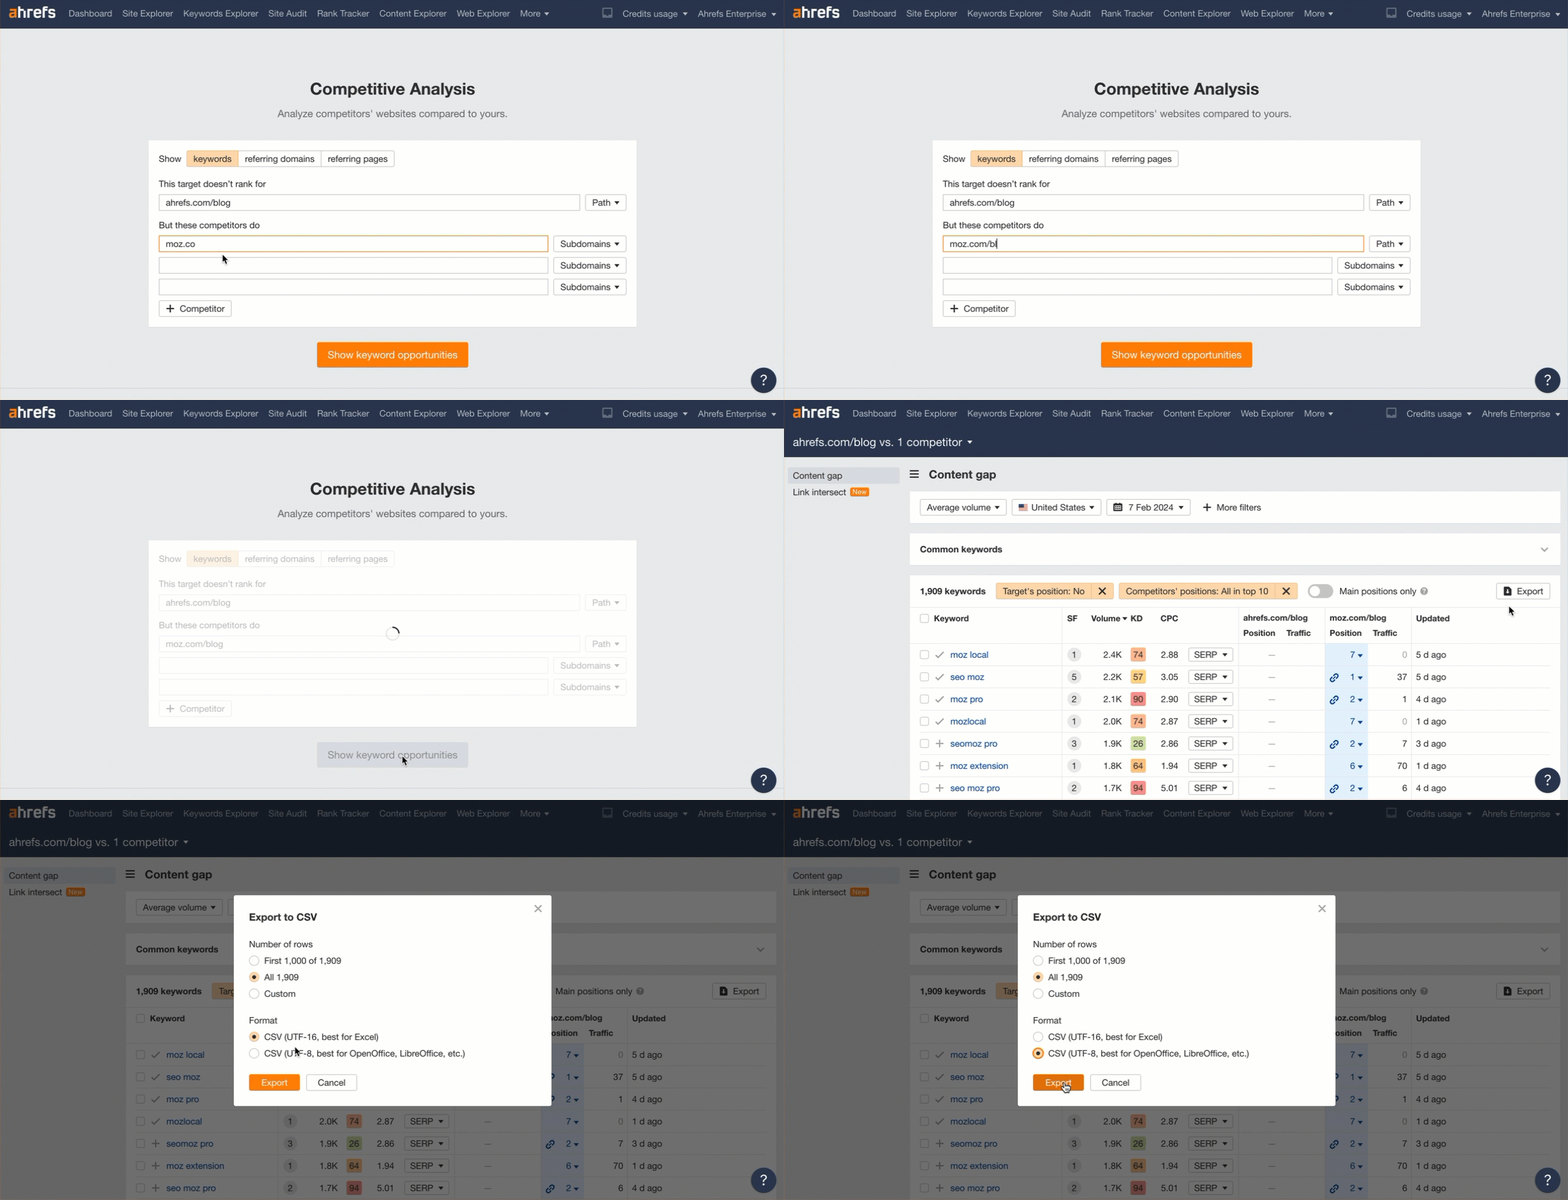
Exporting the data from AhrefsExporting the data from Ahrefs

Prompt:

Show me which SERP features are most common.

Sidenote.

I would probably adjust this prompt to split them out into individual features rather than feature groups.

Final thoughts

I hope this has sparked some ideas for other SEOs out there. I want to see what you all will create.

Have a cool idea you want to share? Let me know on X or LinkedIn.


Source link

Keep an eye on what we are doing
Be the first to get latest updates and exclusive content straight to your email inbox.
We promise not to spam you. You can unsubscribe at any time.
Invalid email address

SEO

Expert Tips To Maximize Website Performance

Published

on

By

Expert Tips To Maximize Website Performance

Wondering why your carefully crafted content isn’t climbing the search rankings? 

You might be overlooking a crucial piece of the puzzle: technical SEO. 

It’s easy to get lost in content optimization and on-page SEO, but the real game-changer lies behind the scenes. 

Technical SEO is basically the backbone of your website’s performance, ensuring that search engines can find, crawl, and index your pages effectively.

So if your site’s technical foundation hasn’t been a top priority, you could be missing out on major ranking opportunities. 

But it’s never too late to pivot – if you’re ready to start maximizing your web performance and outranking your competition, our upcoming webinar is one you won’t want to miss.  

Join us live on July 17, as we lay out an actionable framework for auditing and improving your technical SEO across four key pillars:

  1. Discoverability is all about how easily search engines can find your website and its pages.
  2. Crawlability ensures that search engine bots can navigate and access your site without any issues.
  3. Indexability means your pages can be stored in the search engine’s database and shown in search results.
  4. User Experience (UX) focuses on making sure your site is easy for visitors to navigate and enjoyable to use.

Our presenters Steven van Vessum, Director of Organic Marketing at Conductor and Alexandra Dristas, Principal Solutions Consultant at Conductor, will explore ways you can implement core technical SEO best practices.

You’ll also learn which to prioritize based on impact, as well as how to maintain these improvements moving forward.

In this webinar, we’ll cover the following topics: 

  • Optimizing for Discoverability: Learn how creating a clear sitemap and well-organized site architecture helps search engines find and index your pages efficiently.
  • Improving Crawl Budget: Ensure search engine bots focus on valuable pages rather than getting stuck in loops or wasting resources on low-priority content. 
  • Leveraging Schema and Headings: How using Schema markup and optimizing your heading structure can help improve indexability in search results.
  • Core Web Vitals and Accessibility: Discover best practices to provide a seamless and satisfying experience for all visitors.
  • Monitoring Technical SEO: Learn the top tools and processes to continuously identify and fix technical issues, maintaining optimal site performance.

Don’t miss this opportunity to elevate your technical SEO strategy and boost your search visibility. 

Plus, if you stick around after the presentation, Steven and Alexandra will be answering questions live in our Q&A session. 

Sign up now and get the expert insights you need to rank higher on SERPs.

Source link

Keep an eye on what we are doing
Be the first to get latest updates and exclusive content straight to your email inbox.
We promise not to spam you. You can unsubscribe at any time.
Invalid email address
Continue Reading

SEO

10 Lessons From 10K Downloads of Ahrefs Podcast

Published

on

10 Lessons From 10K Downloads of Ahrefs Podcast

We’ve recently crossed 10k downloads for Ahrefs Podcast. And, to be honest with you, I thought this 10k would come easier.

I mean, Ahrefs is a fairly mature brand in the SEO industry, and most of our channels are measured in millions:

So when we reached that 10k milestone I felt both happy about it, and upset about the number being so low. It was kinda like the “3rd Place Celebration Meme” situation (which I thought would be very fitting to re-create for the occasion):

My main takeaway: getting a podcast off the ground is very, very hard.

It doesn’t compound in the way SEO does and the format of “Zoom interviews” doesn’t perform very well on YouTube.

So if you were thinking of launching a podcast, I can give you 10 compelling reasons why you shouldn’t do it:

I’ve noticed that too many people treat podcasts as “easy content”—get on a call, record, publish. Done!

Well… for us at Ahrefs, the actual interview is maybe 40% of work.

Inviting guests, scheduling time with them, doing decent research, creating an engaging introduction, designing a thumbnail for YouTube, transcribing, adding timecodes, writing titles and descriptions, uploading to a bunch of podcasting platforms, cutting out snippets for promotion, writing copy for those snippets…

Running a podcast is A LOT of work (if you want to create a quality show, of course).

I can’t imagine doing Ahrefs Podcast alone. It’s a team effort from quite a few people:

  • Michelle (our community manager) is doing most of the heavy lifting in terms of researching guests, editing the recording, and managing the whole process end-to-end.
  • George and Nikita are the ones producing those cool intros.
  • Sergey is designing thumbnails for YouTube.
  • Helen is helping with uploads.

Yes, you can cut corners here and there. But you risk compromising the quality. And a low-quality show will make all your promotional efforts a lot less effective.

Before starting Ahrefs Podcast I did probably over a hundred interviews on other people’s podcasts. And I can tell you that being a host is much harder than being a guest. The pressure to make the interview interesting is entirely on you, not the guest.

The guest is mostly in a “reactive” mode—they just need to answer whatever is thrown at you. But the interviewer is the one ultimately responsible for the success of an interview. You have to stay sharp throughout, ask interesting questions, and know where to dig deeper (and when to change subject).

Too many podcast hosts like to cut corners here and just default to asking every guest the same set of generic questions, without trying dig a little deeper into the answers they get.

I love how Ryan Holiday described it:

“They’ll ask you a question, you’ll give an answer and then you can almost hear their eyes scan the paper they have in front of them as they move on the next question on the list.

It’s disrespectful to the guest, but that’s not my real problem with it. My problem is that it makes for really boring audio. Who wants to listen to someone literally phone something in? Why should you listen to a conversation that the host isn’t even listening to?”

Ryan HolidayRyan Holiday

You might disagree with me on this one, because there are definitely some good short podcasts out there.

But when I tried interviewing my guests for one hour, I realized that it was not enough to squeeze some really good information out of them. Especially when your guest is very talkative and they like to digress—that can easily throw your entire interview plan off the rails.

But getting people to commit to speaking with you for two hours is a big ask. Many high profile people won’t bite unless your podcast is really well known.

And once you do get someone to spend two hours with you, staying sharp and alert for this long without a break can be quite challenging at times.

Some people think that landing a big name is all they need to get their podcast off the ground, and that will automatically guarantee views. No, it won’t.

If you search around on YouTube, you’ll find many podcasters who interviewed all the big names in the digital marketing space. And yet the views on these episodes are mostly in double digits.

But my biggest gripe is people who demand that their guests help them promote the interview. Once the episode is published, they follow up with a guest, asking them to “please share it with your audience.”

Sorry, but no.

I did five podcast interviews this month, and they were all nearly the same. And if I were to share each one of them on my social channels, I would only irritate my audience. And besides, most social networks don’t really like it when you post links, so the engagement and reach on these kinds of posts is super low.

If your only promotion strategy for the podcast is “my guests will help promote it”—I have bad news for you. They won’t.

Take any “big” guest that’s on your mind and go search for their existing podcast interviews. They probably did a few dozen of them just this year. So why would anyone be interested in YOUR interview with that person?

There are only two reasons:

  1. You’re an interesting person yourself, so folks would listen to you even if it was a solo podcast.
  2. You’re very good at promoting (more on that later).

Looking at my own habits, 80% of podcast interviews I listen to are by hosts I already know and respect: Nathan Barry, Eric Siu, Dave Gerhardt, Kipp Bodnar & Kieran Flanagan, etc. Only 20% are by hosts I haven’t heard of before, but they promoted the episode well enough to get on my radar.

Podcasting is a pretty ineffective way to grow your own audience and popularity. But, on the contrary, it’s a pretty good way to leverage whatever existing audience and popularity you already have.

I imagine your end goal is growing your business. That means you need to grow your sales. Which means you have to pursue the most high-converting marketing tactics available.

Well… a podcast is not one of them.

During my two-hour-long conversations with my guests, there’s actually very little opportunity to squeeze in some kind of Ahrefs sales pitch. I try to mention relevant use cases where it fits the conversation, but there were quite a few episodes where our product didn’t get any shoutout at all.

A podcast is a great tool for branding and building trust with your target audience. But I’m not expecting any sales to come from the episodes that we’ve published so far.

If you need sales, you’d be better off sponsoring some relevant podcasts in your niche (but even then, we tried it and didn’t see many sales from it). It’s a great way to raise awareness, but not make any immediate sales.

Each episode should be focused on your guest and THEIR business. I mean… you didn’t invite some high-profile person on a call to just talk about yourself for a couple hours, right?

And besides, if you want the episode to land, you have to focus on making your guest look good. Your listeners are here to learn from your guest, and you have to make sure they’ll learn plenty.

In my own interviews, I try to dig really deep into my guests’ businesses and careers. I’m genuinely interested in what they do, why they do it, and how they do it. The entire conversation is all about them.

As a result, my guests have plenty of room to promote themselves and their business without feeling salesy. That’s one of the main reasons why they agree to be interviewed in the first place: they want to tap into my audience and promote their thing.

So if your goal is to promote your own thing—you need to be a podcast guest, not a podcast host.

Compare podcasts to SEO. An article you published 10 years ago can still bring you visitors (and sales) today. But as soon as you stop publishing new episodes of your podcast… everyone will forget about it.

We just crossed a measly 10,000 downloads. It took us 3 months, 10 episodes, and a TON of promotion to get there. And Ahrefs already has a pretty big audience. If I were starting from a blank slate, I would have barely reached 1,000 downloads by now.

Why is it so hard to promote? Well, we basically discussed most of the reasons above:

  • SEO doesn’t work for podcasts.
  • “Zoom interviews” don’t fly on YouTube.
  • Your guests are rarely keen to help you promote it.
  • Podcasting platforms don’t have a good “discovery engine”.

In other words, without an existing audience to tap into, it’ll take you a lot longer than three months to reach 10k downloads.

10 Lessons From 10K Downloads of Ahrefs Podcast10 Lessons From 10K Downloads of Ahrefs Podcast

So there’s that.

“But Tim… if podcasting is so troublesome, why are you doing it?”

Well… I didn’t say that podcasting was completely useless and totally not worth it. I merely shared 10 reasons why you should think twice before getting into it.

There’s obviously the other side of the coin. I’ll share my 10 reasons why YOU SHOULD start a podcast once we reach the 50k milestone. Stay tuned! 😉

Source link

Keep an eye on what we are doing
Be the first to get latest updates and exclusive content straight to your email inbox.
We promise not to spam you. You can unsubscribe at any time.
Invalid email address
Continue Reading

SEO

Understanding Bounce Rate & How to Audit It

Published

on

By

Understanding Bounce Rate & How to Audit It

Many people talk about how important it is to have a “low bounce rate.”

But bounce rate is one of the most misunderstood metrics in SEO and digital marketing.

This article will explore the complexities of bounce rate and why it’s not as straightforward as you might think.

You’ll also learn how to analyze your bounce using Google Analytics 4 exploration reports.

In order to understand what bounce rate is, we need to define what engaged sessions are according to GA4.

What Is An Engaged Session?

An engaged session in GA4 is a session which meets either of the following criteria:

  • Lasts at least 10 seconds.
  • Has key event (formerly conversions).
  • Has at least two screen views (or pageviews).

Simply put, if a user lands on your homepage and leaves without converting (key event), that would produce a 100 percent bounce rate for that session.

If one lands and visits a second page or signs up for your newsletter (as you defined it as a key event), that would mean the bounce rate for that session is 0%.

What Is Bounce Rate In Google Analytics?

Bounce rate is a percentage of unengaged sessions, and it is calculated with the following formula:

(total sessions/unengaged sessions)*100.

So, it’s not only visiting a second page that brings the bounce rate down but also when key events occur.

You can set up any event, either built-in or custom-defined in Google Analytics 4 (GA4), to count as a key event (formerly conversion), and in cases when it occurs during the session, it will be counted as a non-bounce visit.

Here is how to define any event as a key event:

  • Navigate to Admin.
  • Under Data display, navigate to Events.
  • Find the event you are interested in and toggle Mark as key event to turn it blue.
How to mark events as key events in GA.

How To Change The Default Engaged Session Timer In GA4

As a marketer, you may want to adjust the default 10-second timer for engaged sessions based on your project needs.

For example, if you have a blog article, you may want to set the timer as high as 20 seconds, but if you have a product page where users typically take more time to explore details, you might increase the timer to 30 seconds to better reflect user engagement.

To change:

  • Navigate to Data streams and click on the stream.
  • In the slide popup, navigate to Configure tag settings.
  • In the second slide popup, click Show more at the bottom.
  • Click on the Adjust session timeout setting.
  • Change Adjust timer for engaged sessions to the value of your choice.

Here is the detailed video guide on how to adjust the timer for engaged sessions:

What Is A Good Bounce Rate?

So, it’s not as straightforward as saying, “Example.com has a bounce rate of 43 percent, and example2.com has a bounce rate of 20 percent; therefore, example2.com performs better.”

For example, if you search [what’s on at the cinema…], then land on a website and have to dig through five pages of the site to find what’s showing, the website might have a low bounce rate but will have a poor user experience.

In this case, that’s misleading if you consider a low bounce rate good.

On top of that, what use is there in measuring the bounce rate for the whole website when you have lots of different templates that are laid out and designed in different ways, and you track ‘key events,’ aka conversions, differently?

In most cases, this shows that your marketing is effective and well-targeted, and visitors are engaging with your content and wanting to know more.

Remember, bounce rate is not a ranking factor, but when users navigate deeper into your pages, it is an engagement ranking signal that Google may take into account, according to what Google’s Pandu Nayak said during hearings.

That said, it may make sense to track the number of sessions with two or more pageviews in GA4, which you may want to consider as a KPI when reporting.

How To Set Up A Custom Audience With Multiple Pageviews Per Session

If you want to know how many visitors you have who have more than two page views in a session, you can easily set it up in GA4.

To do that:

  • Navigate to Admin.
  • Under Data display, navigate to Audiences.
  • Click the New Audience blue button on the top right corner.
  • Click Create custom audience.
  • Set up a name for your audience.
  • Select scope to “Within the same session.”
  • Select session_start.
  • Click And and select “page_views” with the parameter with “Event count” greater than one.

You simply tell it to add to my audience all users who viewed more than two pages within the same session. Here is a quick video guide on how to do that.

You can set up audiences with any granularity, like sessions with exactly two or three pageviews and greater than three pageviews.

Later, you can filter your standard reports using your custom audiences.

How To Do Bounce Rate Reporting And Audit

Next time your boss or client asks you, “Why is my bounce rate so high?” – first, send them this article.

Second, conduct an in-depth bounce rate audit to understand what’s going on.

Here’s how I do it.

Bounce Rate by Date Range

Look at bounce rates on your website for a particular period. This is the most simple reporting on bounce rate.

To do that:

  • Navigate to Explorations on the right-side menu.
  • Click ‘Blank’ report.
  • From Metrics choose “Bounce rate.”
  • Set Values to a “Bounce rate.”
  • Under Settings (2nd column), choose visualization type “Line chart.”
  • Select the date period of your choice.
How to set up a bounce rate report for the entire website by date range.How to set up a bounce rate report for the entire website by date range.

If you see spikes in the chart, it may indicate a change you made to the website that influenced the bounce rate.

How To Analyze Bounce Rate On A Page Level

When running a lead generation campaign on many different landing pages, evaluating which pages convert well or poorly is vital to optimize them for better performance.

Another example use case of page-level bounce reports is A/B testing.

To do that:

  • Navigate to Explorations on the right-side menu.
  • Click Blank report.
  • From Metrics, choose Bounce rate and Sessions.
  • From Dimensions, choose Landing page + query string.
  • Under Settings (second column), choose visualization type ‘Table.”
  • Set Rows to a “Landing page + query string.”
  • Set Values  to a “Bounce rate: and “Sessions.”
  • Set the filter to include pages with more than 100 sessions ( to ensure the data you’re mining is statistically significant).
  • Select the date period of your choice.

Tip: You don’t need to create a new blank exploration report; instead, add another tab to the same report and change only the configuration.

How to setup page level-bounce rate report in GA4How to set up page level-bounce rate report.

If we don’t filter by sessions number, you’ll be looking at bounce rates on some pages with only one or two sessions, which doesn’t tell you anything.

Once you’ve done the above, repeat the process per channel to gain an even more rounded understanding of what content/source combinations produce the most or least engaged visits.

How To Analyze Your Bounce Rates By Traffic Channel

Bounce rates can be wildly different depending on the source of traffic.

For example, it’s likely that search traffic will produce a low bounce rate while social and display traffic might produce a high bounce rate.

So you also have to consider bounce rate on a channel level as well as on a page level.

The bounce rate from social and display is almost always higher than “inbound” channels for these reasons:

  • When a user is on social media looking through their news feed, they are (often) not actively looking for what we are promoting.
  • When a user sees a banner ad on another website, they are (often) not actively looking for what we are promoting.

However, for inbound channels like organic and paid search, it’s logical that the bounce rate is lower as these users are actively searching for what you are promoting.

So, you capture their attention during the “doing” phase of their buyer’s journey (depending on the search term in question).

To dig deeper into each one:

  • From Metrics, choose Bounce rate and Sessions.
  • From Dimensions, choose Session default channel group.
  • Under Settings (second column), choose visualization type Table.
  • Set Rows to a Session default channel group.
  • Set Values to a Bounce rate and Sessions.
  • Select the date period of your choice.
How to set up a bounce rate report by traffic channels in GA4.How to set up a bounce rate report by traffic channels.

A little homework: Try to plot a line graph based on the bounce rate for your organic traffic.

Now, you can dig deeper into the data and look for patterns or reasons that one page or set of pages/source or set of sources has a higher or lower bounce rate.

Compile the information in an easy-to-read format, ping it to the powers that be, and head for a congratulatory coffee.

Do You Have The Right Intent?

Sometimes, you’ll find pages that rank in search engines for terms that have more than one meaning.

For example, a recent one I discovered was a page on a website I manage that ranks first for the search term ‘Alang Alang’ (the name of a villa), but Alang Alang is also the name of a film.

The villa page had a high bounce rate, and one reason for this is that some of the visitors landing on that page were actually looking for the film, not the villa.

By doing keyword and competition research to see what results your target keywords produce, you can quickly understand if you have any pages that rank well for terms that could be intended for other topics.

When you identify such pages, you have three options:

  • Completely change your keyword targeting.
  • Remove the page from the SERPs.
  • Overhaul your title and meta description, so searchers know explicitly what the page is about before they click.

How To Increase Website Engagement

Now you’ve figured out what’s going wrong, you’re all set to make some changes.

All of this depends on your study’s findings, so not all of these points are relevant to every scenario, but this should be a good starting point.

Most importantly track custom events as “key events” (conversions) so things like newsletter sign-ups result in Google Analytics classifying that as a non-bounce even if the user didn’t visit a second page.

Is High Bounce Rate Bad?

Hopefully, you now understand why bounce rate isn’t simply “high” or “low”. It depends on many factors, and there is no single answer to the question, “Is high bounce rate bad?”

If you defined your ‘key events’ (conversions) and GA4 settings correctly for your goals, a high bounce ( +90% ) rate is definitely concerning because it means your visitors don’t engage enough with your webpages.

But if you have GA4 on default settings, you can never rely on data because of the reasons we discussed above.

Never assume anything. Do your research and make sure you configure your GA4 account properly to track ‘key events.’

Now, go forth and conquer your bounce rate!

More resources:


Featured Image: eamesBot/Shutterstock

Source link

Keep an eye on what we are doing
Be the first to get latest updates and exclusive content straight to your email inbox.
We promise not to spam you. You can unsubscribe at any time.
Invalid email address
Continue Reading

Trending