SEO
What Are SEO Benchmarks, & Which Ones Actually Matter?
To set goals and track and measure your performance in any campaign, you will need key performance indicators (KPIs) and benchmarks.
But with so many KPIs, knowing exactly which ones you should be benchmarking can be challenging. In this article, we will look at which SEO benchmarks matter and why.
Many people usually talk about key performance indicators (KPIs) and benchmarks interchangeably, which can be confusing, especially if you’re new to SEO. Although they do work together, they are not the same.
KPIs are industry statistics you can use to measure performance over time and give insights as to how effective your SEO campaign is.
Benchmarks, however, are KPIs you set as your reference point when building your SEO strategy.
For example, organic traffic is a KPI. But you can use last month’s organic traffic as a benchmark.
SEO benchmarks allow us to have a before and after picture for any particular KPI. This helps us to see how our SEO campaign is progressing and can help us to adjust our strategy if needed.
Benchmarks also allow us to communicate the value of our work to clients.
There are many different KPIs you can measure. And like most things in SEO, which ones you should track will depend on the type of site you’re working on and their individual goals.
However, there are several KPIs that are important for tracking the performance of all websites.
Let’s take a look at which KPIs everyone should be benchmarking and why they are important.
Traffic and user experience benchmarks
Driving users to your site is only part of the work.
If a site user has a bad experience, they are likely to leave the site and never return. This is why we not only want to set traffic-related benchmarks but also user experience benchmarks too.
Organic search traffic
This metric shows how many users visit your site from unpaid listings on search engines like Google and Bing. You should be tracking traffic on a monthly basis.
When setting benchmarks, generally speaking, it is advisable to use the last full month’s data and not set it any further back than this, as the goal should always be to outperform your closest benchmark.
However, if seasonality is a factor in your business, it’s advisable to use your best month in the peak season as your ongoing benchmark.
For accuracy, when it comes to organic traffic from Google, it is advisable to check Google Search Console (GSC).
There are a number of discrepancies between GSC and Google Analytics due to how they collect data. But when focusing on organic traffic from Google itself, GSC is considered more accurate.
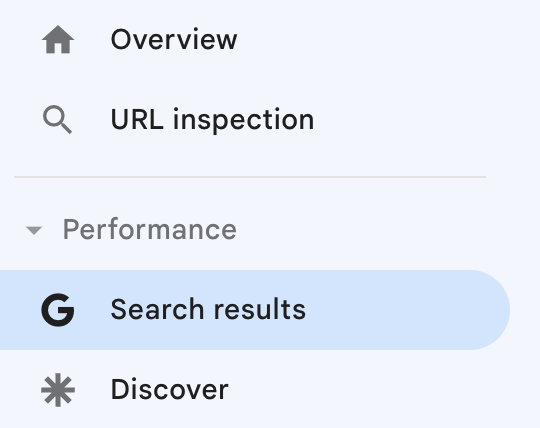
Head over to Google Search Console and go to Performance > Search results.
In the “Performance” report, you will see four metrics. The first metric, “clicks,” is the number of people who clicked through from the Google search results to your website. This is the number we are interested in.
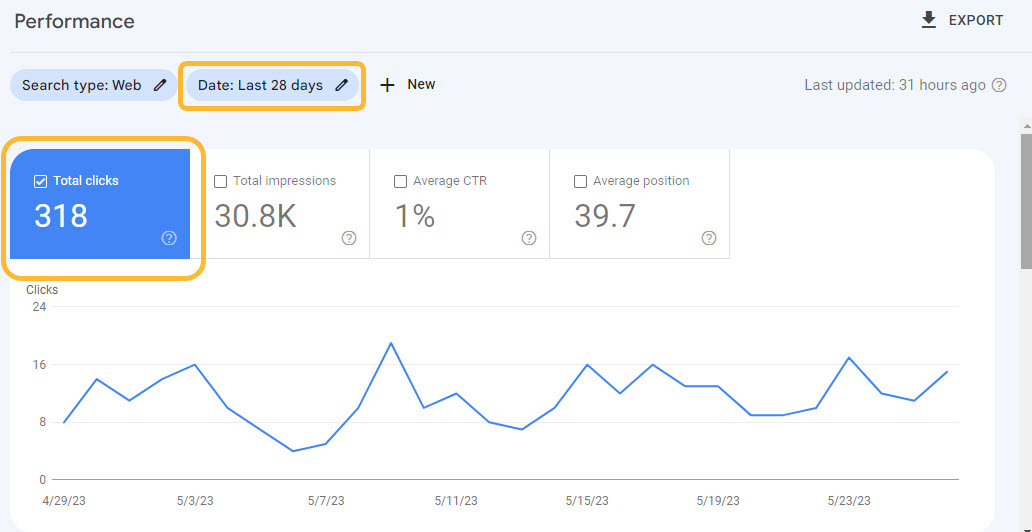
Below this, you can also see the number of clicks at page level.

If you want to split organic traffic by search engine, you can do this with GA4. Go to Acquisition > Traffic acquisition.
Then you can go to “All Users” and choose “First user source / medium” from the “Audience name” drop-down menu.
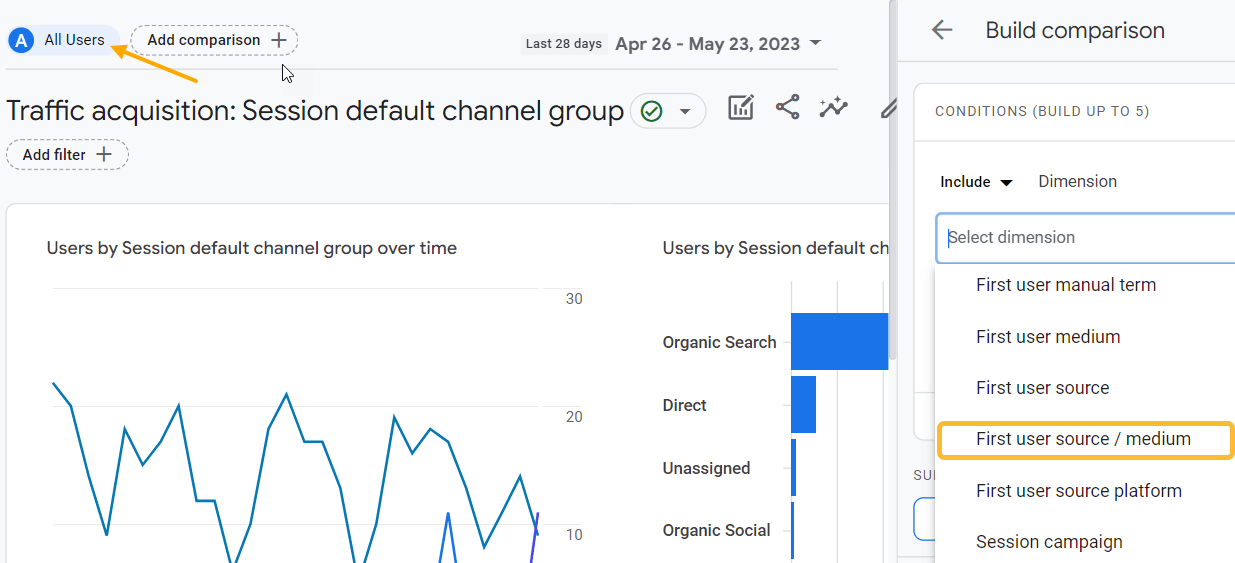
Then you can select the organic search channels you want to include from the “Dimension values” drop-down menu. This can be all organic traffic from multiple search engines, or you can set individual benchmarks for each search engine, like Bing or Yahoo.
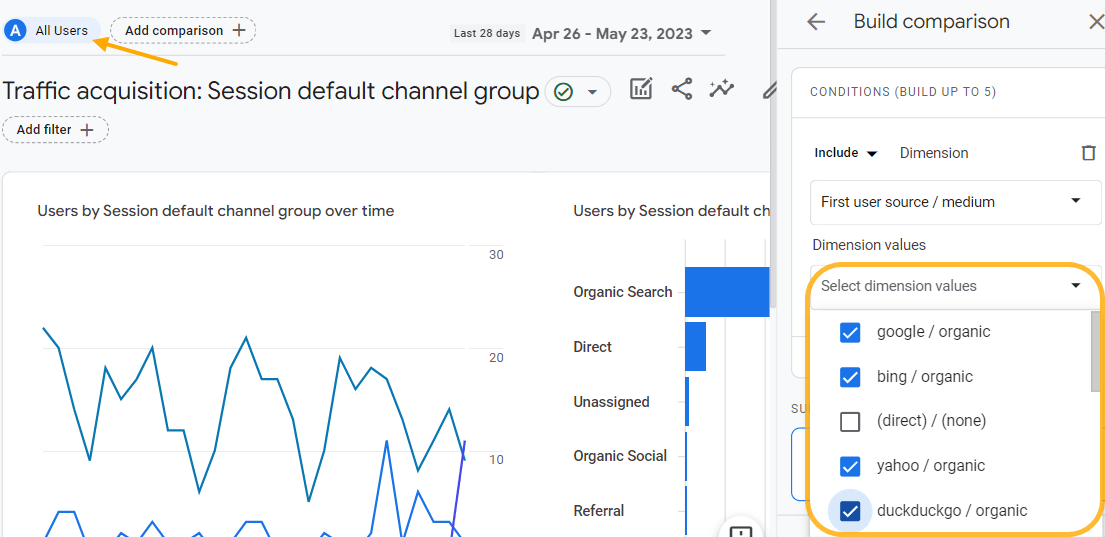
With these filters applied, you will see your website’s organic traffic for the past month. If you would like to see it broken down at the page level, you can simply go to Engagement > Pages and screens.
Engaged sessions
In GA4, “Bounce rate” has essentially been replaced by “Engaged sessions.” In order for a session to be engaged, it must last longer than 10 seconds, have multiple screen or page views, or result in a conversion.
You can see the number of engaged sessions per user in Engagement > Overview.

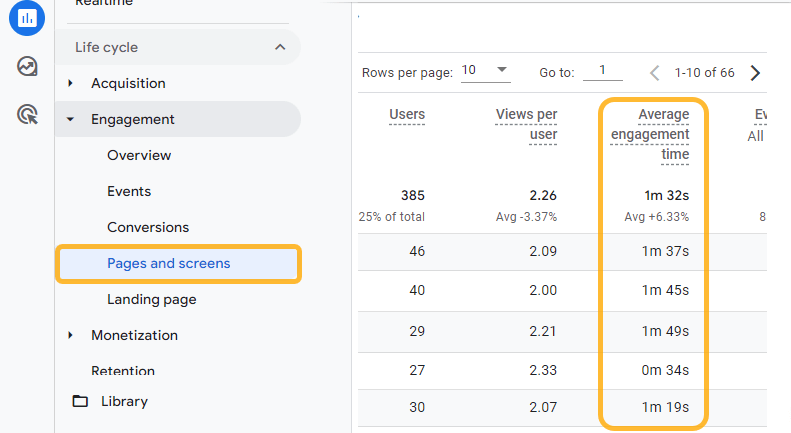
Average engagement time
Average engagement time in GA4 is important because, generally speaking, we want users to stay on the site for a longer period of time.
Low engagement time isn’t always a bad thing. It can simply mean the visitor got what they needed fast. If you’re working with a site that monetizes content like an affiliate site, you will want your visitor to click that affiliate link as soon as possible. So take this one with a grain of salt.
However, it can sometimes be an indicator of:
- Low-quality content
- Poor user experience
Overall average engagement time is listed on the “Report snapshot” in GA4.

But you can get a detailed breakdown in Engagement > Pages and screens.
Backlink profile benchmarks
Backlinks are links from another website to a page on your website. They help Google and other search engines understand your content and how authoritative your website is.
The backlinks’ quality, quantity, relevance, authority, and anchor text are among the many ranking factors for Google.
Number of backlinks
You want the number of (quality) links to be growing at a consistent rate. You need backlinks both to rank and maintain your rankings. Benchmarking the number of backlinks your website has will help you to monitor growth as you go forward.
With the Backlinks report in Ahrefs’ Site Explorer, you can see the total number of links to your website.

You can also see the number of individual referring domains and how they are growing month over month (and compare that against competitors on the same graph).
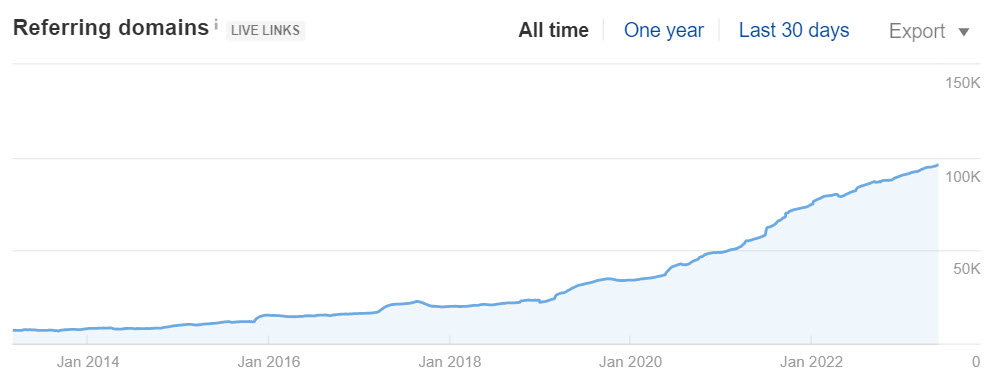
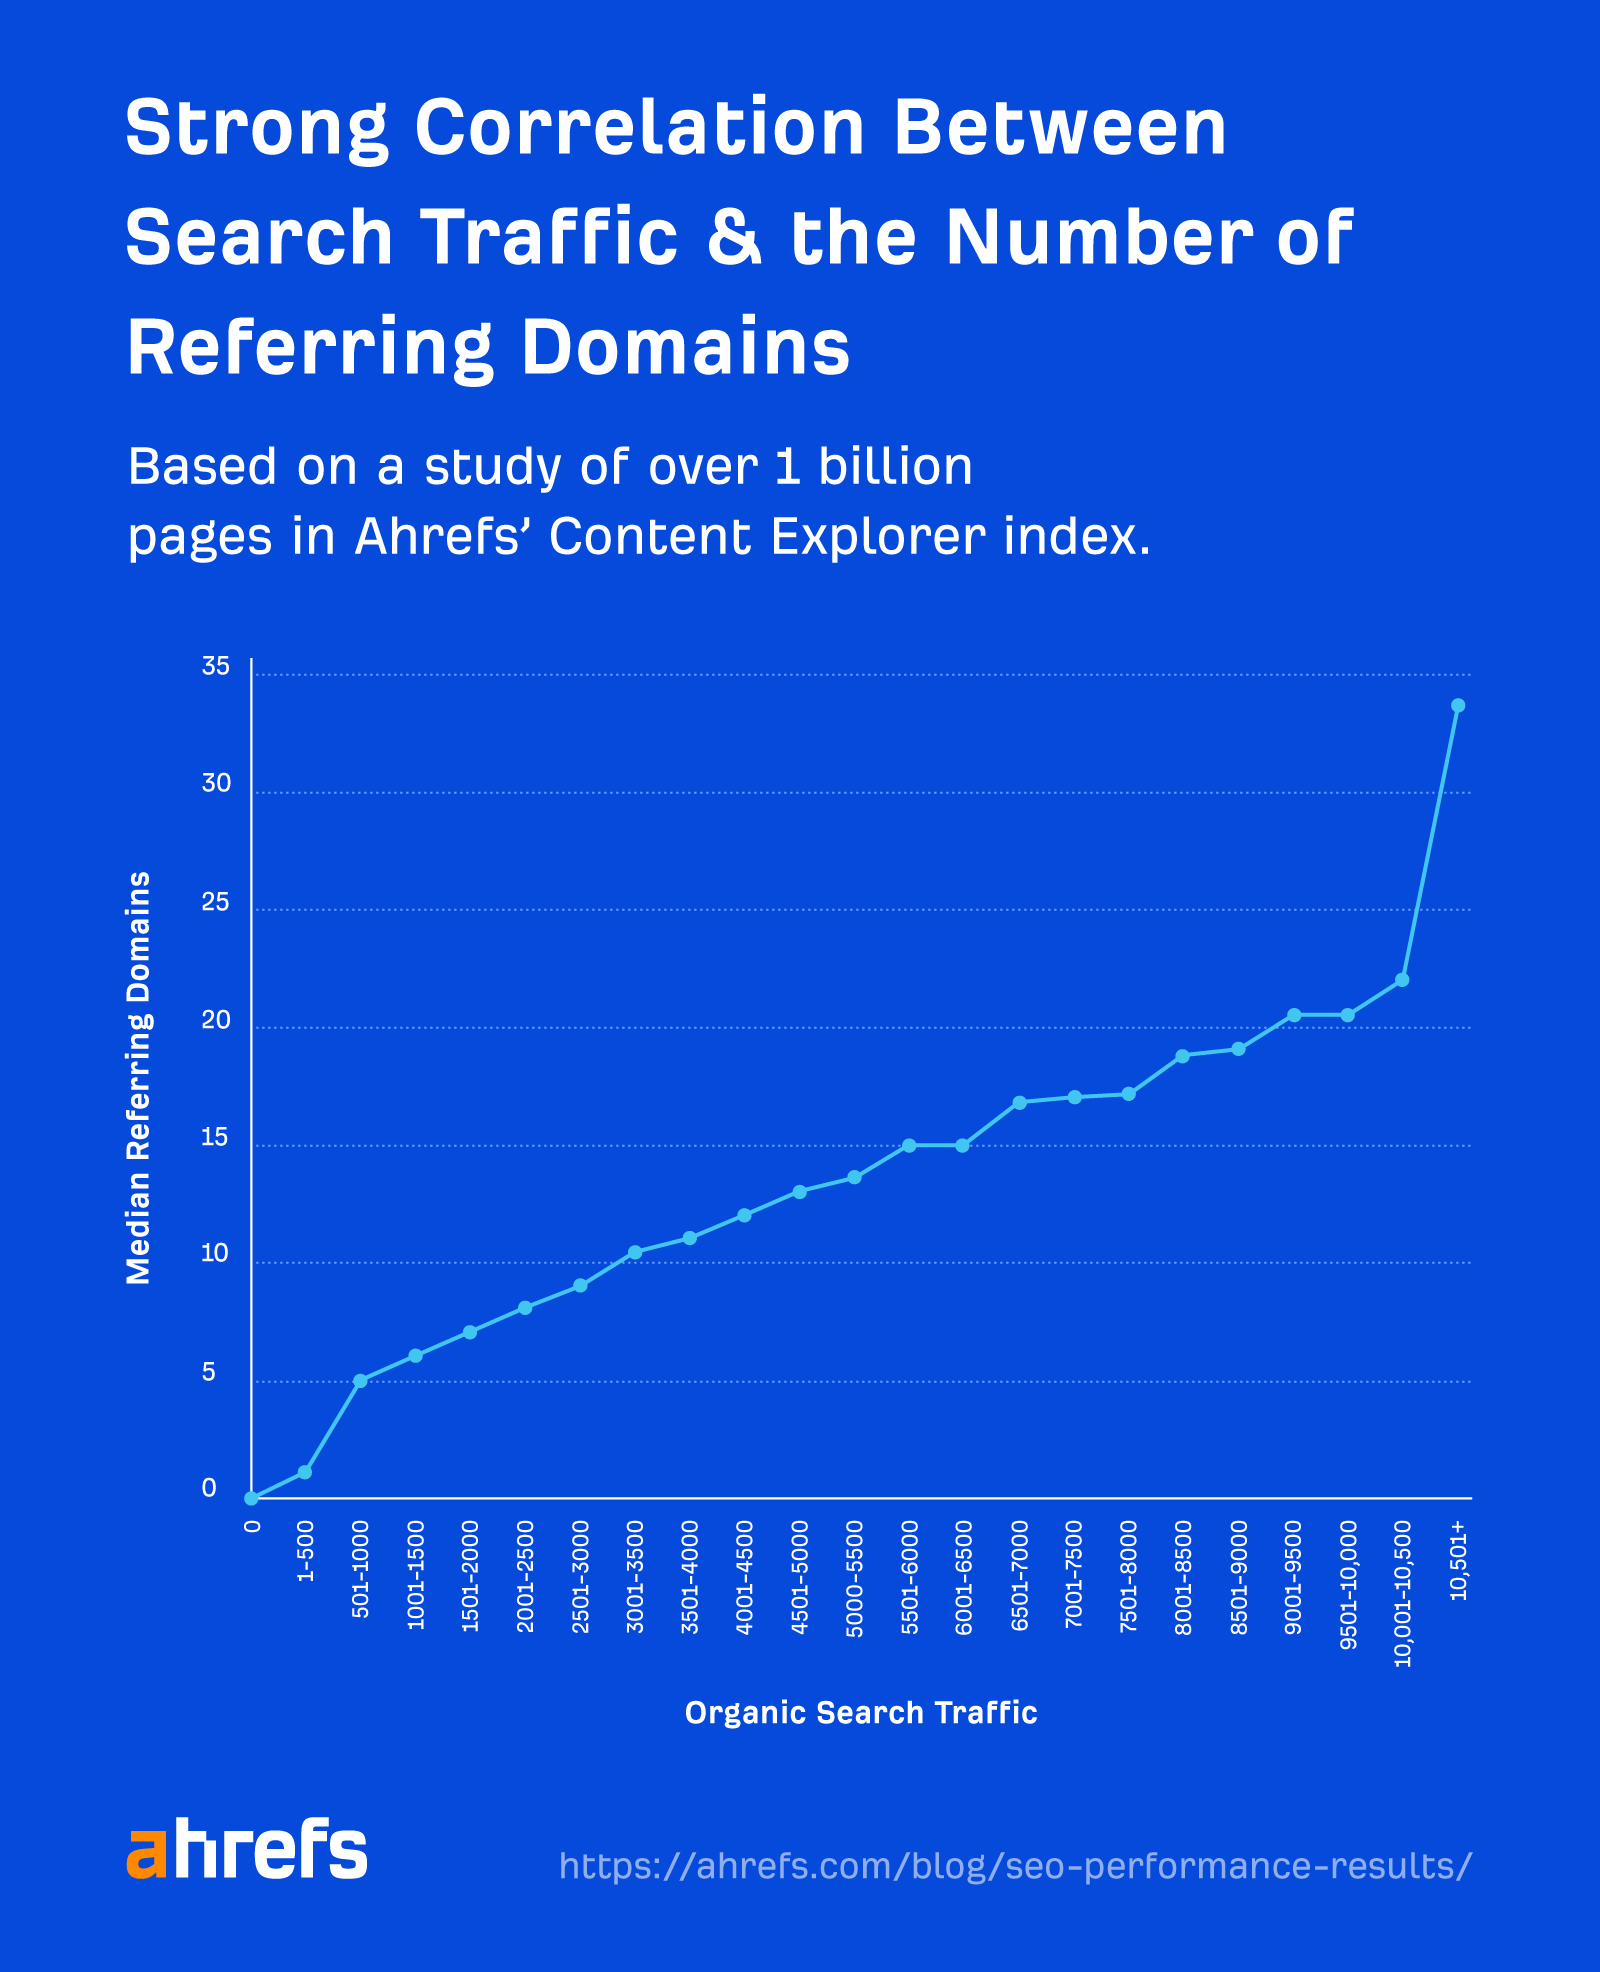
This is an important thing to benchmark, as there is a strong positive correlation between the number of referring domains and increased organic traffic.
Domain Rating
Ahrefs’ Domain Rating (DR) is a measure of the strength of a website’s backlink profile. It shows how your website’s backlink profile compares to the others in the Ahrefs database on a 100-point scale.
The idea would be for your website’s DR to increase over time as an indication that the strength of your backlink profile is improving.
Benchmarking DR is a pretty common practice, especially among those working with clients who may not fully comprehend SEO and, in particular, link building. It’s easier to relay that DR getting higher indicates improvement.

URL Rating
Although DR correlates with Google rankings pretty well, it doesn’t do this as well as Ahrefs’ URL Rating (UR). UR is a measure of an individual page’s backlink profile on a 100-point scale.
UR considers both internal and external links and “nofollow” attributes when calculating the UR score, following the same principles as Google’s PageRank. Therefore, benchmarking UR can help you understand how well an individual page can rank on the search engine results pages (SERPs).

Keyword benchmarks
Keywords are the bread and butter of your SEO campaign. After all, you need to understand what relevant queries your potential audience is searching for in order to optimize your pages.
Individual keyword positions
Your website could naturally rank for thousands of keywords on the SERPs. However, there should be some keywords you care about more than others—likely those that are most relevant to your products or services.
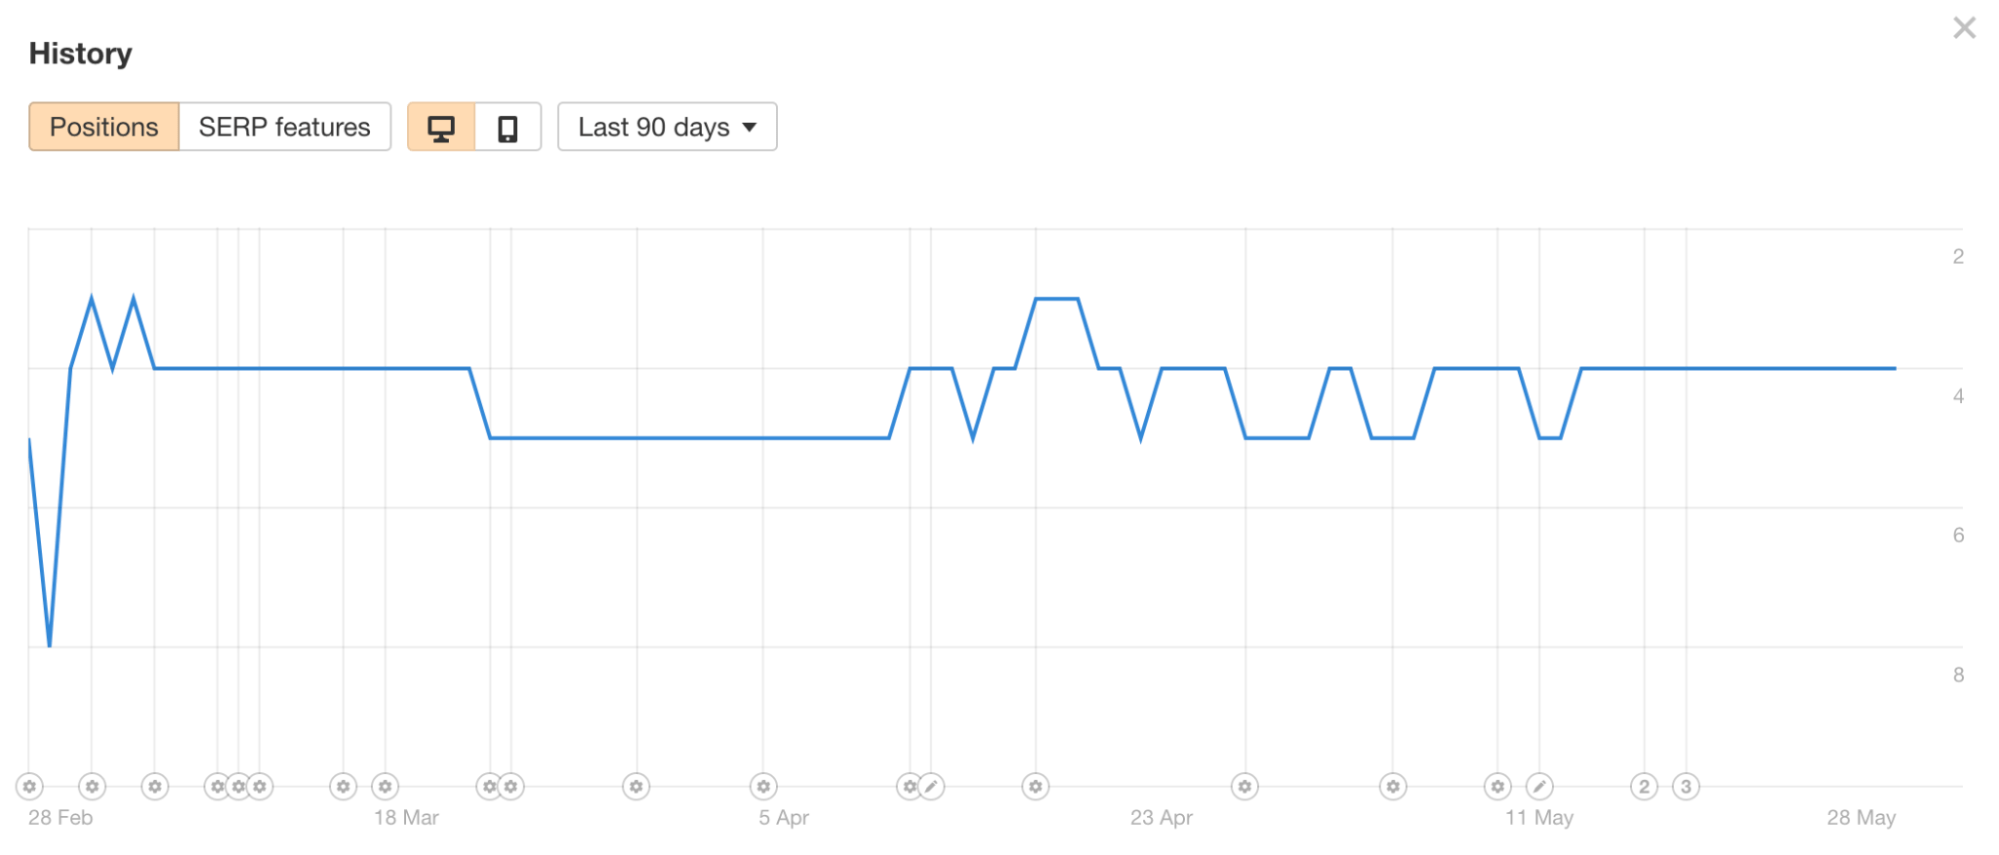
Benchmarking individual keyword positions (where they rank in the search results) will allow you to track and set goals for important keywords. For example, if your website currently ranks in position #6 for “seo consultant,” you can use that as your benchmark to improve upon.
While you can monitor keywords in Google Search Console, using a rank tracking tool like Ahrefs’ Rank Tracker will allow you to track the keywords you care about most and see how you stack up against competitors. You can even get email alerts about the progress of your tracked keywords.
Keyword profile value
Although benchmarking the keyword profile value may not be relevant for everyone, I find that for anyone working with clients, it can help them to relay the value of the work they’re doing. Keyword profile value can be seen in Ahrefs’ Site Explorer as “Traffic value.”
Organic traffic value is the equivalent monthly cost of traffic from all keywords that the target website/URL ranks for if paid via PPC instead of ranking organically.

Keyword Difficulty
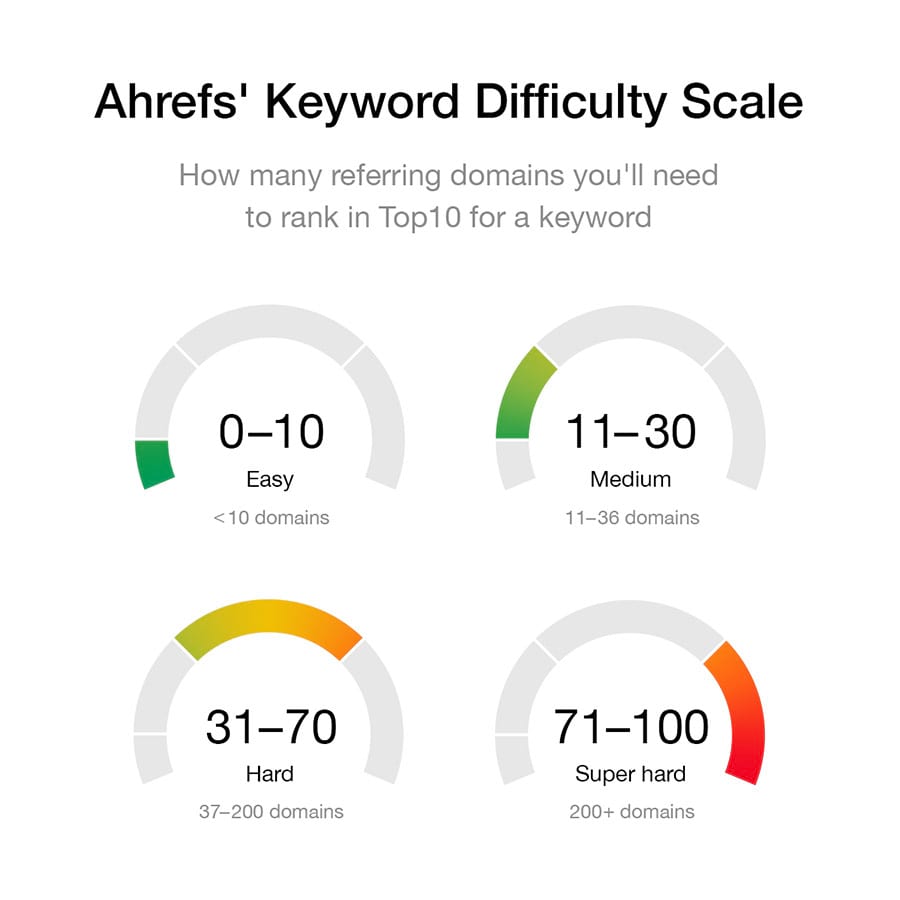
Ahrefs’ Keyword Difficulty (KD) is a metric that can help you determine how hard it would be to rank in the top 10 for a given keyword in a given country.
It is calculated by taking a trimmed mean of the number of linking domains to the current top 10 ranking pages and then plotting the result on a logarithmic scale from 0 to 100.
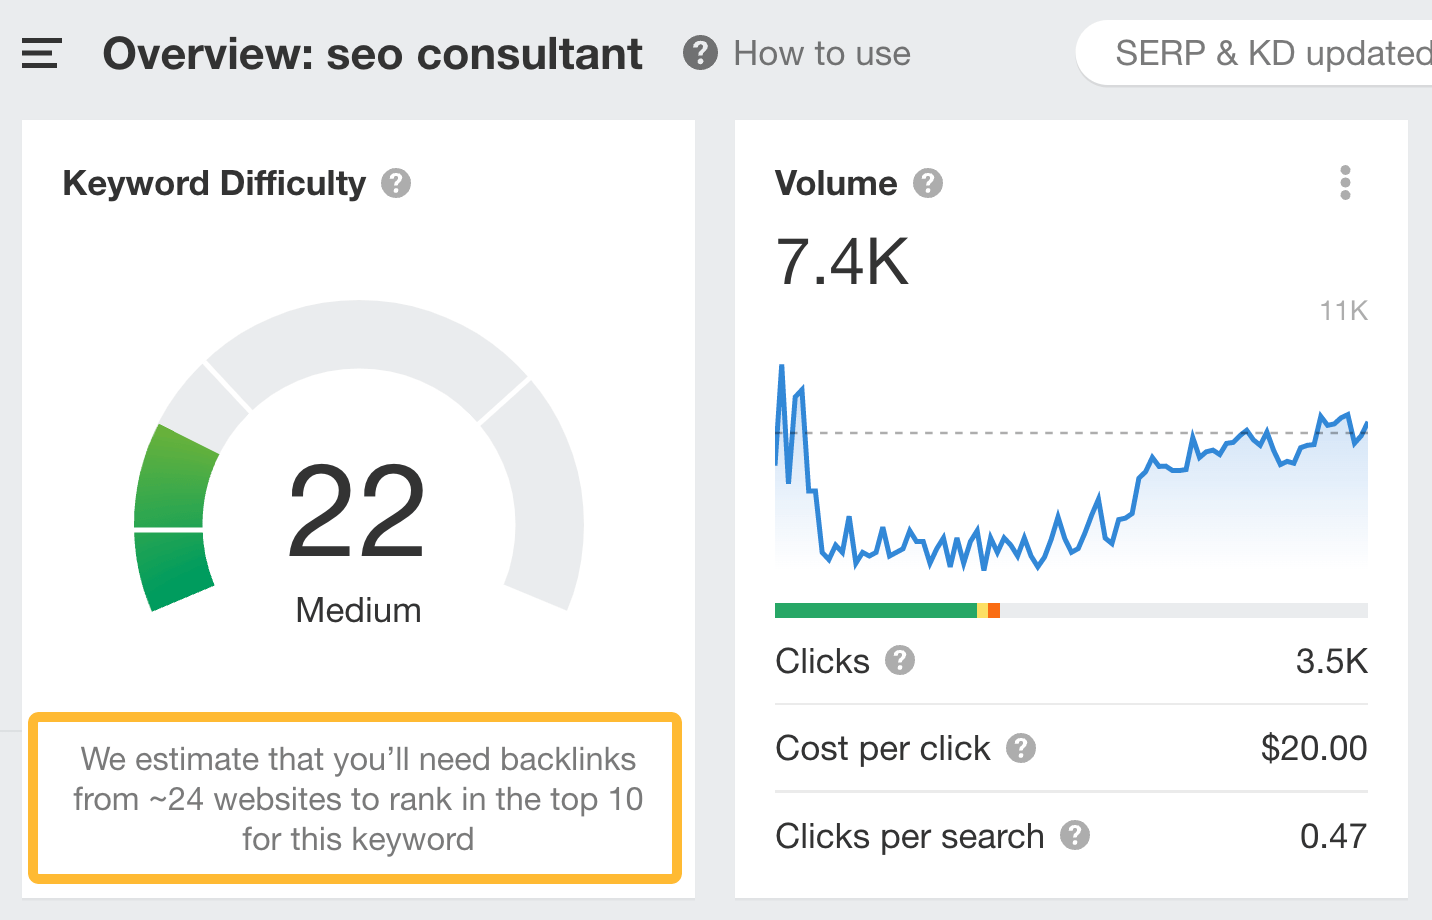
KD only takes into account linking domains, but there are many other variables you will need to rank highly, like great content. However, it is a good indicator.
KD can be used as a benchmark for choosing keywords. For example, you may find that, currently, you can only rank for keywords that are considered “easy” or “medium” in terms of KD. Whereas your most important keywords may be considered “hard.”
However, the level of KD you can achieve should improve over time. That’s why KD can be an important metric to benchmark and improve upon.
Share of voice
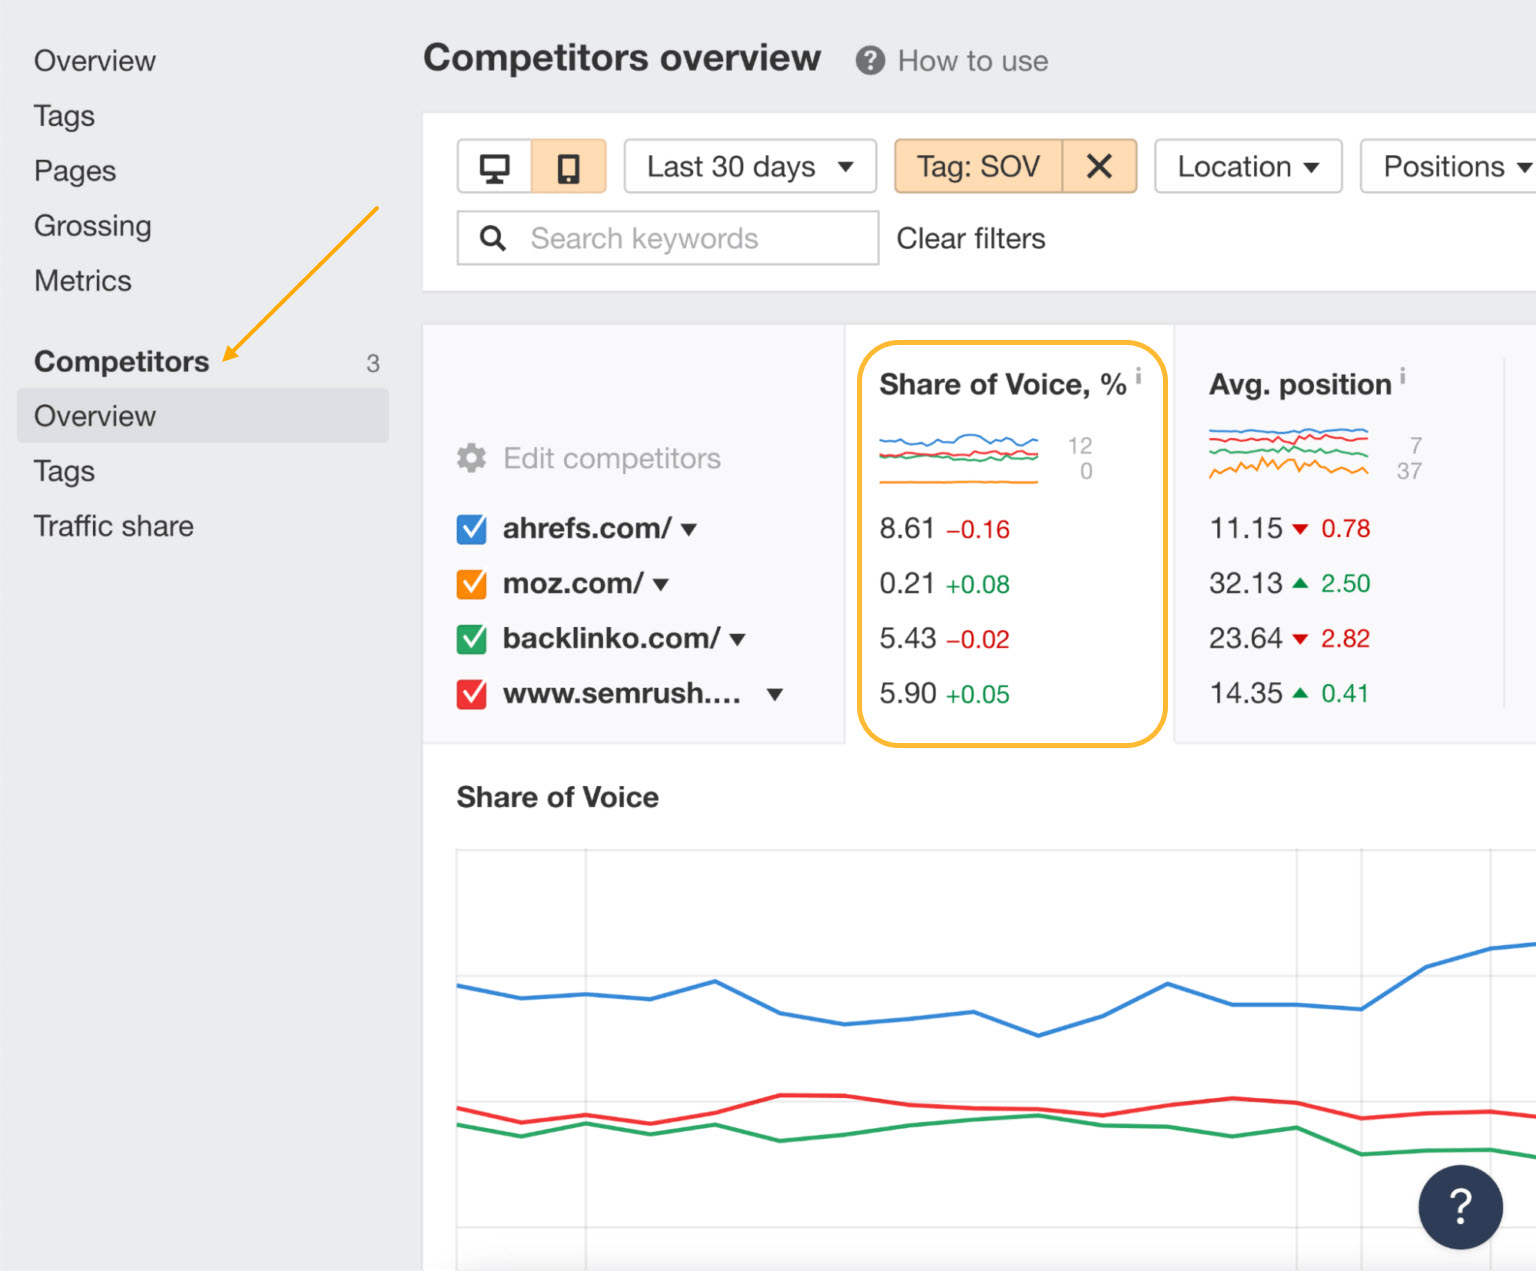
Share of voice (SOV) takes rank tracking to another level. You can see SOV in the Overview report in Rank Tracker.
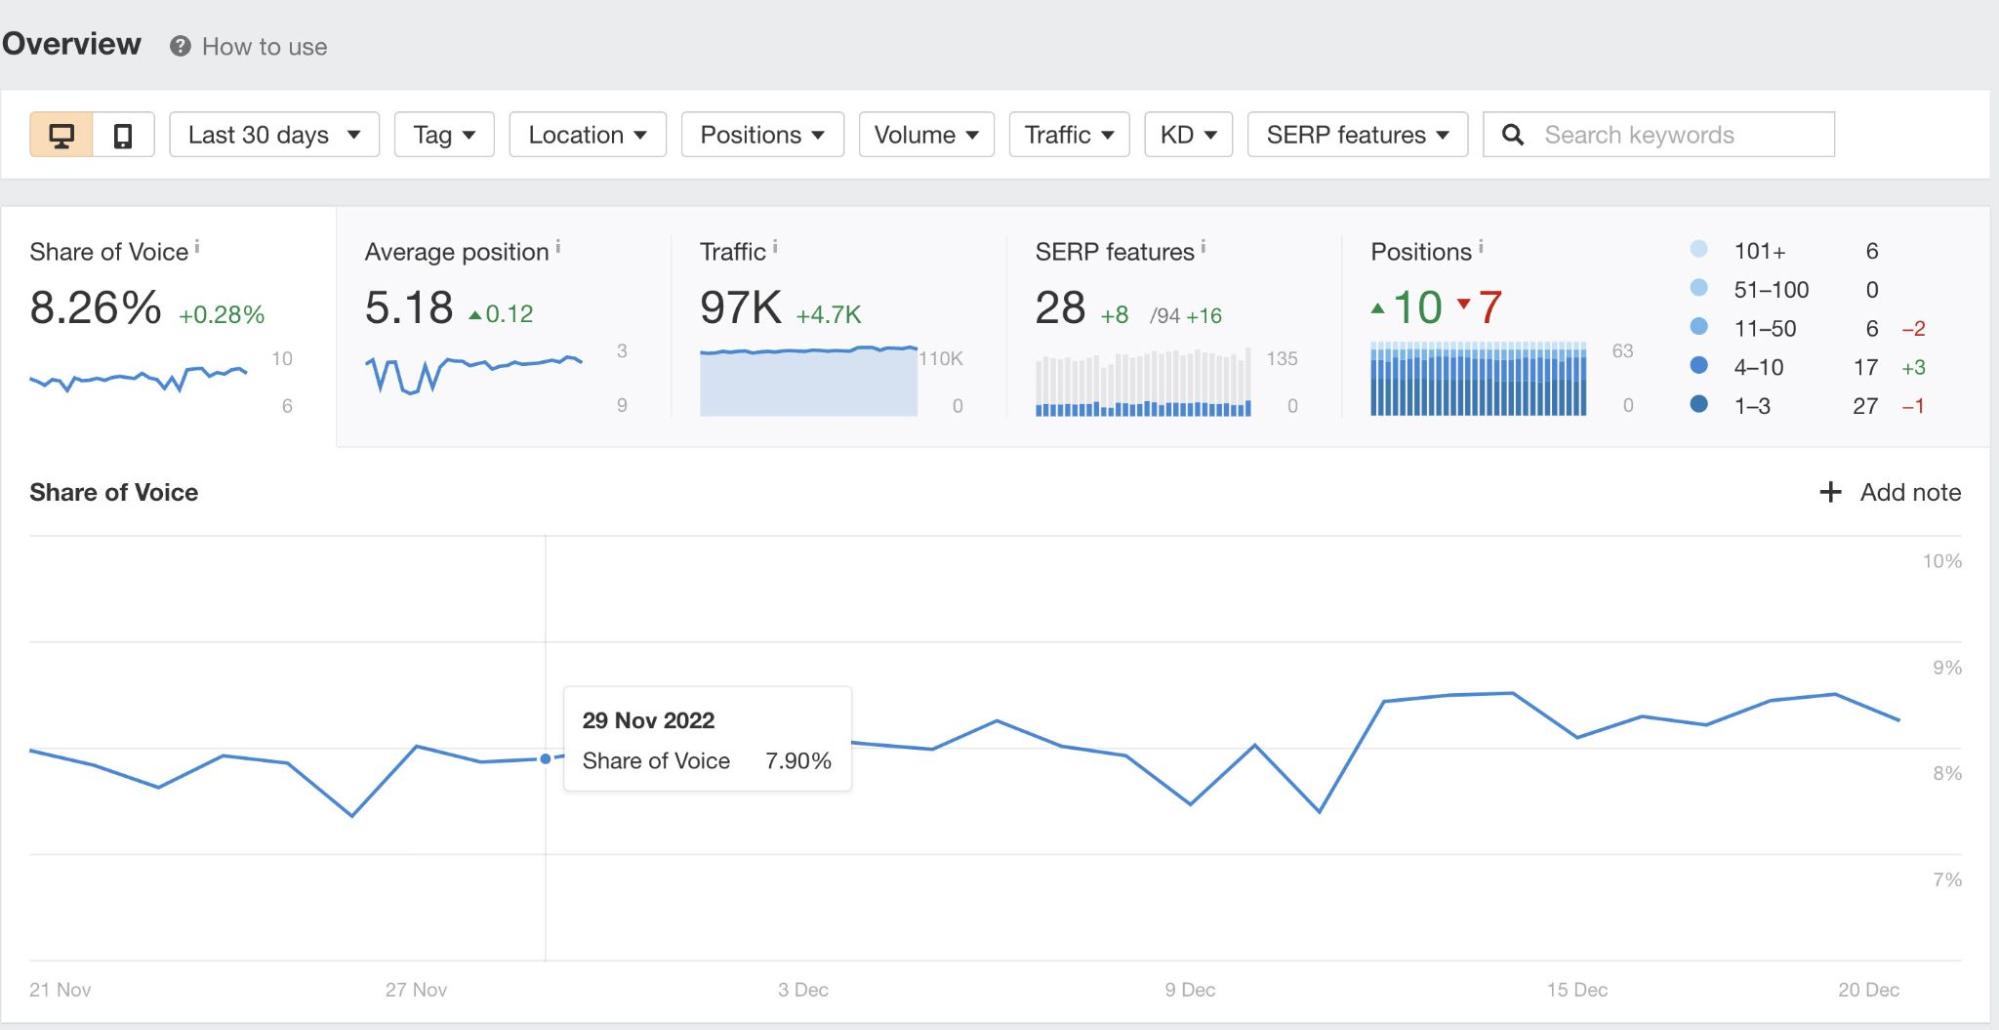
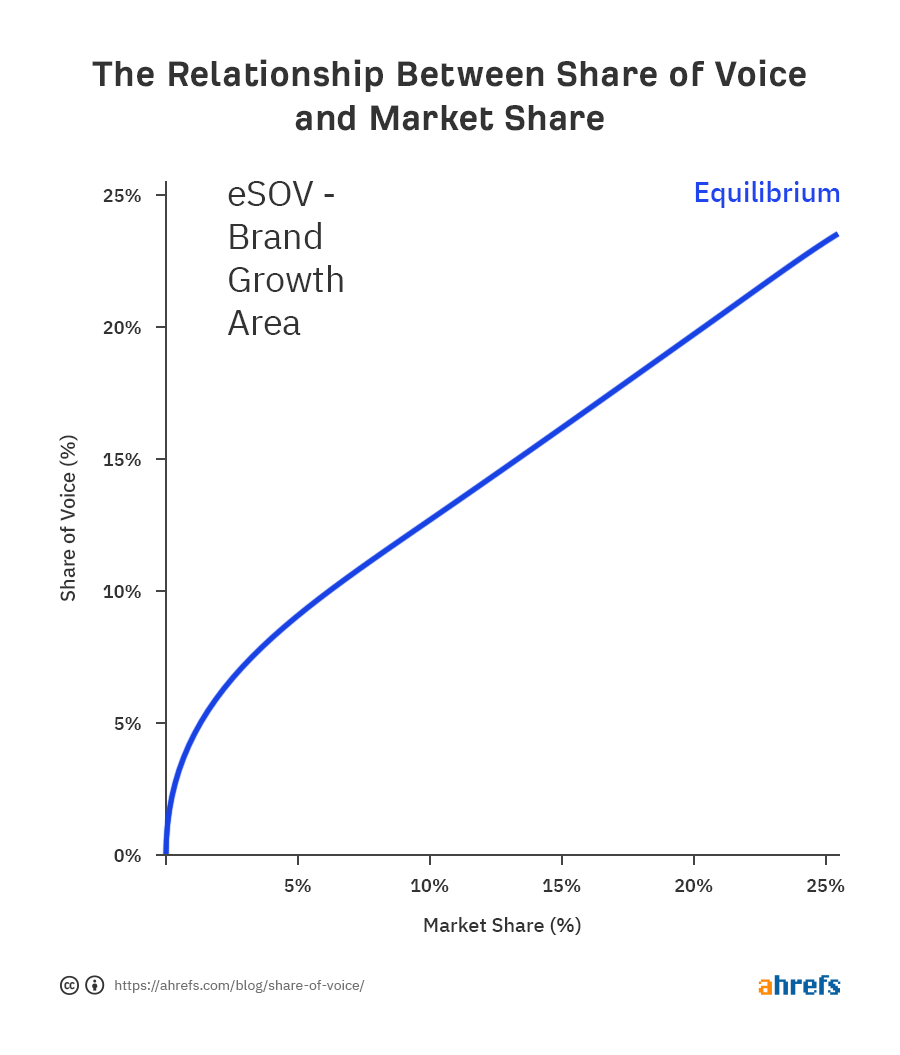
The SOV metric shows you the percentage of all possible organic clicks (from the SERPs) for the tracked keywords landing on your website. It basically shows you how visible your brand is on the SERPs.
There is a strong positive correlation between SOV and market share. So it is an important KPI to benchmark.
By heading to the “Competitors” tab in Rank Tracker and entering the websites you consider your competition, you can compare your SOV to those sites.
Final thoughts
Benchmarking important KPIs is one of the best ways to not only see where your website is currently at but also give you data you can improve upon. It allows you to set strategic goals and measure ongoing performance.
Got questions? Ping me on Twitter.
SEO
Google Declares It The “Gemini Era” As Revenue Grows 15%

Alphabet Inc., Google’s parent company, announced its first quarter 2024 financial results today.
While Google reported double-digit growth in key revenue areas, the focus was on its AI developments, dubbed the “Gemini era” by CEO Sundar Pichai.
The Numbers: 15% Revenue Growth, Operating Margins Expand
Alphabet reported Q1 revenues of $80.5 billion, a 15% increase year-over-year, exceeding Wall Street’s projections.
Net income was $23.7 billion, with diluted earnings per share of $1.89. Operating margins expanded to 32%, up from 25% in the prior year.
Ruth Porat, Alphabet’s President and CFO, stated:
“Our strong financial results reflect revenue strength across the company and ongoing efforts to durably reengineer our cost base.”
Google’s core advertising units, such as Search and YouTube, drove growth. Google advertising revenues hit $61.7 billion for the quarter.
The Cloud division also maintained momentum, with revenues of $9.6 billion, up 28% year-over-year.
Pichai highlighted that YouTube and Cloud are expected to exit 2024 at a combined $100 billion annual revenue run rate.
Generative AI Integration in Search
Google experimented with AI-powered features in Search Labs before recently introducing AI overviews into the main search results page.
Regarding the gradual rollout, Pichai states:
“We are being measured in how we do this, focusing on areas where gen AI can improve the Search experience, while also prioritizing traffic to websites and merchants.”
Pichai reports that Google’s generative AI features have answered over a billion queries already:
“We’ve already served billions of queries with our generative AI features. It’s enabling people to access new information, to ask questions in new ways, and to ask more complex questions.”
Google reports increased Search usage and user satisfaction among those interacting with the new AI overview results.
The company also highlighted its “Circle to Search” feature on Android, which allows users to circle objects on their screen or in videos to get instant AI-powered answers via Google Lens.
Reorganizing For The “Gemini Era”
As part of the AI roadmap, Alphabet is consolidating all teams building AI models under the Google DeepMind umbrella.
Pichai revealed that, through hardware and software improvements, the company has reduced machine costs associated with its generative AI search results by 80% over the past year.
He states:
“Our data centers are some of the most high-performing, secure, reliable and efficient in the world. We’ve developed new AI models and algorithms that are more than one hundred times more efficient than they were 18 months ago.
How Will Google Make Money With AI?
Alphabet sees opportunities to monetize AI through its advertising products, Cloud offerings, and subscription services.
Google is integrating Gemini into ad products like Performance Max. The company’s Cloud division is bringing “the best of Google AI” to enterprise customers worldwide.
Google One, the company’s subscription service, surpassed 100 million paid subscribers in Q1 and introduced a new premium plan featuring advanced generative AI capabilities powered by Gemini models.
Future Outlook
Pichai outlined six key advantages positioning Alphabet to lead the “next wave of AI innovation”:
- Research leadership in AI breakthroughs like the multimodal Gemini model
- Robust AI infrastructure and custom TPU chips
- Integrating generative AI into Search to enhance the user experience
- A global product footprint reaching billions
- Streamlined teams and improved execution velocity
- Multiple revenue streams to monetize AI through advertising and cloud
With upcoming events like Google I/O and Google Marketing Live, the company is expected to share further updates on its AI initiatives and product roadmap.
Featured Image: Sergei Elagin/Shutterstock
SEO
brightonSEO Live Blog

Hello everyone. It’s April again, so I’m back in Brighton for another two days of Being the introvert I am, my idea of fun isn’t hanging around our booth all day explaining we’ve run out of t-shirts (seriously, you need to be fast if you want swag!). So I decided to do something useful and live-blog the event instead.
Follow below for talk takeaways and (very) mildly humorous commentary. sun, sea, and SEO!
SEO
Google Further Postpones Third-Party Cookie Deprecation In Chrome

Google has again delayed its plan to phase out third-party cookies in the Chrome web browser. The latest postponement comes after ongoing challenges in reconciling feedback from industry stakeholders and regulators.
The announcement was made in Google and the UK’s Competition and Markets Authority (CMA) joint quarterly report on the Privacy Sandbox initiative, scheduled for release on April 26.
Chrome’s Third-Party Cookie Phaseout Pushed To 2025
Google states it “will not complete third-party cookie deprecation during the second half of Q4” this year as planned.
Instead, the tech giant aims to begin deprecating third-party cookies in Chrome “starting early next year,” assuming an agreement can be reached with the CMA and the UK’s Information Commissioner’s Office (ICO).
The statement reads:
“We recognize that there are ongoing challenges related to reconciling divergent feedback from the industry, regulators and developers, and will continue to engage closely with the entire ecosystem. It’s also critical that the CMA has sufficient time to review all evidence, including results from industry tests, which the CMA has asked market participants to provide by the end of June.”
Continued Engagement With Regulators
Google reiterated its commitment to “engaging closely with the CMA and ICO” throughout the process and hopes to conclude discussions this year.
This marks the third delay to Google’s plan to deprecate third-party cookies, initially aiming for a Q3 2023 phaseout before pushing it back to late 2024.
The postponements reflect the challenges in transitioning away from cross-site user tracking while balancing privacy and advertiser interests.
Transition Period & Impact
In January, Chrome began restricting third-party cookie access for 1% of users globally. This percentage was expected to gradually increase until 100% of users were covered by Q3 2024.
However, the latest delay gives websites and services more time to migrate away from third-party cookie dependencies through Google’s limited “deprecation trials” program.
The trials offer temporary cookie access extensions until December 27, 2024, for non-advertising use cases that can demonstrate direct user impact and functional breakage.
While easing the transition, the trials have strict eligibility rules. Advertising-related services are ineligible, and origins matching known ad-related domains are rejected.
Google states the program aims to address functional issues rather than relieve general data collection inconveniences.
Publisher & Advertiser Implications
The repeated delays highlight the potential disruption for digital publishers and advertisers relying on third-party cookie tracking.
Industry groups have raised concerns that restricting cross-site tracking could push websites toward more opaque privacy-invasive practices.
However, privacy advocates view the phaseout as crucial in preventing covert user profiling across the web.
With the latest postponement, all parties have more time to prepare for the eventual loss of third-party cookies and adopt Google’s proposed Privacy Sandbox APIs as replacements.
Featured Image: Novikov Aleksey/Shutterstock
-

 PPC7 days ago
19 Best SEO Tools in 2024 (For Every Use Case)
-
SEARCHENGINES6 days ago
Daily Search Forum Recap: April 19, 2024
-

 WORDPRESS7 days ago
How to Make $5000 of Passive Income Every Month in WordPress
-

 MARKETING6 days ago
Battling for Attention in the 2024 Election Year Media Frenzy
-

 WORDPRESS5 days ago
13 Best HubSpot Alternatives for 2024 (Free + Paid)
-

 SEO7 days ago
25 WordPress Alternatives Best For SEO
-

 WORDPRESS6 days ago
7 Best WooCommerce Points and Rewards Plugins (Free & Paid)
-

 AFFILIATE MARKETING7 days ago
AI Will Transform the Workplace. Here’s How HR Can Prepare for It.


