Connect with us
Cloak And Track Your Affiliate Links With Our User-Friendly Link Cloaking Tool, Try It Free

SEO

Beginner’s Guide to Content Marketing Reporting
Published

on

Beginner’s Guide to Content Marketing Reporting

Not sure how to prepare your content report? I get it — too many metrics to report, and what should a report look look in the first place? I promise this will change by the end of this guide.

In this guide, you’ll learn the three best practices of reporting and eight types of information that make a solid content report, including the actual KPIs used by content marketers.

From my experience, I’ve learned that having three key features in a content report makes all the difference: data-led, actionable, and function-driven. It keeps everyone on the same page and ensures our work counts.

Let’s unpack this.

1. Data-led

Instead of relying on gut feelings or assumptions, a data-led report is based on quantitative (numbers) and qualitative (observations) data to provide a clear, objective view of content performance.

This way, every recommendation or insight is grounded in verifiable facts, making it a reliable tool for decision-making.

2. Actionable

At the same time, a good content marketing report doesn’t just drown the reader in numbers and charts; it interprets the data to provide clear, actionable insights.

This means specific recommendations accompany the numbers on what can be done to improve performance. Whether it’s tweaking the content strategy, focusing on different topics, adjusting distribution channels, or choosing different SEO tactics, actionable reports transform data into a roadmap for better outcomes.

3. Function-driven

In reporting, form needs to follow function — the content and structure of the report need to be tailored to the specific needs of the person you want to share it with. You could also think of it this way: reports should be good enough to serve their purpose, but everything above that would be overkill.
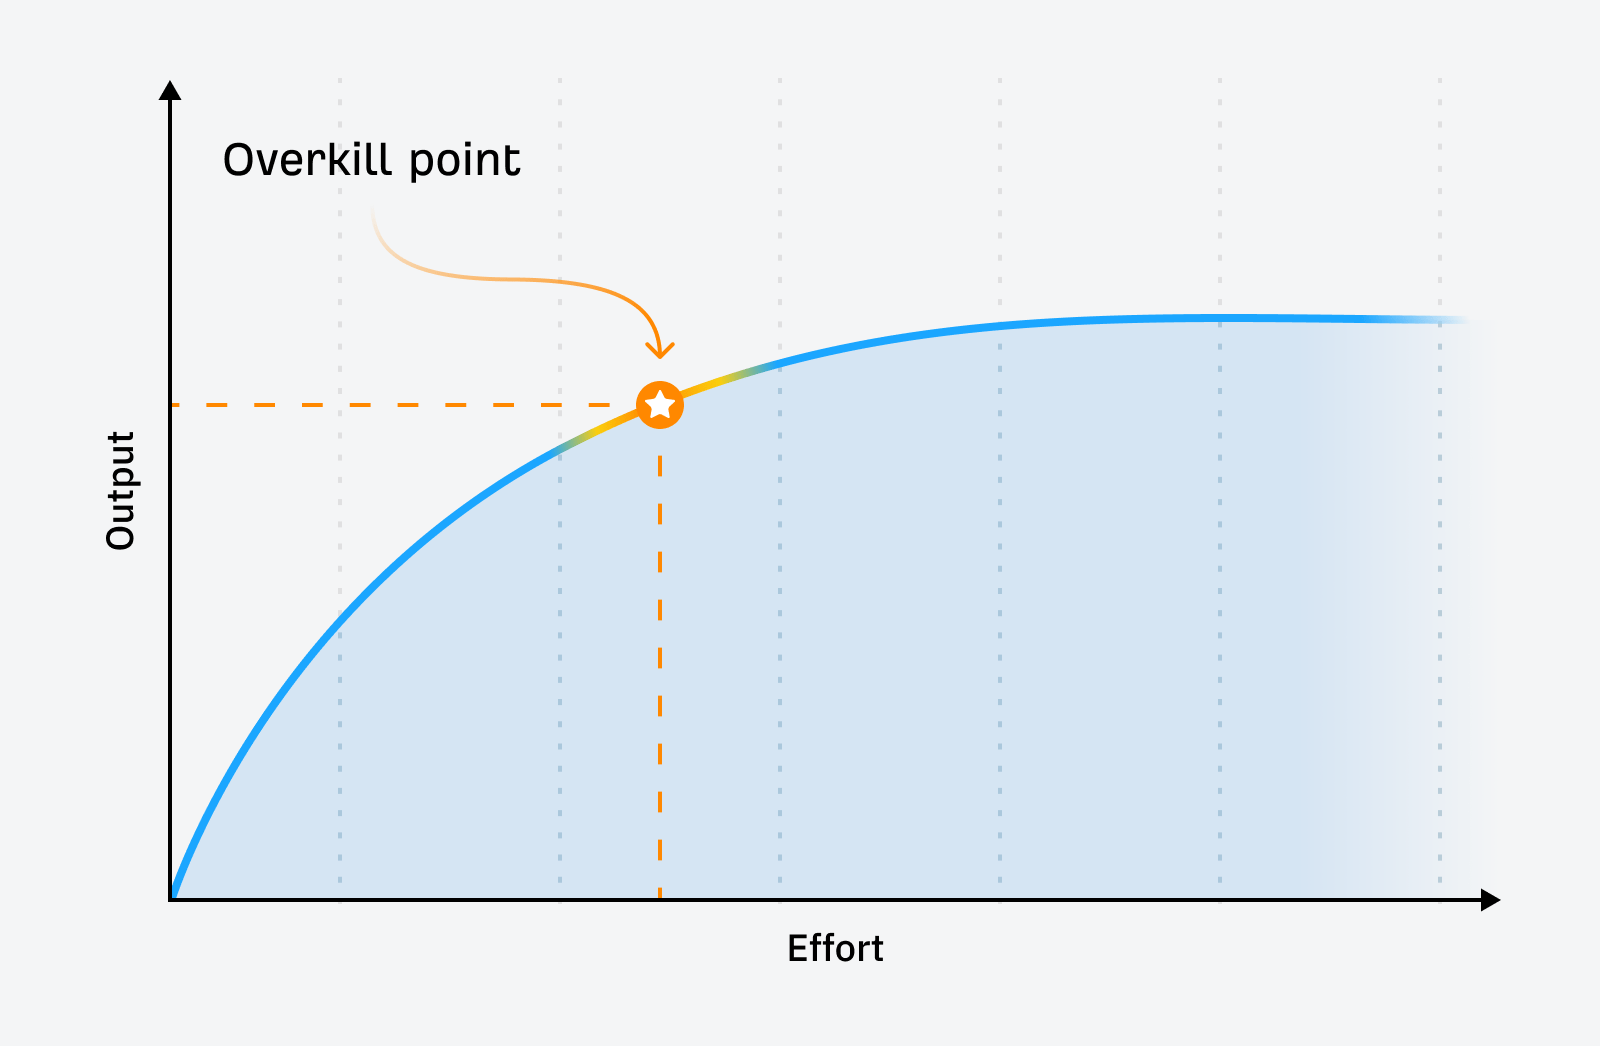
Output vs. effort in creating reports.Output vs. effort in creating reports.

Don’t overthink, overcomplicate, or over-design your reports. Pick the KPIs that you can actually influence, add some actually useful commentary, and choose the form that won’t make your boss or client think that you’re spending too much time on “paperwork”.

To illustrate, a typical agency or freelance report is about ROI or generating value for the client. They come in the form of an entire document, nicely designed with a lot of data and insights (similar to this SEO report). It could even be accompanied by a live dashboard like the one below created in Google Looker Studio:
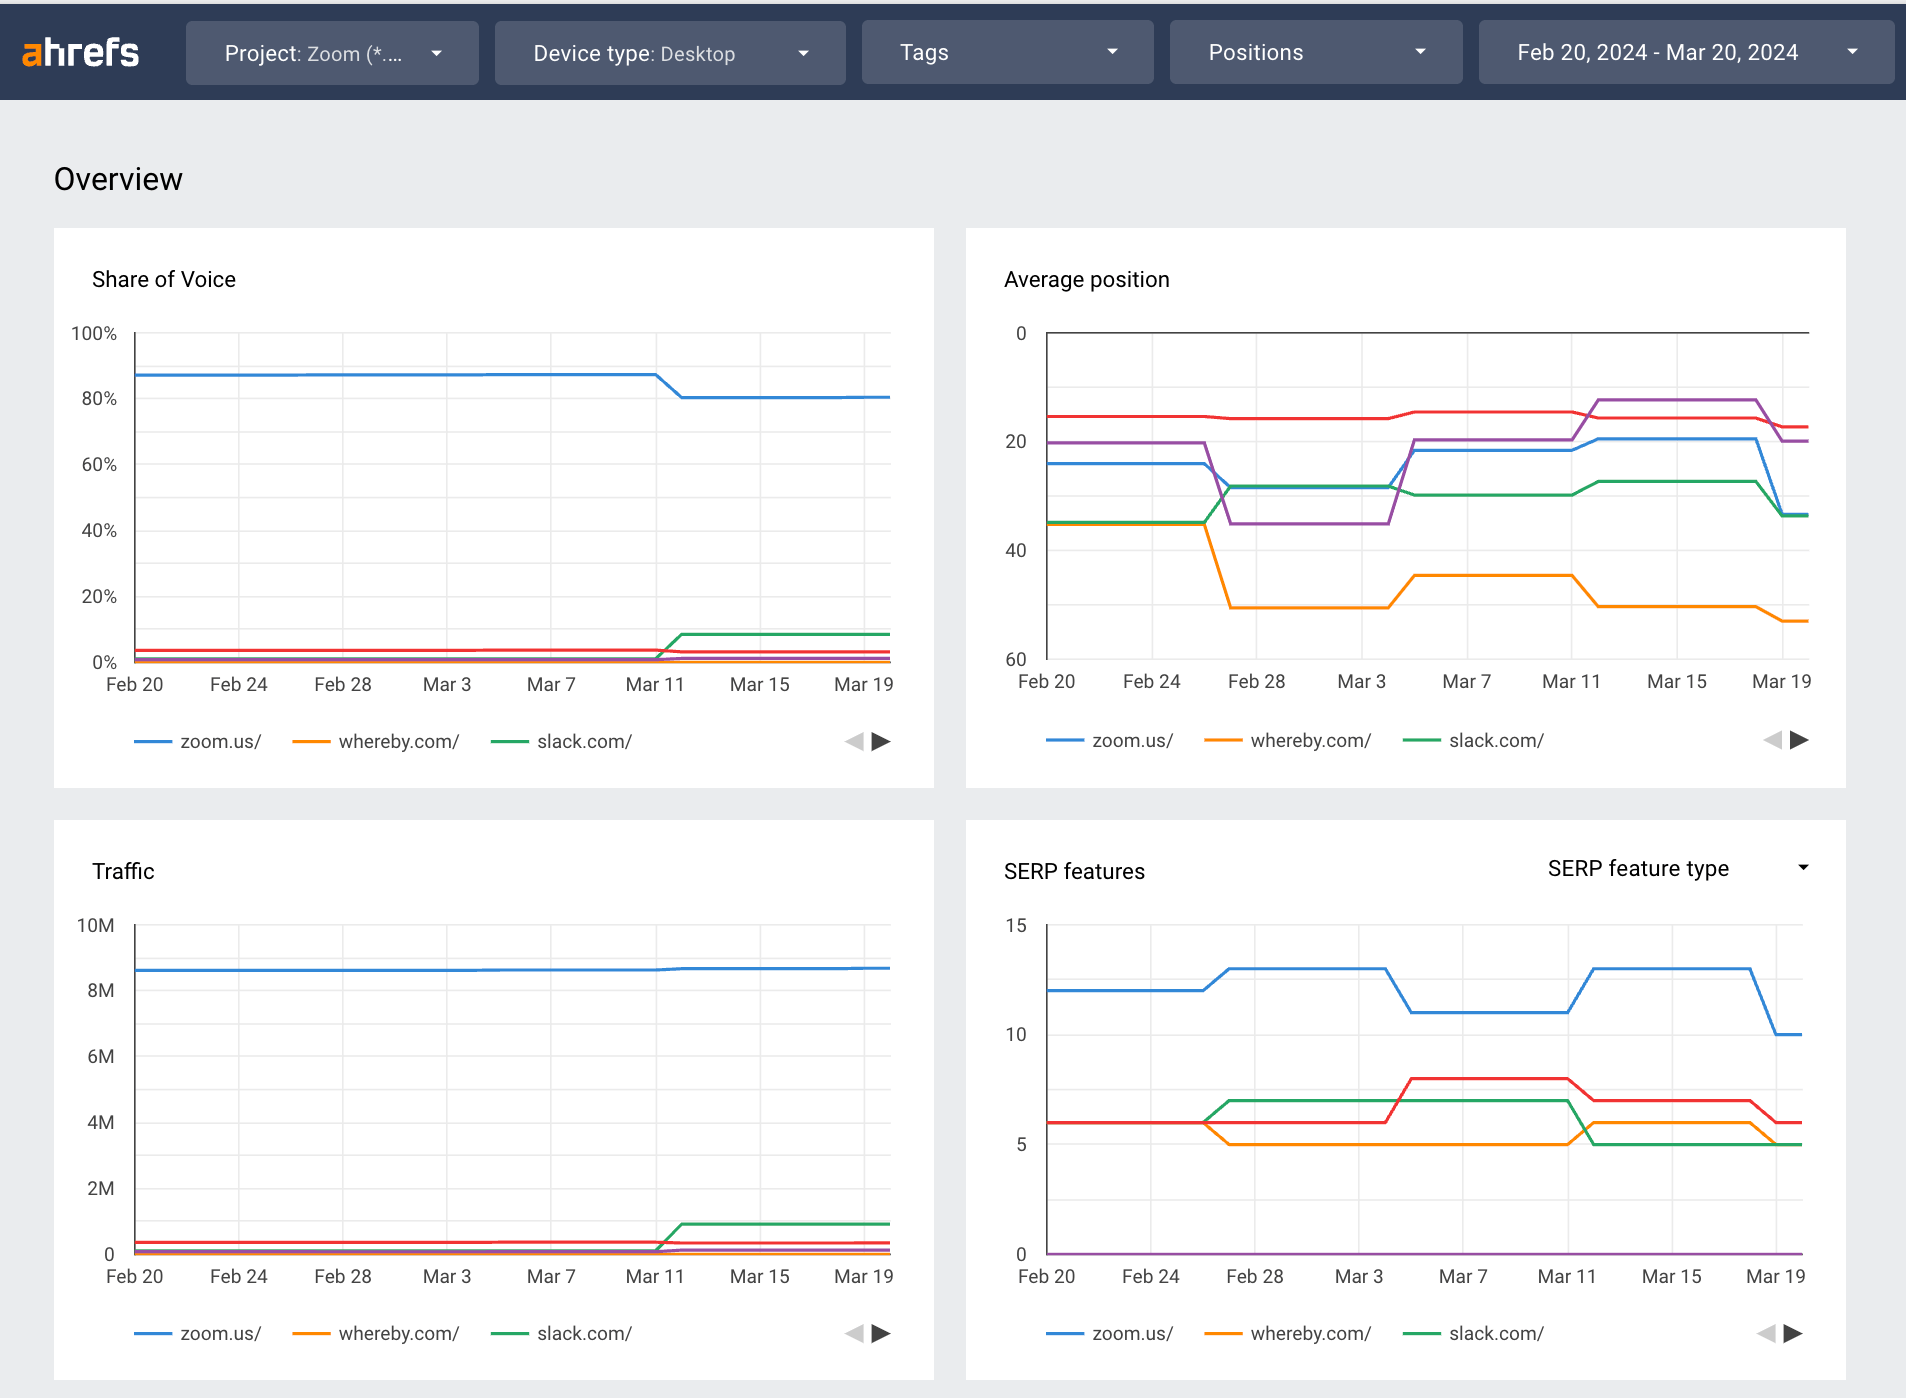
Example of a live dashboard created with Google Looker Studio.Example of a live dashboard created with Google Looker Studio.

On the other hand, in-house reports are typically about documenting performance and progress. They are much more streamlined. For example, the monthly blog report at Ahrefs is a short, public message on Slack with three types of information: the number of published articles, notable keyword movements, and any notable stuff. That’s it.

Streamlined in-house content report.Streamlined in-house content report.

In this part of the guide, we’re discussing content marketing KPIs and qualitative feedback that will allow you to build a solid report. These are based on our poll on metrics actually used by marketers and a few tried and tested suggestions from us.

Keep in mind that your final metrics may differ depending on your strategy. We encourage you to customize your reports.

Summaries are designed for stakeholders who just want to know the most important points. They may not have the time or the interest to dive into data and put together an overall picture of your performance. These people will be expecting something like this:

  • Content output: increased by 20%, with 20 new pieces published.
  • Traffic: rose by 35%, reaching 135,000 monthly visitors.
  • Keyword rankings: 50% of targeted keywords now in top 3 SERP positions.
  • Audience growth: expanded by 25%, now totaling 75,000.
  • Engagement: improved by 15% across all platforms.
  • Conversions: grew to 5%, resulting in an additional 50 sales.
  • Recommendations: we’re on the right track, and we’re ready to invest more in content scaling.

It’s a good practice to add summaries at all times, but you’ll find them especially useful in large teams and when working with clients.

Summaries are put in the front of the report but written last. Don’t write them before collecting and analyzing the data.

This section details the quantity and type of content published within a specific timeframe. This will tell your boss or client how efficient you/your team is.

It can include blog posts, videos, podcasts, infographics, and social media posts.

You can simply measure the volume of content produced and categorize it by type to assess productivity and diversity in your content strategy.

Traffic shows how good the content is at attracting clicks to the website.

Typically, stakeholders want to know the growth of traffic rather than just the number of clicks in a given period. A thousand more clicks in a month may be exceptional for one website but a poor result for another.

It’s also a good idea to break down traffic growth by:

  • Source: in the case of content, that will mostly be organic, email, referral (but only from the sources you influenced), and social media. Include direct traffic only if it actually correlates with content. Paid traffic is typically the domain of performance marketing, but if you’re running any ads for content, add that, too.
  • Target: this depends on whether your goal is to drive traffic to the entire site or its parts, such as product landing pages, pricing, contact, etc.

Traffic is easy to measure. Free tools such as Google Analytics or Matomo should be enough. For organic traffic from Google, make sure you use Google Search Console, though.

Tip

Google Search Console will give you the most accurate organic click data, but SEO tools like Ahrefs will give you the means to improve it. For example, you can see how a site stacks up against competitors (and break down their strategy) or see which pages gained and lost the most traffic in a given period.
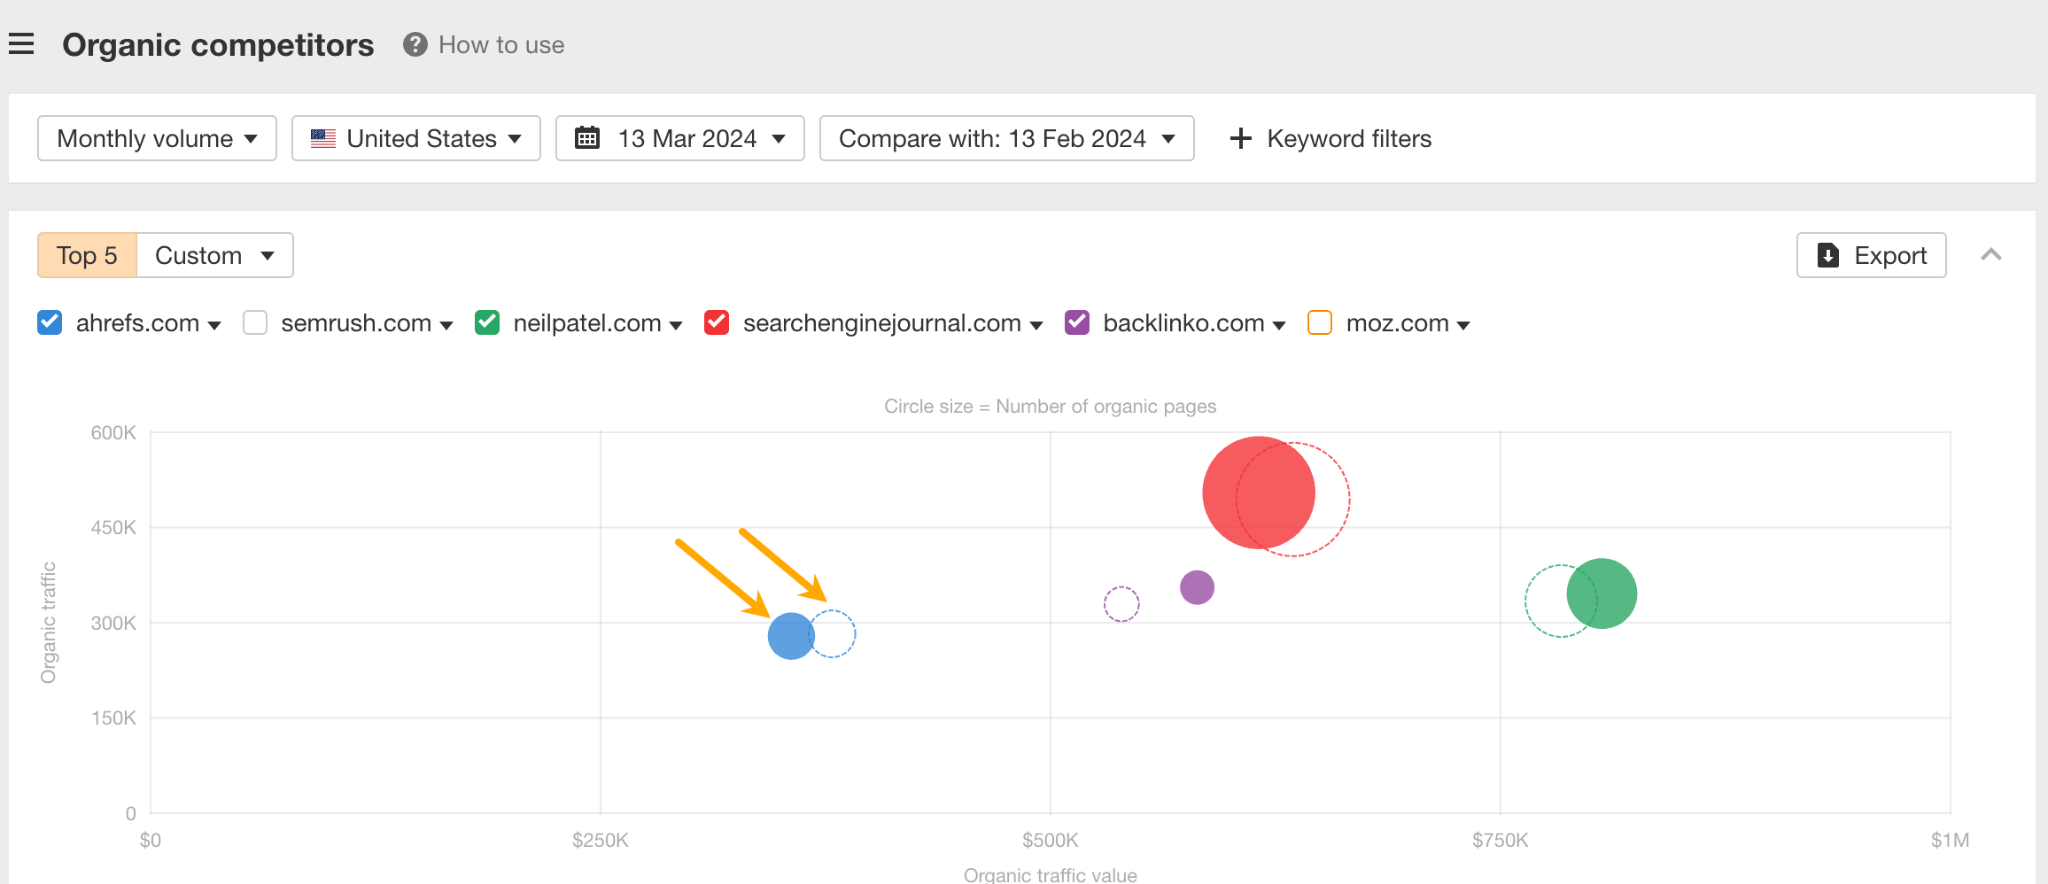
Organic competitors report from Ahrefs.Organic competitors report from Ahrefs.
Organic competitors report in Ahrefs showing a month-to-month performance change.

For traffic reporting, you will also find Ahrefs’ Portofilos feature helpful. You can track organic traffic and other SEO metrics for any collection of pages. For instance, a set of your client’s websites, competitors, or all content directories.
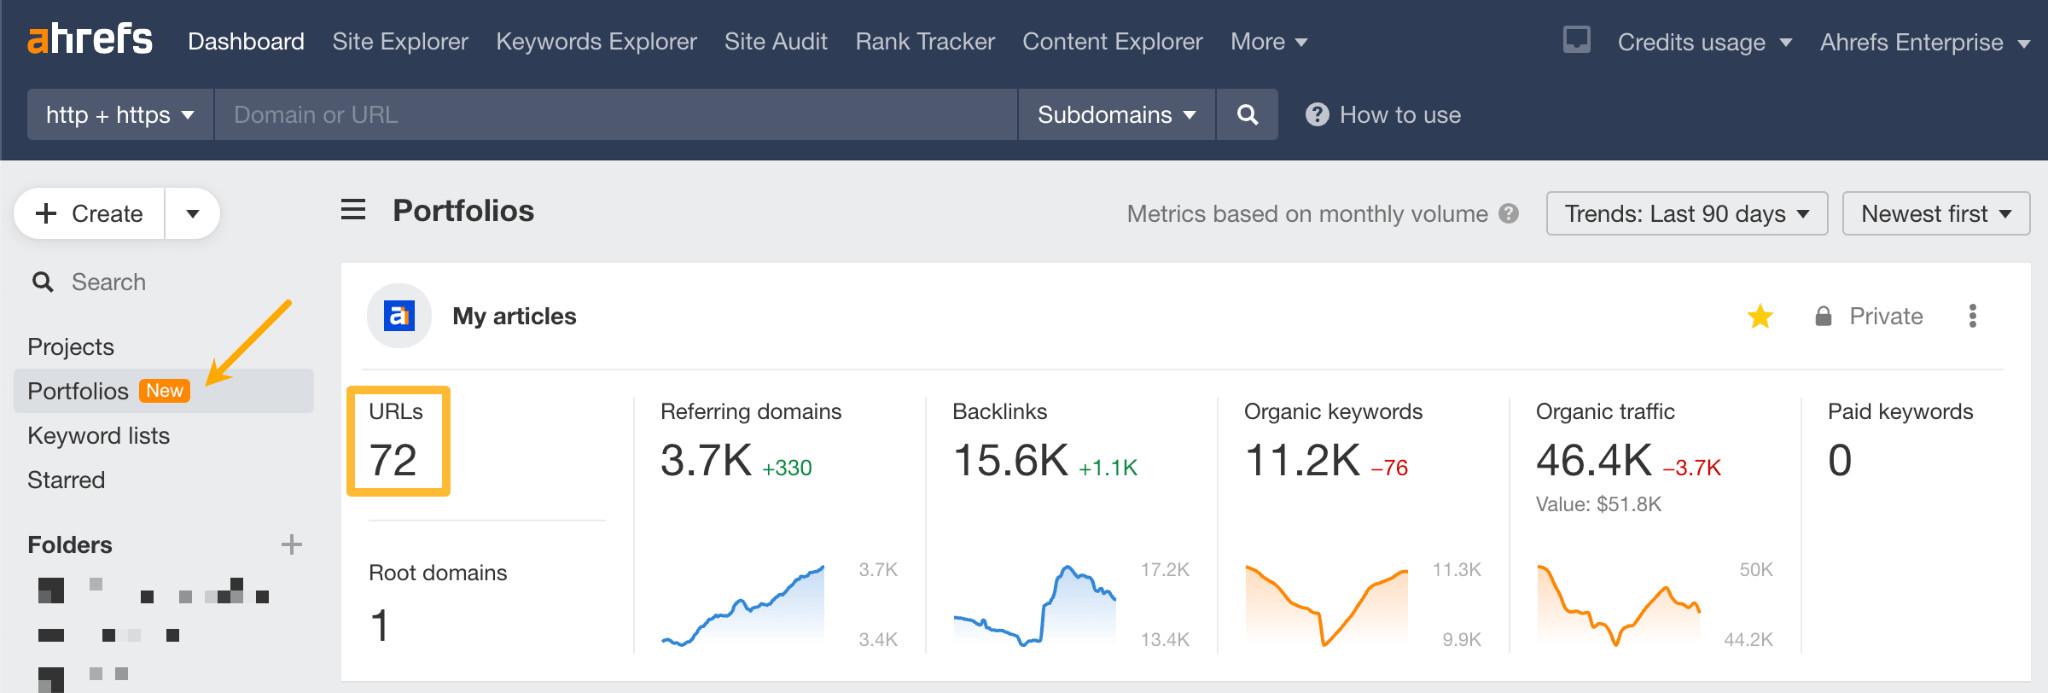
Portfolios feature from Ahrefs. Portfolios feature from Ahrefs.

SEO (search engine optimization) metrics help you understand the visibility and ranking of your content in search engines.

There is a variety of metrics you could report here, but according to our insights, marketers usually report these:

  • Impressions: how often a site appears in search results.
  • Rankings: what pages rank for a given keyword. The higher the rankings, the more organic traffic you can get.
  • Share of voice: percentage of all possible organic clicks (from SERPs) for the tracked keywords landing on your website.
  • Backlink growth: refers to the increase in the number of inbound links pointing to a website over a specific period. Worth tracking if you’re creating link bait content or doing link building.
  • Organic traffic: already covered in the previous paragraph. It overlaps with the SEO metrics category because, generally speaking, organic traffic growth is the outcome of effective SEO.

You’ll need two types of tools to report these metrics: Google Search Console for organic traffic (i.e., clicks) and impressions and an SEO tool like Ahrefs for everything else.

If you feel that the recipient of the report will be interested in top-level metrics only, consider reporting just the share of voice and organic traffic.
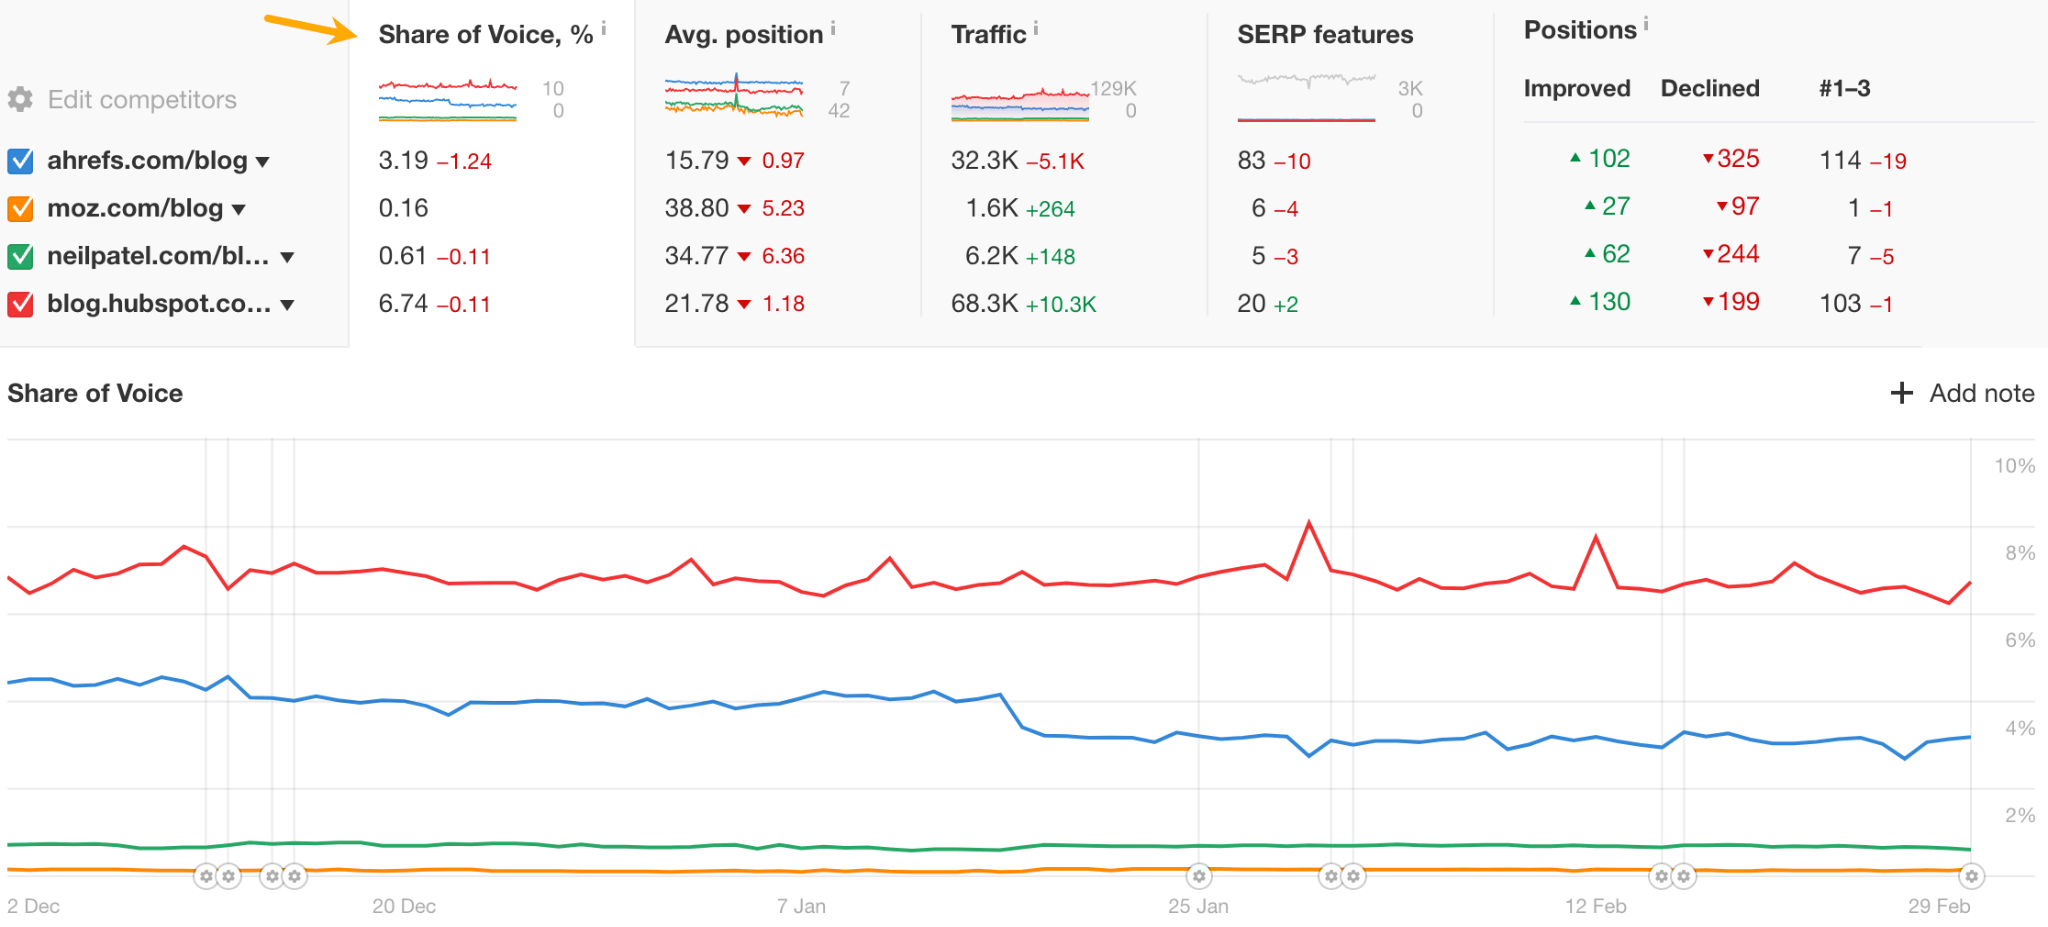
Organic share of voice report in Ahrefs. Organic share of voice report in Ahrefs.
You can find the share of voice metric in Ahrefs’ Rank Tracker.

The benefits of being visible in Google are obvious even for non-marketers, so you’ll send a clear and strong message if you prove with these metrics that your content makes the brand stand out in Google, and because of that, you’re able to attract more visitors.

On the other hand, if your audience is SEO-savvy and that channel is a big part of your strategy, you can make your report shine with additional metrics explained in this guide to SEO reporting.

This measures the increase in your content’s audience over time, including new subscribers to newsletters, video/podcast channels, and social media followers.

Tracking these metrics helps assess the effectiveness of your content in attracting and retaining a growing audience. In other words, audience growth shows the demand for more content like the one you’re already making.

For example, at Ahrefs, we track the subscriber growth on AhrefsTV YouTube channel, and we simply use YouTube’s native metrics for that.
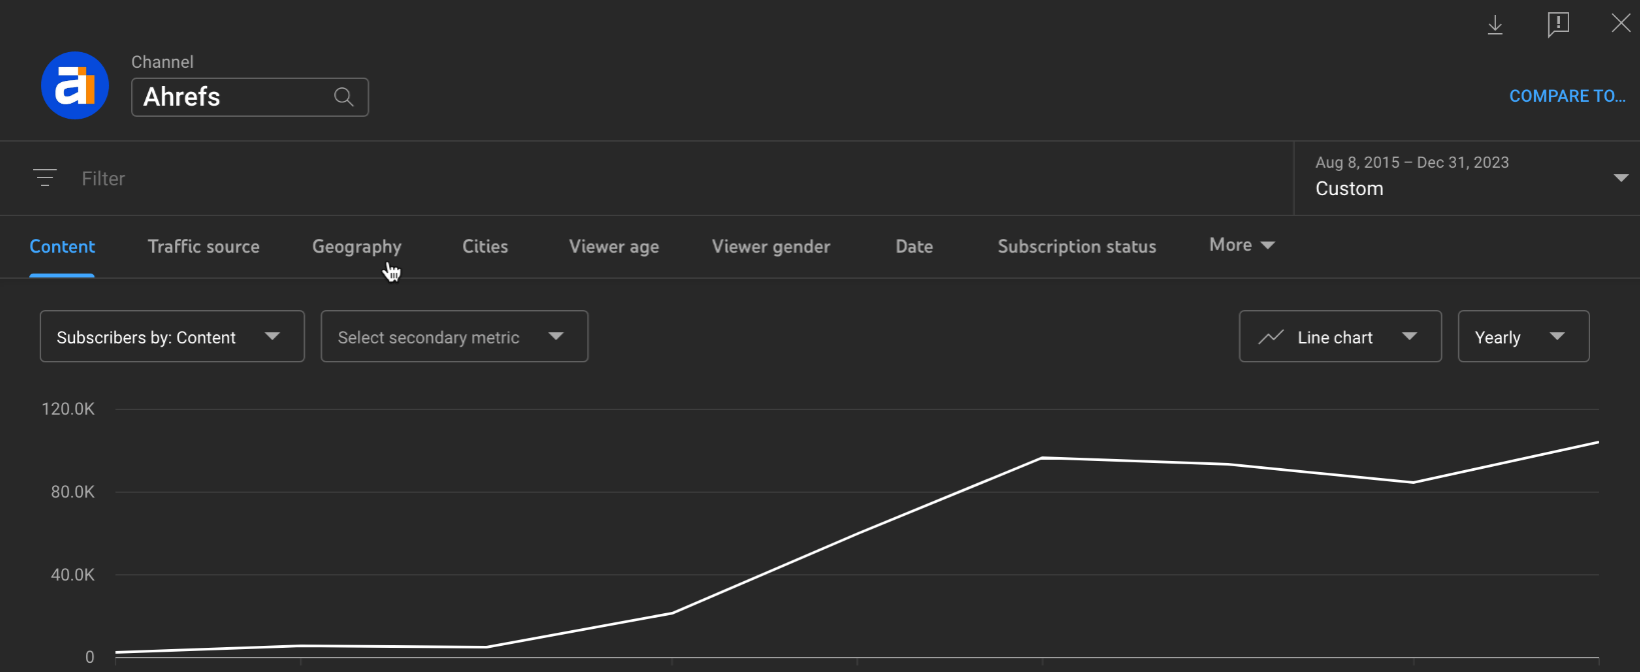
Audience growth data from YouTube.Audience growth data from YouTube.
An actual screenshot of our YouTube channel audience growth.

Engagement metrics gauge how actively your audience interacts with your content.

Here are some common engagement metrics tracked by marketers:

  • Likes and comments on social media: you can track them easily with native social media platform analytics or by using a tool like Buffer to collect all data in one place.
  • Email list engagement: these typically include how many people open your emails (open rate), how many click on the links inside them (click rate), and spikes in unsubscribe rate. All email marketing tools are equipped with these metrics.
  • Time on page: how long people spend reading or interacting with a specific page on your website. Tracked by default in GA4, needs setting up in Matomo.
  • Scroll depth: how far down a page a visitor scrolls. In many cases, deeper scrolling should indicate the content is engaging enough to keep readers interested. GA4 and Matomo can be set up to display an event when a pre-defined scroll threshold has been reached (e.g., 10, 25, 50%). But if you want a bit more data without the need to dabble with technicals, use Hotjar or Microsoft Clarity.
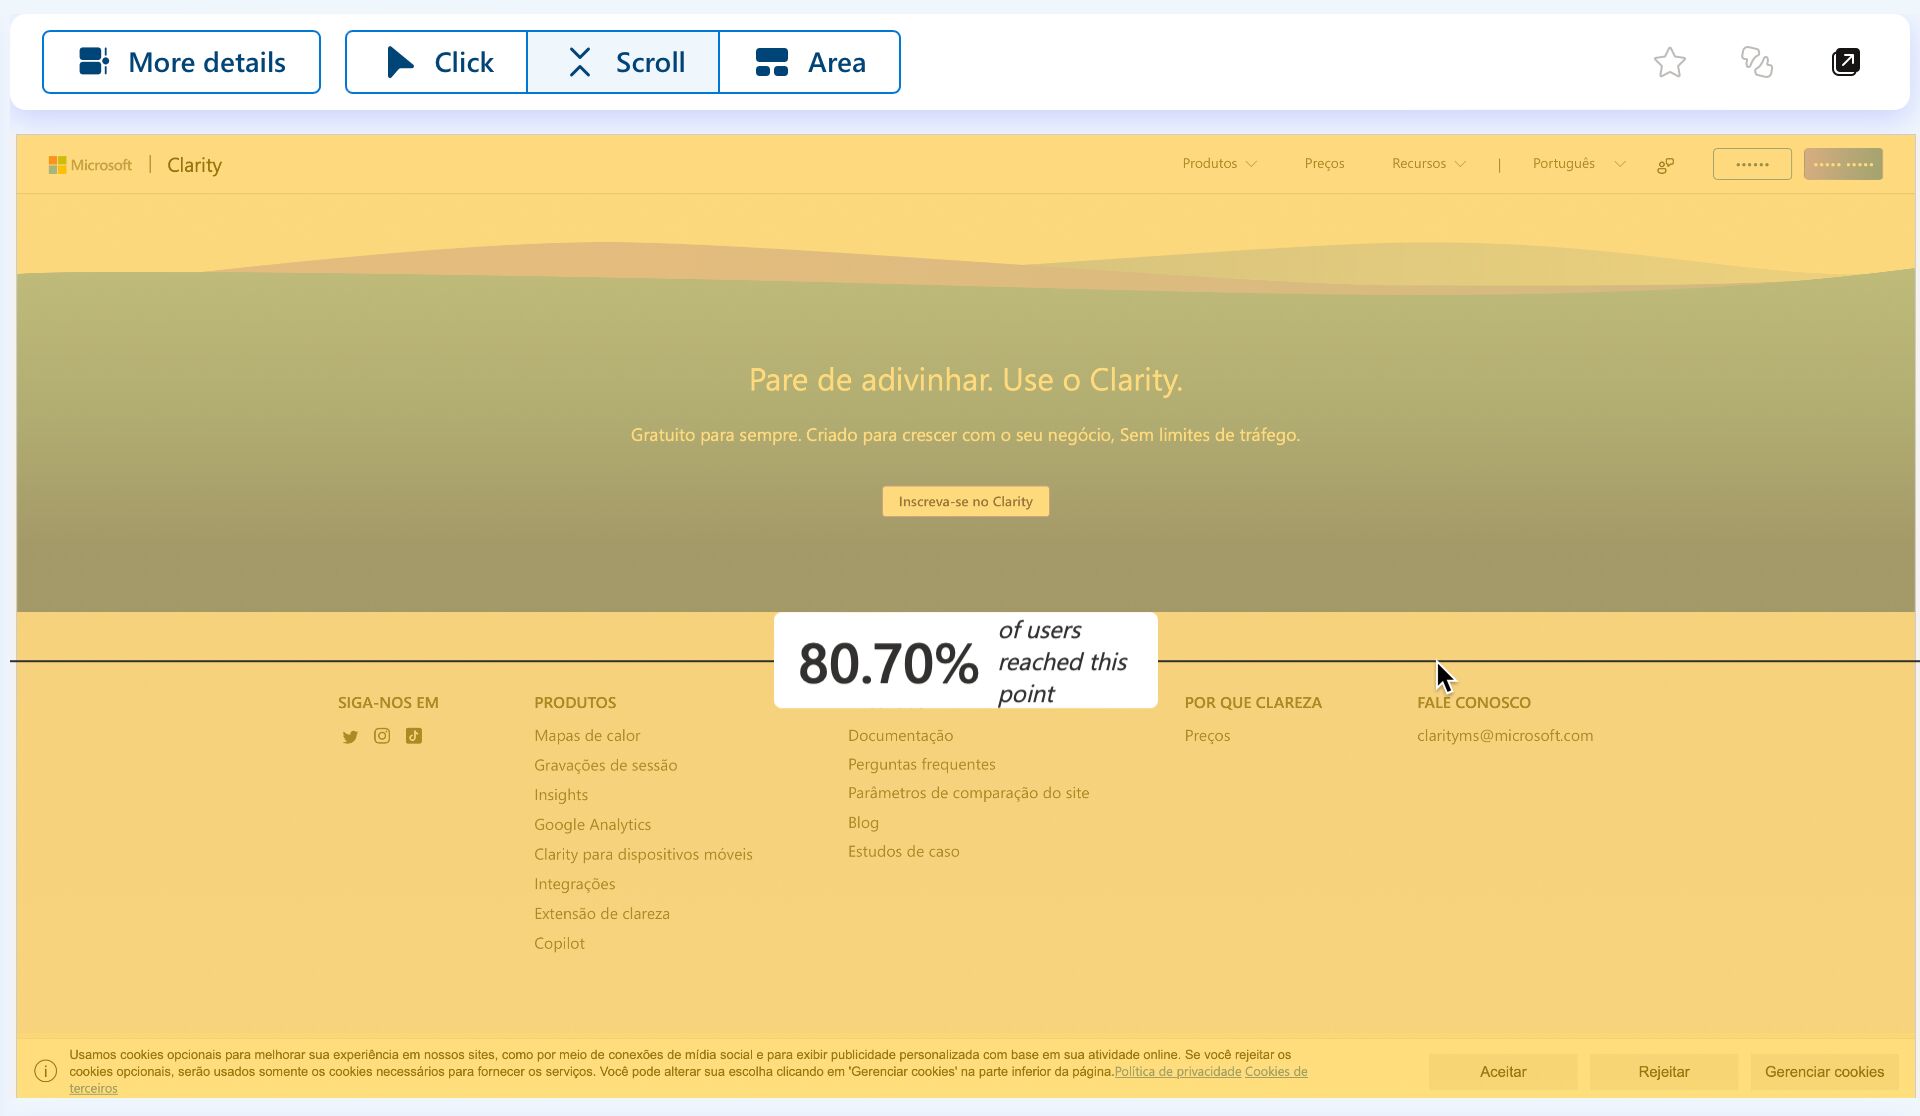
Microsoft Clarity - page scroll data. Microsoft Clarity - page scroll data.
Scroll depth report in Microsoft Clarity.

It’s almost never bad if you get high numbers on those metrics. In an ideal world, they indicate that people really enjoy your content, but in reality, these metrics are quite nuanced. For example, some types of content are less likely to get likes on social media, and a short time on page may mean that people found what they wanted and left immediately.

Therefore, it may be best to use engagement metrics in the right context.

  • Use likes and comments to compare content. You can also use it to gauge interest in new types of content or topics.
  • Use engagement rate on Twitter instead of total engagement: (Likes + retweets + replies) / (total number of followers)
  • Use scroll rate and time on page only for long-form content, i.e., pages meant to keep the user a bit longer.

Conversion metrics measure how effectively your content prompts users to take a desired action, such as signing up for a free trial.

Examples:

  • Revenue/signups correlation with traffic: the more people visit your site, the more opportunities to convert visitors into subscribers or paying customers.
  • Conversion growth from the bottom of the funnel content: conversion tracked only for visitors that may be considering buying (comparisons, white papers, customer success stories, etc.).
  • First page seen to paying customer: if your content is the first page a visitor has seen and then converted into a customer, that means the content works.
  • Content downloads: high download rates can signal that your audience finds your content valuable.
  • Leads: people who leave contact information in exchange for access to content. Marketers typically track MQLs (Marketing Qualified Leads) and SQLs (Sales Qualified Leads): people who have shown interest and may be ready to buy in the future and contacts who are likely ready to be contacted by the sales team.

Leads, downloads, and even revenue vs. traffic correlations are quite easy to track (and prove). Most tools that allow you to create a lead capture form will have built-in analytics, while esoteric data analysis stuff like correlation can be handled by ChatGPT in a breeze these days.
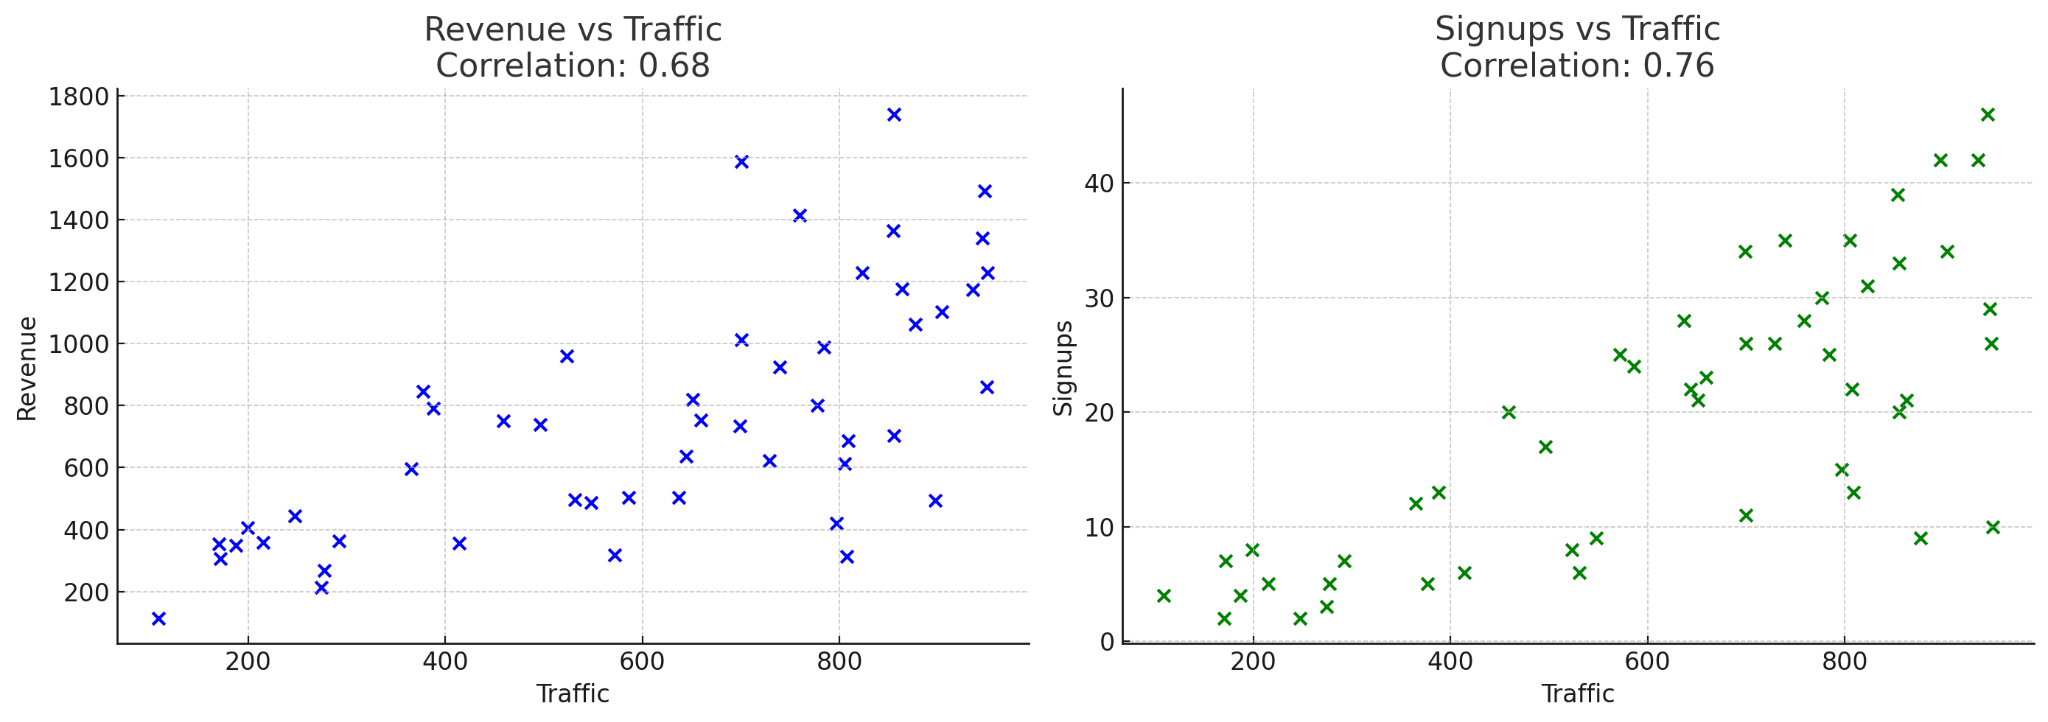
Example data analysis by ChatGPT.Example data analysis by ChatGPT.
 Correlation analysis done entirely by ChatGPT.

But if you want to prove that a specific piece of content generated X number of sales or Y amount of monthly recurring revenue, that’s going to be tricky. Essentially, you’ll be trying to prove the ROI of content marketing — something everybody wants to know, but nobody can really prove without using the word “probably”.

It’s very likely that the people who will read your report, or even yourself, might like to know the “return on investment”, so let’s stop here for a brief moment.

The problem with ROI in content marketing lies within imperfect attribution models and non-linear customer journeys. Ryan Law explains it in his guide to calculating content ROI:

Did someone convert because of an article or in spite of it? When they read multiple articles, which had the biggest impact? If someone buys because of an advert, should we still credit the blog post they read beforehand?

Ryan LawRyan Law

Customer journeys are also rarely as straightforward as we’d hope. One person might read 50 articles and never buy anything; another might read a single article, disappear for a year, and immediately buy. What role did content play in those journeys?

That said, the ROI of content is not a topic you should avoid. You basically have two choices here:

  • Try to calculate ROI by using imperfect but reasonable methods. Ryan explains three of them in his guide.
  • Assume positive content ROI based on its strategic role. Essentially, ROI is an excellent argument for pursuing content marketing, but it’s not the only one. Content marketing plays a strategic role because it has multiple benefits that are really hard to say “no” to. Think about it. If all competitors do content, can you afford to be the exception? In what other way will you demonstrate to the audience how the product/service solves their problems? If your boss or client doubts in the very idea of content, it’s a good idea to discuss it and manage expectations before you go all in.

Finally, finish your report with anything worth mentioning that goes beyond raw data or beyond the ordinary.

These could be:

  • Mentions in newsletters and other content roundups.
  • Social media praise.
  • Feedback on content quality from the audience.
  • Content mentioned by prospects in conversations.

For example, I use Ahrefs every month to find sites featuring my articles. This example shows two industry influencers linking to my recent SEO study.
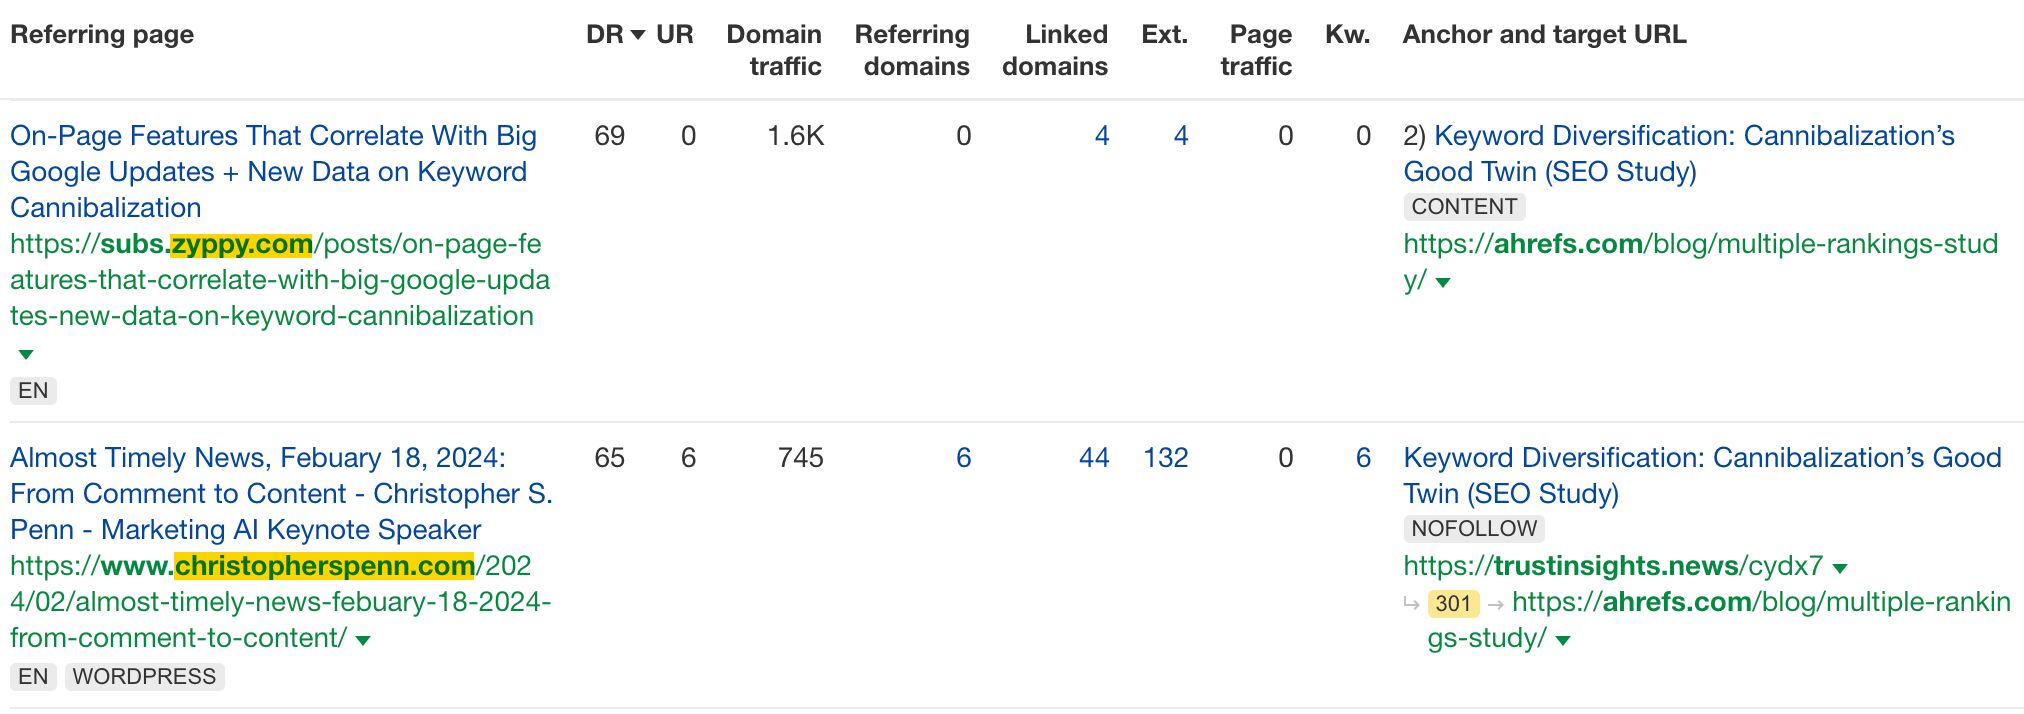
Backlink report in Ahrefs. Backlink report in Ahrefs.

This is also a good opportunity to mention operational feedback:

  • Roadblocks, like low availability of the design team.
  • Projections, for example, aiming to recover lost organic traffic by focusing on updating old content.
  • Opportunities for improvement, such as aligning content more closely with sales goals.

Final thoughts

No report can be effective without support from stakeholders. Rather than insisting on a specific report format, show a sample of the report, explain the value of it, and ask for feedback. You’re the expert, but they’re the client, so be open to finding a middle ground.

As for reporting frequency, the norm is monthly, quarterly, and annually. Additionally, reports may be prepared for specific campaigns, which can vary in duration. Again, this is something worth discussing with the recipient of the report.

Got questions or comments? Let me know on X or LinkedIn.


Source link

Keep an eye on what we are doing
Be the first to get latest updates and exclusive content straight to your email inbox.
We promise not to spam you. You can unsubscribe at any time.
Invalid email address

SEO

GraphRAG Is A Better RAG And Now It’s Free

Published

on

By

GraphRAG

Microsoft is making publicly available a new technology called GraphRAG, which enables chatbots and answer engines to connect the dots across an entire dataset, outperforming standard Retrieval-Augmented Generation (RAG) by large margins.

What’s The Difference Between RAG And GraphRAG?

RAG (Retrieval-Augmented Generation) is a technology that enables an LLM to reach into a database like a search index and use that as a basis for answering a question. It can be used to bridge a large language model and a conventional search engine index.

The benefit of RAG is that it can use authoritative and trustworthy data in order to answer questions. RAG also enables generative AI chatbots to use up to date information to answer questions about topics that the LLM wasn’t trained on. This is an approach that’s used by AI search engines like Perplexity.

The upside of RAG is related to its use of embeddings. Embeddings is a way of representing the semantic relationships between words, sentences, and documents. This representation enables the retrieval part of RAG to match a search query to text in a database (like a search index).

But the downside of using embeddings is that it limits the RAG to matching text at a granular level (as opposed to a global reach across the data).

Microsoft explains:

“Since naive RAG only considers the top-k most similar chunks of input text, it fails. Even worse, it will match the question against chunks of text that are superficially similar to that question, resulting in misleading answers.”

The innovation of GraphRAG is that it enables an LLM to answer questions based on the overall dataset.

What GraphRAG does is it creates a knowledge graph out of the indexed documents, also known as unstructured data. The obvious example of unstructured data are web pages. So when GraphRAG creates a knowledge graph, it’s creating a “structured” representation of the relationships between various “entities” (like people, places, concepts, and things) which is then more easily understood by machines.

GraphRAG creates what Microsoft calls “communities” of general themes (high level) and more granular topics (low level). An LLM then creates a summarization of each of these communities, a “hierarchical summary of the data” that is then used to answer questions. This is the breakthrough because it enables a chatbot to answer questions based more on knowledge (the summarizations) than depending on embeddings.

This is how Microsoft explains it:

“Using an LLM to summarize each of these communities creates a hierarchical summary of the data, providing an overview of a dataset without needing to know which questions to ask in advance. Each community serves as the basis of a community summary that describes its entities and their relationships.

…Community summaries help answer such global questions because the graph index of entity and relationship descriptions has already considered all input texts in its construction. Therefore, we can use a map-reduce approach for question answering that retains all relevant content from the global data context…”

Examples Of RAG Versus GraphRAG

The original GraphRAG research paper illustrated the superiority of the GraphRAG approach in being able to answer questions for which there is no exact match data in the indexed documents. The example uses a limited dataset of Russian and Ukrainian news from the month of June 2023 (translated to English).

Simple Text Matching Question

The first question that was used an example was “What is Novorossiya?” and both RAG and GraphRAG answered the question, with GraphRAG offering a more detailed response.

The short answer by the way is that “Novorossiya” translates to New Russia and is a reference to Ukrainian lands that were conquered by Russia in the 18th century.

The second example question required that the machine make connections between concepts within the indexed documents, what Microsoft calls a “query-focused summarization (QFS) task” which is different than a simple text-based retrieval task. It requires what Microsoft calls, “connecting the dots.”

The question asked of the RAG and GraphRAG systems:

“What has Novorossiya done?”

This is the RAG answer:

“The text does not provide specific information on what Novorossiya has done.”

GraphRAG answered the question of “What has Novorossiya done?” with a two paragraph answer that details the results of the Novorossiya political movement.

Here’s a short excerpt from the two paragraph answer:

“Novorossiya, a political movement in Ukraine, has been involved in a series of destructive activities, particularly targeting various entities in Ukraine [Entities (6494, 912)]. The movement has been linked to plans to destroy properties of several Ukrainian entities, including Rosen, the Odessa Canning Factory, the Odessa Regional Radio Television Transmission Center, and the National Television Company of Ukraine [Relationships (15207, 15208, 15209, 15210)]…

…The Office of the General Prosecutor in Ukraine has reported on the creation of Novorossiya, indicating the government’s awareness and potential concern over the activities of this movement…”

The above is just some of the answer which was extracted from the limited one-month dataset, which illustrates how GraphRAG is able to connect the dots across all of the documents.

GraphRAG Now Publicly Available

Microsoft announced that GraphRAG is publicly available for use by anybody.

“Today, we’re pleased to announce that GraphRAG is now available on GitHub, offering more structured information retrieval and comprehensive response generation than naive RAG approaches. The GraphRAG code repository is complemented by a solution accelerator, providing an easy-to-use API experience hosted on Azure that can be deployed code-free in a few clicks.”

Microsoft released GraphRAG in order to make the solutions based on it more publicly accessible and to encourage feedback for improvements.

Read the announcement:

GraphRAG: New tool for complex data discovery now on GitHub

Featured Image by Shutterstock/Deemerwha studio

Source link

Keep an eye on what we are doing
Be the first to get latest updates and exclusive content straight to your email inbox.
We promise not to spam you. You can unsubscribe at any time.
Invalid email address
Continue Reading

SEO

WordPress Takes A Bite Out Of Plugin Attacks

Published

on

By

WordPress Ends Plugin Supply Chain Attacks

WordPress announced over the weekend that they were pausing plugin updates and initiating a force reset on plugin author passwords in order to prevent additional website compromises due to the ongoing Supply Chain Attack on WordPress plugins.

Supply Chain Attack

Hackers have been attacking plugins directly at the source using password credentials exposed in previous data breaches (unrelated to WordPress itself). The hackers are looking for compromised credentials used by plugin authors who use the same passwords across multiple websites (including passwords exposed in a previous data breach).

WordPress Takes Action To Block Attacks

Some plugins have been compromised by the WordPress community has rallied to clamp down on further plugin compromises by instituting a forced password reset and encouraging plugin authors to use 2 factor authentication.

WordPress also temporarily blocked all new plugin updates at the source unless they received team approval in order to make sure that a plugin is not being updated with malicious backdoors. By Monday WordPress updated their post to confirm that plugin releases are no longer paused.

The WordPress announcement on the forced password reset:

“We have begun to force reset passwords for all plugin authors, as well as other users whose information was found by security researchers in data breaches. This will affect some users’ ability to interact with WordPress.org or perform commits until their password is reset.

You will receive an email from the Plugin Directory when it is time for you to reset your password. There is no need to take action before you’re notified.”

A discussion in the comments section between a WordPress community member and the author of the announcement revealed that WordPress did not directly contact plugin authors who were identified as using “recycled” passwords because there was evidence that the list of users found in the data breach list whose credentials were in fact safe (false positives). WordPress also discovered that some accounts that were assumed to be safe were in fact compromised (false negatives). That is what led to to the current action of forcing password resets.

Francisco Torres of WordPress answered:

“You’re right that specifically reaching out to those individuals mentioning that their data has been found in data breaches will make them even more sensitive, but unfortunately as I’ve already mentioned that might be inaccurate for some users and there will be others that are missing. What we’ve done since the beginning of this issue is to individually notify those users that we’re certain have been compromised.”

Read the official WordPress announcement:

Password Reset Required for Plugin Authors

Featured Image by Shutterstock/Aleutie

Source link

Keep an eye on what we are doing
Be the first to get latest updates and exclusive content straight to your email inbox.
We promise not to spam you. You can unsubscribe at any time.
Invalid email address
Continue Reading

SEO

Top 10 Digital Marketing Trends For 2024

Published

on

By

Top 10 Digital Marketing Trends For 2024

It’s been a year of considerable disruptions in digital marketing so far.

Right now, the industry is dealing with the integration of generative AI and the impact this is going to have on user behaviour and how people search. Alongside the relentless updates that Google keeps throwing at us.

SEO is changing and the industry is trying to adapt whilst accepting the uncertainty.

But, it’s not all catastrophic, there is a lot of opportunity ahead for those that can evolve to embrace the new.

To help marketers and brands thrive amidst uncertainty, I’ve outlined trends to focus on, guided by strategic insights and Yogi Berra’s timeless wisdom,

“Predictions are hard, especially about the future.” – Yogi Berra

Digital marketers can no doubt relate to Yogi’s sentiment, acknowledging the challenge of what lies ahead.

These, then, are the top 10 digital marketing trends for 2024:

1. Strategy: “If You Don’t Know Where You Are Going, You Might Wind Up Someplace Else.”

Why is “strategy” this year’s top trend instead of the latest technology?

Well, as Yogi once observed, “If you don’t know where you are going, you might wind up someplace else.”

According to Spencer Stuart’s 2024 CMO Tenure Study, the average tenure of chief marketing officers (CMOs) at Fortune 500 companies in 2023 was 4.2 years.

The study also found the average tenure of CMOs at B2B companies was 4.5 years. It was 4.0 years for CMOs at B2C companies. And it was just 3.1 years at the consumer-heavy top 100 advertisers.

So, developing a digital marketing strategy that will generate above-average results within a couple of years is the key to keeping your job as the CMO of a big brand.

And if you don’t master the art and science of creating a digital marketing strategy that generates business outcomes, then you won’t land one of the CMO jobs that turn over each year.

In other words, learning to use the latest technology is necessary, but it won’t get digital marketing leaders and executives where they want to go.

2. Generative AI: “Predictions Are Hard, Especially About The Future.”

Yogi also said, “Predictions are hard, especially about the future.” So, it’s tempting to ask generative AI tools to predict their own future.

OpenAI’s ChatGPT 3.5 says:

“AI and machine learning have been transforming digital marketing for years, but 2024 is poised to see these technologies become even more integral. From chatbots and predictive analytics to personalized content and ad targeting, AI will enhance customer experiences and drive efficiency. Brands leveraging AI can expect to see improved ROI and deeper customer insights.”

Google’s Gemini (formerly Bard) says:

“It ain’t science fiction anymore. Artificial intelligence (AI) is taking center stage, from crafting personalized chatbots that convert like crazy to optimizing campaigns with laser precision. Don’t fear the robot takeover, embrace it!”

And Anthropic’s Claude 3 says:

“Artificial intelligence writing assistants like Claude have been making waves, and in 2024 we’ll see these tools become ubiquitous in content marketing. They’ll help scale content creation while maintaining quality.”

But AI can’t see the big picture for your organization. It can’t empathize with people. And it can’t be creative like you. So, AI needs you in the driver’s seat to make it work effectively.

3. SEO: “It Ain’t Over Till It’s Over.”

Some pundits think SEO is dead. But as Yogi declared, “It ain’t over till it’s over.”

That’s because SEO pros have the remarkable ability to adapt to constant change or new information. Often, this means adjusting to the latest Google algorithm updates. But this also includes rethinking strategies based on the recent Google API “leak.”

Now, Rand Fishkin and Mike King were the first to report on the leaked documents. Although Google has officially acknowledged that these internal documents are authentic, it has also cautioned against jumping to conclusions based on the leaked files alone.

What should savvy SEO pros do?

Well, I’ve known Fishkin for more than 20 years. And he has the experience, expertise, authoritativeness, and trustworthiness (E-E-A-T) you’ve heard about.

So, I’m going to follow Fishkin’s recommendations, including:

  • Hire writers with established reputational authority that Google already associates with quality content.
  • Supplement link-building with public relations to increase branded search demand. (I’ll say more on this below.)
  • “Think about SEO as being more geographically specific than you think it is even for web search results.”
  • Move beyond parsing Google’s public statements and embrace experimentation and testing to uncover what produces results.

4. Link Building: “Always Go To Other People’s Funerals; Otherwise, They Won’t Go To Yours.”

I spotted this trend a long time ago, and I spoke about it at SES London 2009 in a session titled, “Beyond Linkbait: Getting Authoritative Mentions Online.”

Back then, I said link bait tactics can be effective “if you focus on the underlying quality as well as ingenuity needed to get other websites to link to you.”

I also provided a couple of case studies that showed British SEO professionals how to “approach journalists, bloggers, and other authoritative sources to enhance your company’s online reputation, whether or not you get links.”

But getting authoritative mentions without links didn’t translate. People on the other side of the pond thought I was saying something unintentionally funny like, “Always go to other people’s funerals; otherwise, they won’t go to yours.”

Hopefully, Fishkin’s recommendation will enable a lot more SEO pros to finally understand the underlying wisdom of supplementing link building with public relations.

As he clearly explained at MozCon, “If you get a whole bunch of links in one day and nothing else, guess what? You manipulated the link graph. If you’re really a big brand, people should be talking about you.”

5. Paid Media: “It’s Déjà Vu All Over Again.”

Everyone knows that Google, Meta, and other paid media are adding AI to their advertising platforms faster than the speed of sound. So, this might be mistaken as background noise.

But I’ve spotted the signal in the noise. Today’s frenzy to provide AI solutions is remarkably like the frenzy to provide programmatic solutions a decade ago. As Yogi said, “It’s déjà vu all over again.”

This means that digital marketers – and their agencies – can quickly refresh their “programmatic” workflow and turn it into “AI” best practices.

For example, Google touted a five-step programmatic workflow five years ago.

It consisted of:

  • Organize audience insights.
  • Design compelling creative.
  • Execute with integrated technology.
  • Reach audiences across screens.
  • Measure the impact.

Why is today’s process of buying and selling digital media in an automated fashion so similar? Because AI is just fulfilling the early promise of programmatic to engage with consumers in the moments that matter most.

But there’s one significant difference between then and now.

As you’ll read below, it’s the improved ability to integrate your advertising platforms with your analytics platform to measure the impact of campaigns on brand awareness and lead generation.

6. Analytics: “You Can Observe A Lot By Watching.”

Performance marketers integrated their advertising platforms with their analytics platform more than a decade ago to measure the impact of their campaigns on “conversions.”

But brand marketers rarely focused on their analytics data because “brand awareness” was something they measured when consumers initially saw their display ads or watched their video ads.

A funny thing happened after Google Analytics 4 rolled out last summer. A “Business objectives” collection replaced the “Life cycle” collection of reports and one business objective you can now track is “Raise brand awareness.”

For example, brand marketers can now use traffic acquisition, demographic details, user acquisition, as well as which pages and screens users visit to measure brand awareness in places that are less vulnerable to ad fraud.

Another business objective you can now track is “Generate leads.”

So, digital marketers can measure any user action that’s valuable to their organization, including:

  • Scrolling to 90% or more of their blog post.
  • Downloading a whitepaper.
  • Subscribing to their newsletter.
  • Playing at least 50% of a product video.
  • Completing a tutorial.
  • Submitting a registration form.

And as Yogi noted, “You can observe a lot by watching.”

7. Content Marketing: “When You Come To A Fork In The Road, Take It.”

In the summer of 2020, the Content Marketing Institute and MarketingProfs fielded their annual survey and found that “Content marketers are resilient. Most have met the challenges of the pandemic head-on.”

In response to the pandemic, B2B and B2C marketers:

  • Increased time spent talking with customers.
  • Revisited their customer/buyer personas.
  • Re-examined the customer journey.
  • Changed their targeting/messaging strategy.
  • Changed their distribution strategy.
  • Adjusted their editorial calendar.
  • Put more resources toward social media/online communities.
  • Changed their website.
  • Changed their products/services.
  • Adjusted their key performance indicators (KPIs).
  • Changed their content marketing metrics (e.g., set up new analytics/dashboards).

In other words, many content marketers totally overhauled their process for creating a content marketing plan from stem to stern.

For some, 2020 was the year of quickly adapting their content marketing strategy. For others, it was the year to finally develop one.

According to BrightEdge, content marketers are now “preparing for a Searchquake,” a tectonic shift in the content marketing landscape triggered by Google’s Search Generative Experiences (SGE).

But content marketers now know exactly what to do. As Yogi directed, “When you come to a fork in the road, take it.”

8. Video Creation: “If You Can’t Imitate Him, Don’t Copy Him.”

I teach an online class at the New Media Academy in Dubai on “Influencer Marketing and AI.” This may seem like an odd combination of topics, but they’re related to another class I teach on “Engaging Audiences through Content.”

I tell my students that creating great content is hard. That’s why marketers start using influencers or AI to create video content that their audience will find valuable and engaging. Then, they learn that there’s more to learn.

For example, AI can create realistic and imaginative scenes from text instructions. But AI can’t be creative like humans. So, the heart of every great video is still innovative, surprising, human-led creativity.

I show them “OpenAI Sora’s first short film – ‘Air Head,’ created by shy kids,” a Toronto-based production company.

Then, I ask them to apply what they have learned by using Synthesia, Runway, or invideo AI to generate a short video for their capstone project.

Invariably, they report that AI video generators can create realistic and imaginative scenes from text instructions but aren’t creative like shy kids.

Or, as Yogi put it, “If you can’t imitate him, don’t copy him.”

9. Influencer Marketing: “Nobody Goes There Anymore. It’s Too Crowded.”

The Influencer Marketing Hub says, “Most marketers believe that finding and selecting the best, most relevant influencers to be the most difficult part of influencer marketing.”

That’s ironic because HypeAuditor offers an influencer discovery platform that enables marketers to search through a database of 137.5 million influencers on Instagram, YouTube, TikTok, X (formerly Twitter), and Twitch.

It also enables marketers to apply filters to discover the perfect partners for their brand.

This apparent contradiction reminds me of Yogi’s comment, “Nobody goes there anymore. It’s too crowded.”

But it also indicates that most marketers are looking at influencer identification through the wrong end of the telescope. What should they do instead?

Well, I show the students in my “Influencer Marketing and AI” class how to use SparkToro to get a free report on the audience that searches for “Dubai.”

Image from SparkToro, June 2024


SparkToro estimates that 446,000 to 654,000 people search for “Dubai” monthly. And it uncovers the websites they visit, the keywords they search for, and their gender demographics.

Screenshot of a list showing accounts related to Dubai, their affinity scoresImage from SparkToro, June 2024


SparkToro also identifies the sources of influence for this audience, including high-affinity accounts and hidden gems, so marketers can invest in the right ones.

10. Social Media: “The Future Ain’t What It Used To Be.”

I’m a big believer in “the rule of three.”

So, I wasn’t startled when I received an email from Jennifer Radke inviting me to attend “an exciting webinar focused on a high-level look into using ChatGPT for social media!”

But I was shocked when Katie Delahaye Paine shared a link to new research by Asana’s Work Innovation Lab and Meltwater, which found that “only 28% of marketing professionals have received training on how to use AI tools effectively.”

I was also horrified when I read a column by Mark Ritson in MarketingWeek that argued, “AI’s strength is automating high-volume, short-term marketing activity, which means social media could become a cesspool of synthetic content.”

Hey, I was having lunch with Chris Shipley in 2004 when she coined the term “social media.” So, I remember when social media still had a promising future.

But, as Yogi once declared, “The future ain’t what it used to be.”

So, social media marketing has three options:

  • They can get upskilled to use AI tools more effectively.
  • They can get reskilled to identify the right influencers.
  • They can update their resumes and look for new jobs.

Picking Digital Marketing Trends Is Like Playing Moneyball

Some skeptics may question this counter-intuitive lineup of the top 10 digital marketing trends for 2024. Some of my selections seem to throw out conventional wisdom.

I recently watched the movie Moneyball (2011) for a second time. I was reminded that the Oakland Athletics baseball team’s general manager, Billy Beane (Brad Pitt), and assistant general manager, Peter Brand (Jonah Hill), used sabermetrics to analyze players.

This produced an epiphany: Picking digital marketing trends is like playing Moneyball. If you want to win against competitors with bigger budgets, then you need to find strategic insights, critical data, tactical advice, and digital marketing trends that conventional wisdom has overlooked.

And where did I come up with the whimsical idea of matching each trend with one of Yogi’s memorable quotes? Was it inspiration or hallucination?

I recently watched the documentary It Ain’t Over (2022) for the first time. It’s about New York Yankee Hall of Fame catcher Yogi Berra. And it supported Yogi’s claim, “I really didn’t say everything I said.”

But sportswriters kept attributing these Yogi-isms to the catcher because these “distilled bits of wisdom … like good country songs … get to the truth in a hurry,” as Allan Barra, the author of a book on Yogi, has explained.

And that strategic insight produced this year’s update – by a human – as opposed to last year’s top 10 digital marketing trends by ChatGPT.

More resources:


Featured Image: SuPatMaN/Shutterstock

Source link

Keep an eye on what we are doing
Be the first to get latest updates and exclusive content straight to your email inbox.
We promise not to spam you. You can unsubscribe at any time.
Invalid email address
Continue Reading

Trending