SEO
Key Insights To Inform Your 2023 Strategy

The future looks bright for in-house SEO professionals, despite coming out of a long period of uncertainty with frequent algorithm changes and layoffs.
Recent trends show that businesses are increasingly looking to integrate SEO into their broader marketing efforts, and in-house SEO pros are commanding competitive salaries.
But that doesn’t mean the industry is without its setbacks – in-house SEO professionals still face a unique set of challenges within the field.
And if you’re looking to set your strategy for next year, you need to know what they are and how they can impact your efforts.
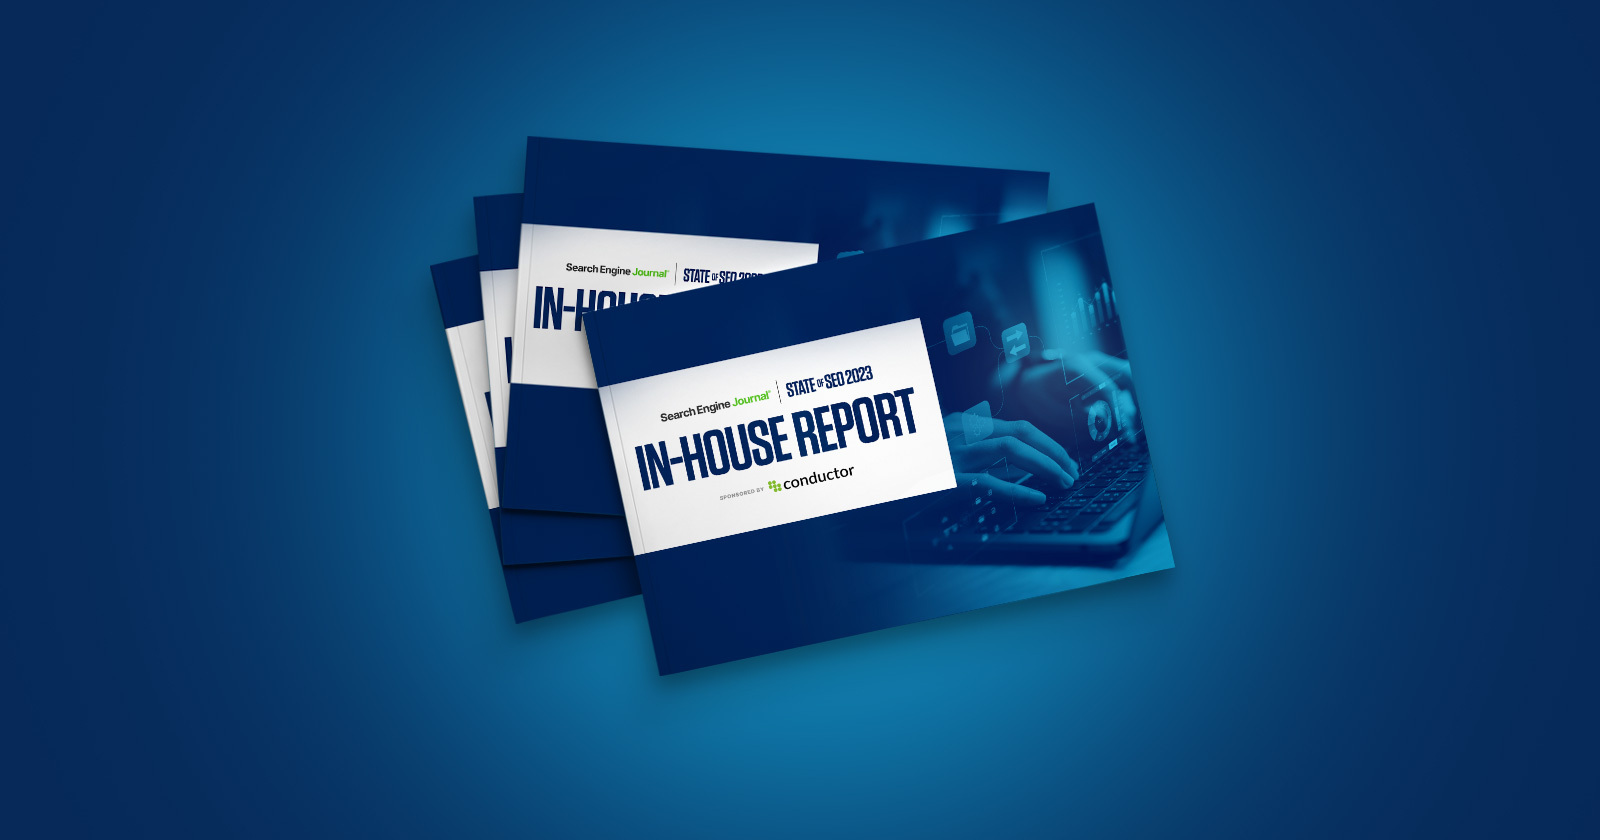
Luckily, our State Of SEO breakout report has all the in-house SEO insights you need to get ahead.
Inside, you’ll find loads of first-party data to inform your SEO strategy and boost your department’s performance in 2023.
We’ve gathered information from SEO professionals like you on topics such as:
- Salaries.
- Budgets.
- New business strategies.
- Success metrics.
- ROI.
Download our dedicated in-house SEO report and learn how to set your team up for success next year.
Top In-House Insights From State Of SEO
- Competition is high for experienced in-house SEO professionals who earn high salaries.
- In-house SEO professionals face unique challenges in their roles within larger companies.
- Leads are not well understood, and proving ROI can be difficult.
In-House SEO Budget Trends
More than 50% of our survey respondents said they worked with budgets of $5,000 or less. Beyond that, budgets for in-house SEO teams vary considerably.
While business-to-business (B2B) in-house teams had an average budget of $2,628.54, business-to-consumer (B2C) and ecommerce teams had almost $1,000 more to work with.
How In-House Budgets Are Allocated
Regardless of budget size, the top five areas where both B2B and B2C in-house SEO professionals dedicated their spending were:
- On-page SEO (14.8%).
- Content marketing (12.5%).
- Technical SEO (12.4%).
- Web development (9.6%).
- Link building (9.0%).
For more budget trends within the in-house SEO space, check out the full supplemental report.
Biggest Challenges For In-House SEO Pros
According to our survey results, 73.8% of in-house SEO professionals experienced an increase in ROI for their efforts this year. However, that doesn’t mean that this year was without its challenges.
Many SEO professionals say they struggled with things like strategy issues, alignment with other departments, and scaling their strategies – but the biggest obstacle faced by in-house SEO pros this year? A lack of resources.
In fact, 21.0% of in-house SEO practitioners noted resource limitations as a major challenge.

Ready To Take The Next Step?
If you’re an in-house SEO professional trying to get a leg up on the competition in 2023, it’s time to start planning your next move – and with our State of SEO: In-House Report, you’ll have all the data you need at your fingertips.
Want to discover more about the current state of in-house SEO? Read the exclusive report to inform your strategy for next year.
SEO
Google Cautions On Blocking GoogleOther Bot

Google’s Gary Illyes answered a question about the non-search features that the GoogleOther crawler supports, then added a caution about the consequences of blocking GoogleOther.
What Is GoogleOther?
GoogleOther is a generic crawler created by Google for the various purposes that fall outside of those of bots that specialize for Search, Ads, Video, Images, News, Desktop and Mobile. It can be used by internal teams at Google for research and development in relation to various products.
The official description of GoogleOther is:
“GoogleOther is the generic crawler that may be used by various product teams for fetching publicly accessible content from sites. For example, it may be used for one-off crawls for internal research and development.”
Something that may be surprising is that there are actually three kinds of GoogleOther crawlers.
Three Kinds Of GoogleOther Crawlers
- GoogleOther
Generic crawler for public URLs - GoogleOther-Image
Optimized to crawl public image URLs - GoogleOther-Video
Optimized to crawl public video URLs
All three GoogleOther crawlers can be used for research and development purposes. That’s just one purpose that Google publicly acknowledges that all three versions of GoogleOther could be used for.
What Non-Search Features Does GoogleOther Support?
Google doesn’t say what specific non-search features GoogleOther supports, probably because it doesn’t really “support” a specific feature. It exists for research and development crawling which could be in support of a new product or an improvement in a current product, it’s a highly open and generic purpose.
This is the question asked that Gary narrated:
“What non-search features does GoogleOther crawling support?”
Gary Illyes answered:
“This is a very topical question, and I think it is a very good question. Besides what’s in the public I don’t have more to share.
GoogleOther is the generic crawler that may be used by various product teams for fetching publicly accessible content from sites. For example, it may be used for one-off crawls for internal research and development.
Historically Googlebot was used for this, but that kind of makes things murky and less transparent, so we launched GoogleOther so you have better controls over what your site is crawled for.
That said GoogleOther is not tied to a single product, so opting out of GoogleOther crawling might affect a wide range of things across the Google universe; alas, not Search, search is only Googlebot.”
It Might Affect A Wide Range Of Things
Gary is clear that blocking GoogleOther wouldn’t have an affect on Google Search because Googlebot is the crawler used for indexing content. So if blocking any of the three versions of GoogleOther is something a site owner wants to do, then it should be okay to do that without a negative effect on search rankings.
But Gary also cautioned about the outcome that blocking GoogleOther, saying that it would have an effect on other products and services across Google. He didn’t state which other products it could affect nor did he elaborate on the pros or cons of blocking GoogleOther.
Pros And Cons Of Blocking GoogleOther
Whether or not to block GoogleOther doesn’t necessarily have a straightforward answer. There are several considerations to whether doing that makes sense.
Pros
Inclusion in research for a future Google product that’s related to search (maps, shopping, images, a new feature in search) could be useful. It might be helpful to have a site included in that kind of research because it might be used for testing something good for a site and be one of the few sites chosen to test a feature that could increase earnings for a site.
Another consideration is that blocking GoogleOther to save on server resources is not necessarily a valid reason because GoogleOther doesn’t seem to crawl so often that it makes a noticeable impact.
If blocking Google from using site content for AI is a concern then blocking GoogleOther will have no impact on that at all. GoogleOther has nothing to do with crawling for Google Gemini apps or Vertex AI, including any future products that will be used for training associated language models. The bot for that specific use case is Google-Extended.
Cons
On the other hand it might not be helpful to allow GoogleOther if it’s being used to test something related to fighting spam and there’s something the site has to hide.
It’s possible that a site owner might not want to participate if GoogleOther comes crawling for market research or for training machine learning models (for internal purposes) that are unrelated to public-facing products like Gemini and Vertex.
Allowing GoogleOther to crawl a site for unknown purposes is like giving Google a blank check to use your site data in any way they see fit outside of training public-facing LLMs or purposes related to named bots like GoogleBot.
Takeaway
Should you block GoogleOther? It’s a coin toss. There are possible potential benefits but in general there isn’t enough information to make an informed decision.
Listen to the Google SEO Office Hours podcast at the 1:30 minute mark:
Featured Image by Shutterstock/Cast Of Thousands
SEO
AI Search Boosts User Satisfaction

A new study finds that despite concerns about AI in online services, users are more satisfied with search engines and social media platforms than before.
The American Customer Satisfaction Index (ACSI) conducted its annual survey of search and social media users, finding that satisfaction has either held steady or improved.
This comes at a time when major tech companies are heavily investing in AI to enhance their services.
Search Engine Satisfaction Holds Strong
Google, Bing, and other search engines have rapidly integrated AI features into their platforms over the past year. While critics have raised concerns about potential negative impacts, the ACSI study suggests users are responding positively.
Google maintains its position as the most satisfying search engine with an ACSI score of 81, up 1% from last year. Users particularly appreciate its AI-powered features.
Interestingly, Bing and Yahoo! have seen notable improvements in user satisfaction, notching 3% gains to reach scores of 77 and 76, respectively. These are their highest ACSI scores in over a decade, likely due to their AI enhancements launched in 2023.
The study hints at the potential of new AI-enabled search functionality to drive further improvements in the customer experience. Bing has seen its market share improve by small but notable margins, rising from 6.35% in the first quarter of 2023 to 7.87% in Q1 2024.
Customer Experience Improvements
The ACSI study shows improvements across nearly all benchmarks of the customer experience for search engines. Notable areas of improvement include:
- Ease of navigation
- Ease of using the site on different devices
- Loading speed performance and reliability
- Variety of services and information
- Freshness of content
These improvements suggest that AI enhancements positively impact various aspects of the search experience.
Social Media Sees Modest Gains
For the third year in a row, user satisfaction with social media platforms is on the rise, increasing 1% to an ACSI score of 74.
TikTok has emerged as the new industry leader among major sites, edging past YouTube with a score of 78. This underscores the platform’s effective use of AI-driven content recommendations.
Meta’s Facebook and Instagram have also seen significant improvements in user satisfaction, showing 3-point gains. While Facebook remains near the bottom of the industry at 69, Instagram’s score of 76 puts it within striking distance of the leaders.
Challenges Remain
Despite improvements, the study highlights ongoing privacy and advertising challenges for search engines and social media platforms. Privacy ratings for search engines remain relatively low but steady at 79, while social media platforms score even lower at 73.
Advertising experiences emerge as a key differentiator between higher- and lower-satisfaction brands, particularly in social media. New ACSI benchmarks reveal user concerns about advertising content’s trustworthiness and personal relevance.
Why This Matters For SEO Professionals
This study provides an independent perspective on how users are responding to the AI push in online services. For SEO professionals, these findings suggest that:
- AI-enhanced search features resonate with users, potentially changing search behavior and expectations.
- The improving satisfaction with alternative search engines like Bing may lead to a more diverse search landscape.
- The continued importance of factors like content freshness and site performance in user satisfaction aligns with long-standing SEO best practices.
As AI becomes more integrated into our online experiences, SEO strategies may need to adapt to changing user preferences.
Featured Image: kate3155/Shutterstock
SEO
Google To Upgrade All Retailers To New Merchant Center By September

Google has announced plans to transition all retailers to its updated Merchant Center platform by September.
This move will affect e-commerce businesses globally and comes ahead of the holiday shopping season.
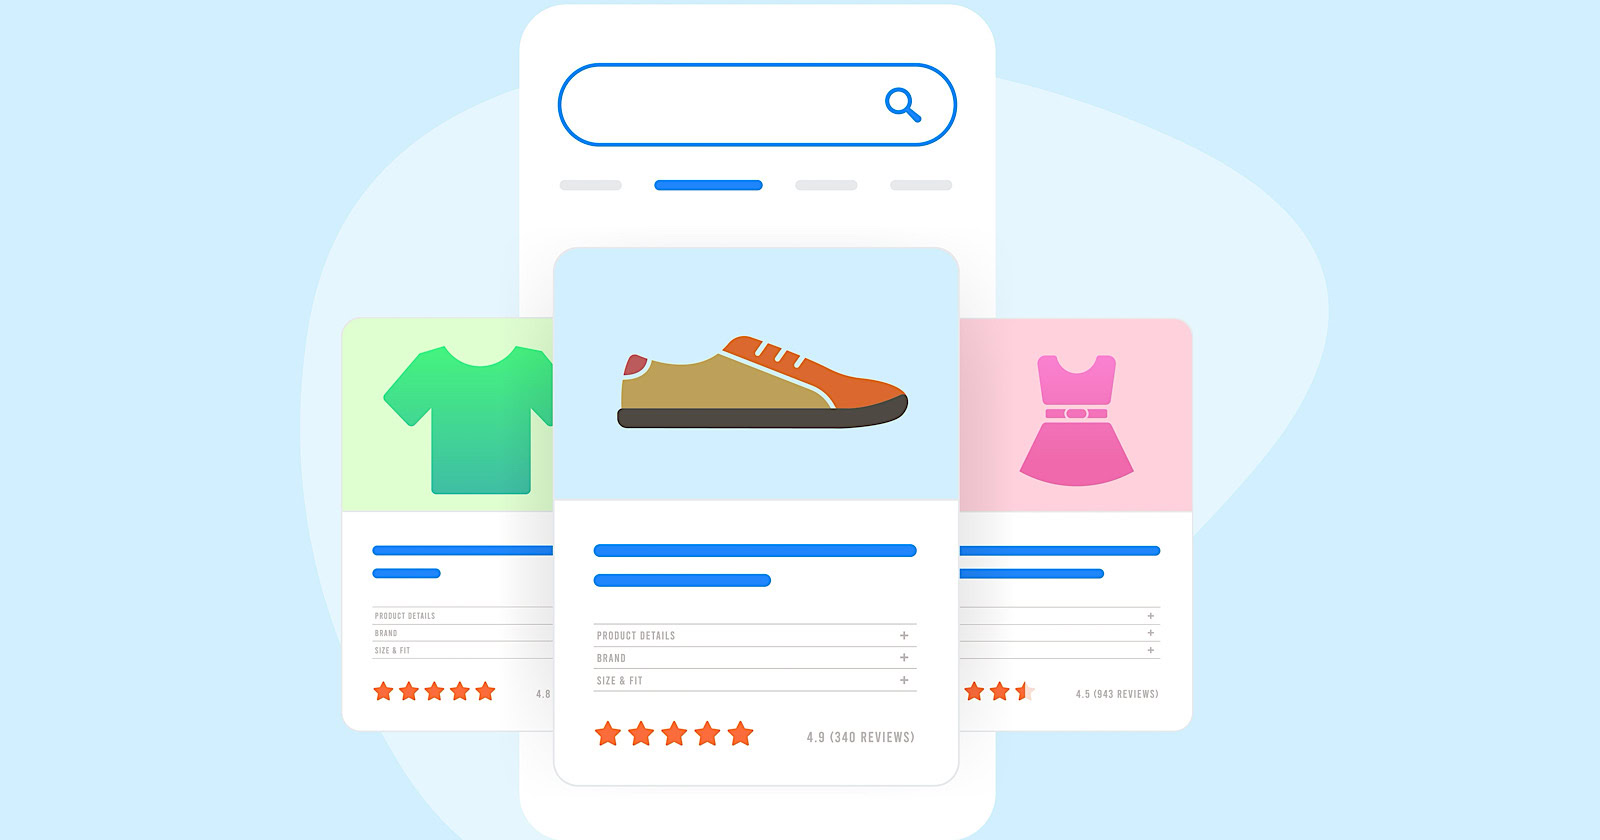
The Merchant Center is a tool for online retailers to manage how their products appear across Google’s shopping services.
Key Changes & Features
The new Merchant Center includes several significant updates.
Product Studio
An AI-powered tool for content creation. Google reports that 80% of current users view it as improving efficiency.
This feature allows retailers to generate tailored product assets, animate still images, and modify existing product images to match brand aesthetics.
It also simplifies tasks like background removal and image resolution enhancement.
Centralized Analytics
A new tab consolidating various business insights, including pricing data and competitive analysis tools.
Retailers can access pricing recommendations, competitive visibility reports, and retail-specific search trends, enabling them to make data-driven decisions and capitalize on popular product categories.
Redesigned Navigation
Google claims the new interface is more intuitive and cites increased setup success rates for new merchants.
The platform now offers simplified website verification processes and can pre-populate product information during setup.
Initial User Response
According to Google, early adopters have shown increased engagement with the platform.
The company reports a 25% increase in omnichannel merchants adding product offers in the new system. However, these figures have yet to be independently verified.
Jeff Harrell, Google’s Senior Director of Merchant Shopping, states in an announcement:
“We’ve seen a significant increase in retention and engagement among existing online merchants who have moved to the new Merchant Center.”
Potential Challenges and Support
While Google emphasizes the upgrade’s benefits, some retailers, particularly those comfortable with the current version, may face challenges adapting to the new system.
The upgrade’s mandatory nature could raise concerns among users who prefer the existing interface or have integrated workflows based on the current system.
To address these concerns, Google has stated that it will provide resources and support to help with the transition. This includes tutorial videos, detailed documentation, and access to customer support teams for troubleshooting.
Industry Context
This update comes as e-commerce platforms evolve, with major players like Amazon and Shopify enhancing their seller tools. Google’s move is part of broader efforts to maintain competitiveness in the e-commerce services sector.
The upgrade could impact consumers by improving product listings and providing more accurate information across Google’s shopping services.
For the e-commerce industry as a whole, it signals a continued push towards AI-driven tools and data-centric decision-making.
Transition Timeline
Google states that retailers will be automatically upgraded by September if they still need to transition.
The company advises users to familiarize themselves with the new features before the busy holiday shopping period.
Featured Image: BestForBest/Shutterstock
-

 SEARCHENGINES5 days ago
Billions Of Google goo.gl URLs To 404 In The Future
-

 SEO7 days ago
26 Common SEO Myths, Debunked
-
SEARCHENGINES4 days ago
Daily Search Forum Recap: July 22, 2024
-

 SEARCHENGINES6 days ago
Google Core Update Coming, Ranking Volatility, Bye Search Notes, AI Overviews, Ads & More
-

 SEO5 days ago
11 Copyscape Alternatives To Check Plagiarism
-

 SEO6 days ago
Google Warns Of Last Chance To Export Notes Search Data
-
SEARCHENGINES3 days ago
Daily Search Forum Recap: July 23, 2024
-

 AFFILIATE MARKETING6 days ago
The Top 5 AI Tools That Can Revolutionize Your Workflow and Boost Productivity


You must be logged in to post a comment Login