MARKETING
The Ultimate Timeline of Google Algorithm Updates (+ Recommendations)

Google is a fickle beast. Many businesses rely on their search engine for traffic, leads, and customers, so Google updates can break or boost a company’s success.
Google’s search engine is ever-changing. It’s the number one search engine in the world because it prioritizes user experience. This means that every one of the latest Google algorithm updates aims to meet its users’ needs and deliver the best possible results.
And as important as this search engine is, no one knows how the Google algorithm works (except for the Google search-quality team, of course).
In this guide, we’ve covered everything you need to know about the Google algorithm. We talk about essential updates throughout their history, and how your company can boost your search results.
Keep reading, or jump to the section you’re looking for.
Google Algorithm
Google’s search engine algorithms determine the results you see for each search term, or query. They work behind the scenes to filter through web content, review indexed pages for relevance and quality (e.g. the search factors), and return results that are most relevant to the query.
While the exact number isn’t certain, SEOs believe there are certain ranking signals that Google considers when displaying results. These include factors like keyword usage, domain history, site usability, and more.
This is why, as businesses and marketers, we must optimize our on-page SEO, off-page SEO, and technical SEO to make it easier for our pages to rank and so consumers can find our content.
Did you know people make over 4.7 billion Google searches every day? The search engine is by far the most popular among its competitors, which means the vast majority of your audience (and potential audience) is actively searching Google for information your website or blog can deliver.
How can you ensure your content ranks high enough on the SERPs to get your audience’s attention? By adhering to the latest Google algorithm updates.
Google Updates 2022
Helpful Content Update (August 25, 2022)
This update aims to improve the user experience. The goal of this content update is to increase the visibility of original helpful content in the search results. At the same time, it limits the results of content created solely to rank well on search engines.
Resources to help with the latest Google update:
Core Update (May 25, 2022)
Core updates are general updates. Their purpose is to make search results more useful and correct. This is a constant process because of changes in current events and the way people use the web.
Google makes thousands of updates to its search algorithm each year. They confirm core updates because these updates usually have some impact on search results. Some users notice changes within 24 hours of an update. Read here to learn more about core updates.
Most core updates address issues of quality and relevancy. This is the most recent core update, but the list below includes past core updates:
- Core Update (November 17, 2021)
- Core Update (July 1, 2021)
- Core Algorithm Update (June 2, 2021)
- Core Update (December 3, 2020)
- Core Update (May 4, 2020)
- Core Update (January 13, 2020)
- Core Algorithm Update (September 24, 2019)
- Core Update (June 2, 2019)
- Core Algorithm Update (April 16, 2018)
- Core Algorithm Update (March 9, 2018)
Product Algorithm Update (March 23, 2022)
This was the latest product review update. This update makes it easier to find high-quality reviews through search. Google’s team shared the reasoning behind these updates, “We’ve regularly heard through user feedback that people prefer detailed reviews with evidence of products actually being tested.”
For more details on product updates, see Product Reviews Update (April 8, 2021). There was also a product review update on December 1, 2021.
Page Experience Update (February 22, 2022)
This is the latest google update for page experience on desktop devices. For more on-page experience updates, see Page Experience Update (June 15, 2021).
Resources to help with the latest Google algorithm updates:
Google Updates 2021
Local Search Update (November 30, 2021)
This was an update to the way that the search engine finds and displays local search results.
Google Spam Update (November 3, 2021)
The spam updates helped the search engine recognize and filter out websites that:
- Contain harmful or questionable content
- Don’t add value
- Use black hat SEO techniques
These updates help protect users from spammy sites and unwanted ads.
Other spam updates include:
- Google Spam Update (November 3, 2021)
- Google Link Spam Algorithm Update (July 26, 2021)
Page Experience Update (June 15, 2021)
This update aims to improve the user experience. It aspires to give priority to web pages with quick load times that stay stable as users scroll. These links from Google can help you learn more about how you can update your site for a better page experience.
Known Victims Protection (June 10, 2021)
For years, sites have attacked individuals with false, offensive, or damaging content. These sites are sometimes the top search result for these individuals. As a result, websites that post explicit images, mug shots, and other slanders often profit by charging victims to remove this content.
With this update, individuals can report these offending sites to Google. Then the search engine will lower the ranking for these searches.
Product Reviews Update (April 8, 2021)
This was the first of several product review updates. Before these updates, many product reviews on the internet were thin. Many came from templates or users with limited experience with the product.
This update focuses on finding quality product reviews that add value for users. Criteria for product review quality include:
- Depth of analysis
- Actual product use
- Distinct information
- Competitive product analysis
Passage Ranking (February 10, 2021)
The passage ranking update made it so that a section within a web page could be an extra ranking factor. This helps search engines better understand the content and serve better search results.
This update hoped to help users find better answers to very specific searches that can sometimes be hard to find. Instead of scanning the full web page, this update isolates passages on a page that can answer a user’s query.
Resources to help with the latest Google updates:
Google Updates 2020
Featured Snippet Update, also called Featured Snippet Deduplication (January 22, 2020)
Before this update, a website that had a featured snippet at the top of the search results could also appear in the organic listings following that snippet. After this change, a website could appear only once per search page.
The intent of this update was to make search results less cluttered and to make it easier for users to find an answer to their queries.
Resources to help with the latest Google algorithm updates:
Google Updates 2019
BERT Update (October 25, 2019)
The Google BERT (Bidirectional Encoder Representations from Transformers) update was an effort by Google to better understand the language in which people search. It’s like RankBrain and is an extra effort to understand searches; it didn’t replace it.
BERT was a significant search algorithm update. As reported by Google: “With the latest advancements from our research team in the science of language understanding … we’re making a significant improvement to how we understand queries, representing the biggest leap forward in the past five years, and one of the biggest leaps forward in the history of Search.”
In short, BERT helps Google users find useful and accurate information. The update allows Google to capture more of the nuance and context in queries and not lean so heavily on the use of prepositions or phrasing to clarify questions. (Check out some live examples of BERT here.)
BERT was also applied to featured snippets in over two dozen countries and languages.
Featured Snippets Update (August 1, 2019)
This update aimed to improve featured snippets. It was an update to surface snippets that would be better with frequent refreshes. It also helped to remove outdated snippets.
These three examples from Google can make it clear what snippets were the target of this update:
- Regularly updated information, like a blog with new posts each week
- Time-based information, like events or TV programming
- News and current events
Core Update, also called Florida 2 (March 12, 2019)
This was a big core update. SEO experts didn’t notice anything unique about this core update, but its timing and scale prompted its alternate name.
Google Updates 2018
Core Algorithm Update, also called Medic (August 1, 2018)
The Google Medic Update was the third broad core algorithm update of 2018. The disproportionate impact it has on sites in the health and wellness industries is how it received its nickname. But it didn’t target those industries; it also had a large impact on websites in all other industries.
In general, SEO specialists theorized that the Medic Update was another update that targeted quality issues like:
Mobile-First Indexing (March 26, 2018)
The Mobile-First Indexing Update was another nod from Google to websites that are mobile-friendly.
Here’s how Google explains: “[Historically,] our crawling, indexing, and ranking systems have typically used the desktop version of a page’s content, which may cause issues for mobile searchers when that version is vastly different from the mobile version. Mobile-first indexing means that we’ll use the mobile version of the page for indexing and ranking, to better help our – primarily mobile – users find what they’re looking for.”
Core Algorithm Update (March 9, 2018)
Google put out this core update to better judge which sites were relevant for specific queries. This update was to help improve rankings for sites with useful content.
Google Updates 2017
Fred (March 7, 2017)
The Fred update targeted thin, ad-focused content. It used data from quality raters at Google to cut low-quality results from SERPs.
Intrusive Interstitials Update (January 10, 2017)
Technical SEO defines interstitials as “content that gets between the user and the content they’re looking for.” This might include:
- Popups that mask other page content
- Web pages that users need to dismiss to access content
- Website layouts with interstitials above the fold
This Google update lowered the rankings of websites with mobile pages that had intrusive interstitials. This update did not penalize interstitials for cookies, legal verification, logins, or banners.
Google Updates 2015
RankBrain (October 26, 2015)
The Google RankBrain Update was part of Hummingbird. RankBrain is a machine-learning-powered component of Google’s algorithm that works to better understand searcher intent and deliver the most accurate, relevant SERP results.
Many SEO strategists believe it serves to measure how searchers interact with search results and then ranks the results accordingly. (This could explain why your SERP looks different when you search for the same thing multiple times.)
It has also been theorized that the RankBrain algorithm identifies relevance features for the websites that rank for a given query, establishing query-specific ranking factors and signals.
Mobile-Friendly Update, also called Mobilegeddon (April 21, 2015)
The Google Mobile Update (nicknamed “Mobilegeddon”) officially incorporated mobile-friendliness as a ranking signal. The update prioritized mobile-friendly websites on mobile SERPs, and the sites that weren’t mobile-friendly were either penalized or removed from the SERPs altogether.
Mobilegeddon was another effort to provide the best possible search experience for users. Google said at the time of release, “When it comes to search on mobile devices, users should get the most relevant and timely results, no matter if the information lives on mobile-friendly web pages or apps.”
Mobilegeddon initially penalized websites that weren’t mobile-responsive and rewarded those that were. Google moved to mobile-first indexing in 2019, so the mobile-friendliness of your site now impacts how you rank for every query.
Google Updates 2014
Pigeon Update (July 24, 2014)
Google released the Pigeon Update to better calibrate the local algorithms with the core algorithm. The goal of this update was to reward local businesses that have a strong organic presence with better SERP visibility. It was also to answer user search queries with accurate local results influenced by traditional web search ranking signals.
Pigeon treats local search the same as traditional organic search, just with local cues. It considers searcher location when displaying SERP results, and allows searchers to treat Google Search and Google Maps the same. For example, you can search “best accountant near me” in both engines, and the results should be similar.
Google Updates 2013
Hummingbird Update (September 26, 2013)
Google released the Hummingbird Update to provide a more conversational, human search experience. Google wanted to better understand the context of what people were searching for — versus the specific terms within their search query.
The Knowledge Graph came out a year before, but Hummingbird improved upon this feature.
Hummingbird uses natural language processing that includes semantic indexing, synonyms, and other features to interpret queries and produce results. It weeds out keyword-stuffed, low-quality content to create a more personalized, exact search process and show SERP results that matched searcher intent.
Payday Loan Update (June 11, 2013)
The goal of the Payday Loan Update was to find and further lessen the impact of spammy queries and websites. It had a bigger impact in countries where webspam was more common.
Spammy sites are those that:
Other updates like this one include:
- Payday Loan Update 3.0 June 12, 2014
- Payday Loan Update 2.0 May 16, 2014
Google Updates 2012
Page Layout Update (October 9, 2012)
Page layout updates focused on websites that display ads above the fold or show content lower on the page due to ads. This practice can be distracting and impact the user experience. Because of this concern, this update lowered the rankings for ad-heavy sites.
Other updates like this one include:
- Page Layout Update, also known as Top Heavy (January 19, 2012)
Penguin Update 1.2 (October 5, 2012)
The Google Penguin Update was released to combat black-hat link-building techniques, such as spammy links, link directories, and keyword-stuffed anchor text.
Google calls them “black hat web spam” and defines them as “techniques that don’t benefit users, where the intent is to look for shortcuts or loopholes that would rank pages higher than they deserve to be ranked.”
Prior to the Penguin Update, link volume — regardless of quality — was a heavy influence on how pages ranked on the SERPs. Penguin attempts to better understand how websites were earning their links. It also made sure that only high-quality trustworthy links were rewarding the sites they led to.
Google Penguin only affects inbound links — the links leading to a site, not away from it. Penguin monitors for black-hat link-building techniques and over-optimized anchor link text. This is when too many inbound links for one website contain the same anchor text, which can alert Google that the links aren’t natural or earned.
Other Penguin updates include:
- Penguin Update 3.0 (October 17, 2014)
- Penguin Update 2.1 (October 4, 2013)
- Penguin Update 2.0 (May 22, 2013)
- Penguin Update 1.2 (October 5, 2012)
Penguin was also added to the core algorithm in late 2016.
Exact Match Domain Update (September 28, 2012)
This update targeted websites with domains that exactly matched competitive keywords. Some sites used this practice to improve their search placement but had poor quality or thin content. This update lowered the value of these sites dramatically.
Venice Update (February 27, 2012)
This update pulled search results based on the user’s IP address or physical location. It also increased Google Maps (then Google Places) appearances in organic search results. This made it easier for users to search for local resources online.
Google Updates 2011
Freshness Update November 3, 2011
The Freshness update’s intent was to give users the most recent search results. For this update, Google narrowed its definition of freshness to figure out time-related searches like:
- Recent events, like new or trending events
- Regularly recurring events, like elections or sports scores
- Frequent updates, like product searches on store websites
Panda Update February 23, 2011
Google released the Panda Update to combat:
- Thin, duplicate, or plagiarized content
- Keyword stuffing
- Content farms
- Websites with high ratios of ad-to-content
- Other quality issues
It was also released to reward unique, high-quality content.
Google Panda gives every web page an internal quality score that attempts to mimic how a human might respond to and rank a piece of content. Then this score is factored into how each website ranks on the SERPs.
Other Panda updates include:
- Panda Update 4.2 (July 17, 2015)
- Panda Update 4.1 (September 23, 2014)
- Panda Update 4.0 (May 20, 2014)
- Panda Update (January 22, 2013)
- Panda Update (December 21, 2012)
- Panda Update (November 21, 2012)
- Panda Update (November 5, 2012)
- Panda Update (September 27, 2012)
- Panda Update 3.9.2 (September 18, 2012)
- Panda Update 3.9.1 (August 20, 2012)
- Panda Update 3.9 (July 24, 2012)
Panda was originally introduced as a filter for search engine results, but in January 2016, it was added to the core algorithm.
Google Updates 2010
Caffeine Update June 8, 2010
Caffeine was a new system for indexing the web that made it more efficient to crawl and store data. This update also improved the freshness of search results.
Google developers shared at the time of release, “Caffeine provides 50 percent fresher results for web searches than our last index, and it’s the largest collection of web content we’ve offered.”
Google Updates 2009
Vince Update (January 18, 2009)
This update equated trust with established brand names. This made it easier for mostly offline big brands to compete with new online-focused brands.
A famous quote for this update from Google’s then-CEO, Eric Schmidt, is “Brands are how you sort out the cesspool.”
Google Updates 2005
Big Daddy Update, also called Bigdaddy (December 15, 2005)
The Bigdaddy update aligned with an upgrade to Google’s data center. It aimed to improve the quality and technical issues for improved search results. It also filtered out some websites with spammy practices like unnatural link building.
Jagger Update (September 1, 2005)
This update expanded the options for search to new documents and file types. Google’s main crawler at the time was Googlebot, and with this update, it expanded the way it scanned sites.
The Jagger update also looked at link quality. It penalized sites with:
- Paid backlinks
- Unnatural link building
- Linking schemes
- Scraped content
Google Updates 2003
Florida Update (November 16, 2003)
Among other things, the Florida update changed the way that Google weighed the value of backlinks. It was important because of the timing and impact it had on search results.
This update most affected retail sites using spammy SEO techniques like:
- Keyword stuffing
- Hidden links
- Invisible text
This update was especially hard for these sites because it launched during the holiday season. This timing directly influences annual sales in retail.
How to Prepare Your Site for the Latest Google Updates
While every one of the latest Google updates is unique, the goal of every update is to create a great user experience for Google users. With this in mind, there are many approaches you can take to prepare your site for updates.
1. Create clear, useful content for your site.
- Focus on creating genuinely unique content that provides value to your visitors and customers. Google provides 20+ questions to help you determine quality and value.
- Use a site crawler like Botify or Screaming Frog to identify thin content on your website and blog. If you find any, consider combining or archiving those pages.
- Remove or rework any low-quality or underperforming content. (You can identify this content based on low traffic and/or low conversion rates.)
- Avoid writing for machines and create conceptual content, not just keyword-driven content. Expand your keyword research to include different phrasing, commonly asked questions, and similar terms.
- Conduct competitive analysis by searching your keywords on a new Google SERP and see what related content and SERP features (like Knowledge Graphs or featured snippets) pop up.
- Consistently update your content to reflect better grammar, syntax, and language.
2. Check your technical SEO.
- Make sure to use structured data and metadata on both your desktop and mobile versions.
- Rewrite duplicate content. Ecommerce sites are especially vulnerable to duplicative content. In these cases, use canonical URLs to show Google which version of each page to rank in the SERPs.
- Make sure your off-page SEO and technical SEO are intact and that there are no underlying issues.
3. Create a great mobile experience.
- Confirm your website is mobile-optimized. Here’s a blog post on how to do this.
- Use Google’s Mobile-Friendly Test tool to see how your website performs. This tool will show you how your site looks on a mobile device and alert you to any loading or processing problems.
- If you have separate URLs for your mobile site (an m-dot site), confirm that your mobile page reflects the same content as your desktop site. (Google prefers to index your mobile URL.)
- Read through Google’s best practices for mobile-first indexing.
4. Build quality backlinks.
- Follow white-hat link-building techniques to build high-quality, relevant backlinks.
- Don’t take part in Private Blog Network (PBN) link schemes, which often lead to site penalties.
- If you hire an agency or freelancer for link-building, make sure you ask how they’re building links. There should be no exchange of money between the agency and the person or organization linking to your site.
5. Think locally.
- Leverage on-page SEO and other tactics to ensure Google recognizes your business’s location and other local ranking factors.
- Create content and media that associates your business with a specific location, such as a neighborhood, town, or city. This will help improve your local SEO.
- Register with Google My Business to manage how your business information appears on Google SERPs. Create and manage profiles on other important directories. Check out this post for a full list of online business directories.
- Make sure your location information is consistent across all your web properties, like your website, social media, and Yelp listings.
Grow Better with Google Updates
As a business owner and marketer, the latest Google updates may seem like a lot of detail and work. You’re not wrong. These updates and the changes you might need to make can be overwhelming.
But it’s important to remember that Google wants to create a fantastic user experience, just like you do. These algorithm updates prune out lazy, low-quality, and illegal content. That content isn’t just filling up your search queries, it’s competing with your business and marketing content.
In short, these Google updates are good things. It’s up to you to keep learning and use them to your advantage.
Editor’s note: This post was originally published in August 2019 and has been updated for comprehensiveness.
MARKETING
The Current State of Google’s Search Generative Experience [What It Means for SEO in 2024]
![The Current State of Google’s Search Generative Experience [What It Means for SEO in 2024] person typing on laptop with](https://articles.entireweb.com/wp-content/uploads/2024/04/The-Current-State-of-Googles-Search-Generative-Experience-What-It.webp.webp)
SEO enthusiasts, known for naming algorithm updates after animals and embracing melodrama, find themselves in a landscape where the “adapt or die” mantra prevails. So when Google announced the launch of its Search Generative Experience (SGE) in May of 2023 at Google/IO, you can imagine the reaction was immense.
Although SGE has the potential to be a truly transformative force in the landscape, we’re still waiting for SGE to move out of the Google Labs Sandbox and integrate into standard search results.
Curious about our current take on SGE and its potential impact on SEO in the future? Read on for more.
Decoding Google’s Defensive Move
In response to potential threats from competitors like ChatGPT, Bing, TikTok, Reddit, and Amazon, Google introduced SGE as a defensive maneuver. However, its initial beta release raised questions about its readiness and global deployment.
ChatGPT provided an existential threat that had the potential to eat into Google’s market share. When Bing started incorporating it into its search results, it was one of the most significant wins for Bing in a decade. In combination with threats from TikTok, Reddit, and Amazon, we see a more fractured search landscape less dominated by Google. Upon its launch, the expectation was that Google would push its SGE solution globally, impact most queries, and massively shake up organic search results and strategies to improve organic visibility.
Now, industry leaders are starting to question if Google is better off leaving SGE in the testing ground in Google labs. According to Google’s recent update, it appears that SGE will remain an opt-in experience in Google Labs (for at least the short term). If SGE was released, there could be a fundamental reset in understanding SEO. Everything from organic traffic to optimization tactics to tracking tools would need adjustments for the new experience. Therefore, the prospect of SGE staying in Google Labs is comforting if not entirely reliable.
The ever-present option is that Google can change its mind at any point and push SGE out broadly as part of its standard search experience. For this reason, we see value in learning from our observations with SGE and continuing to stay on top of the experience.
SGE User Experience and Operational Challenges
If you’ve signed up for search labs and have been experimenting with SGE for a while, you know firsthand there are various issues that Google should address before rolling it out broadly to the public.
At a high level, these issues fall into two broad categories including user experience issues and operational issues.
Below are some significant issues we’ve come across, with Google making notable progress in addressing certain ones, while others still require improvement:
- Load time – Too many AI-generated answers take longer to load than a user is willing to wait. Google recommends less than a 3-second load time to meet expectations. They’ll need to figure out how to consistently return results quickly if they want to see a higher adoption rate.
- Layout – The SGE layout is massive. We believe any major rollout will be more streamlined to make it a less intrusive experience for users and allow more visibility for ads, and if we’re lucky, organic results. Unfortunately, there is still a decent chance that organic results will move below the fold, especially on mobile devices. Recently, Google has incorporated more results where users are prompted to generate the AI result if they’d like to see it. The hope is Google makes this the default in the event of a broad rollout where users can generate an AI result if they want one instead of assuming that’s what a user would like to see.
- Redundancy – The AI result duplicates features from the map pack and quick answer results.
- Attribution – Due to user feedback, Google includes sources on several of their AI-powered overviews where you can see relevant web pages if there is an arrow next to the result. Currently, the best way to appear as one of these relevant pages is to be one of the top-ranked results, which is convenient from an optimization standpoint. Changes to how attribution and sourcing are handled could heavily impact organic strategies.
On the operational side, Google also faces significant hurdles to making SGE a viable product for its traditional search product. The biggest obstacle appears to be making the cost associated with the technology worth the business outcomes it provides. If this was a necessary investment to maintain market share, Google might be willing to eat the cost, but if their current position is relatively stable, Google doesn’t have much of an incentive to take on the additional cost burden of heavily leveraging generative AI while also presumably taking a hit to their ad revenue. Especially since slow user adoption doesn’t indicate this is something users are demanding at the moment.
While the current experience of SGE is including ads above the generative results now, the earliest iterations didn’t heavily feature sponsored ads. While they are now included, the current SGE layout would still significantly disrupt the ad experience we’re used to. During the Google I/O announcement, they made a statement to reassure advertisers they would be mindful of maintaining a distinct ad experience in search.
“In this new generative experience, Search ads will continue to appear in dedicated ad slots throughout the page. And we’ll continue to uphold our commitment to ads transparency and making sure ads are distinguishable from organic search results” – Elizabeth Reid, VP, Search at Google
Google is trying to thread a delicate needle here of staying on the cutting edge with their search features, while trying not to upset their advertisers and needlessly hinder their own revenue stream. Roger Montti details more of the operational issues in a recent article digging into the surprising reasons SGE is stuck in Google Labs.
He lists three big problems that need to be solved before SGE will be integrated into the foreground of search:
- Large Language Models being inadequate as an information retrieval system
- The inefficiency and cost of transformer architecture
- Hallucinating (providing inaccurate answers)
Until SGE provides more user value and checks more boxes on the business sense side, the traditional search experience is here to stay. Unfortunately, we don’t know when or if Google will ever feel confident they’ve addressed all of these concerns, so we’ll need to stay prepared for change.
Experts Chime in on Search Generative Experience
Our team has been actively engaging with SGE, here’s a closer look at their thoughts and opinions on the experience so far:
“With SGE still in its early stages, I’ve noticed consistent changes in how the generative results are produced and weaved naturally into the SERPs. Because of this, I feel it is imperative to stay on top of these on-going changes to ensure we can continue to educate our clients on what to expect when SGE is officially incorporated into our everyday lives. Although an official launch date is currently unknown, I believe proactively testing various prompt types and recording our learnings is important to prepare our clients for this next evolution of Google search.”
– Jon Pagano, SEO Sr. Specialist at Tinuiti
“It’s been exciting to watch SGE grow through different variations over the last year, but like other AI solutions its potential still outweighs its functionality and usefulness. What’s interesting to see is that SGE doesn’t just cite its sources of information, but also provides an enhanced preview of each webpage referenced. This presents a unique organic opportunity where previously untouchable top 10 rankings are far more accessible to the average website. Time will tell what the top ranking factors for SGE are, but verifiable content with strong E-E-A-T signals will be imperative.”
–Kate Fischer, SEO Specialist at Tinuiti
“Traditionally, AI tools were very good at analytical tasks. With the rise of ChatGPT, users can have long-form, multi-question conversations not yet available in search results. When, not if, released, Google’s Generative Experience will transform how we view AI and search. Because there are so many unknowns, some of the most impactful ways we prepare our clients are to discover and develop SEO strategies that AI tools can’t directly disrupt, like mid to low funnel content.”
– Brandon Miller, SEO Specialist at Tinuiti
“SGE is going to make a huge impact on the ecommerce industry by changing the way users interact with the search results. Improved shopping experience will allow users to compare products, price match, and read reviews in order to make it quicker and easier for a user to find the best deals and purchase. Although this leads to more competitive results, it also improves organic visibility and expands our product reach. It is more important than ever to ensure all elements of a page are uniquely and specifically optimized for search. With the SGE updates expected to continue to impact search results, the best way to stay ahead is by focusing on strong user focused content and detailed product page optimizations.”
– Kellie Daley, SEO Sr. Specialist at Tinuiti
Navigating the Clash of Trends
One of the most interesting aspects of the generative AI trend in search is that it appears to be in direct opposition to other recent trends.
One of the ways Google has historically evaluated the efficacy of its search ranking systems is through the manual review of quality raters. In their quality rater guidelines, raters were instructed to review for things like expertise, authority, and trustworthiness (EAT) in results to determine if Google results are providing users the information they deserve.
In 2022, Google updated their search guidelines to include another ‘e’ in the form of experience (EEAT). In their words, Google wanted to better assess if the content a user was consuming was created by someone with, “a degree of experience, such as with actual use of a product, having actually visited a place or communicating what a person has experienced. There are some situations where really what you value most is content produced by someone who has firsthand, life experience on the topic at hand.”
Generative AI results, while cutting-edge technology and wildly impressive in some cases, stand in direct opposition to the principles of E-E-A-T. That’s not to say that there’s no room for both in search, but Google will have to determine what it thinks users value more between these competing trends. The slow adoption of SGE could be an indication that a preference for human experience, expertise, authority, and trust is winning round one in this fight.
Along these lines, Google is also diversifying its search results to cater to the format in which users get their information. This takes the form of their Perspectives Filter. Also announced at Google I/O 2023, the perspectives filter incorporates more video, image, and discussion board posts from places like TikTok, YouTube, Reddit, and Quora. Once again, this trend shows the emphasis and value searchers place on experience and perspective. Users value individual experience over the impersonal conveyance of information. AI will never have these two things, even if it can provide a convincing imitation.
The current iteration of SGE seems to go too far in dismissing these trends in favor of generative AI. It’s an interesting challenge Google faces. If they don’t determine the prevailing trend correctly, veering too far in one direction can push more market share to ChatGPT or platforms like YouTube and TikTok.
Final Thoughts
The range of outcomes remains broad and fascinating for SGE. We can see this developing in different ways, and prognostication offers little value, but it’s invaluable to know the potential outcomes and prepare for as many of them as possible.
It’s critical that you or your search agency be interacting and experimenting with SGE because:
- The format and results will most likely continue to see significant changes
- This space moves quickly and it’s easy to fall behind
- Google may fix all of the issues with SGE and decide to push it live, changing the landscape of search overnight
- SGE experiments could inform other AI elements incorporated into the search experience
Ultimately, optimizing for the specific SGE experience we see now is less important because we know it will inevitably continue changing. We see more value in recognizing the trends and problems Google is trying to solve with this technology. With how quickly this space moves, any specifics mentioned in this article could be outdated in a week. That’s why focusing on intention and process is important at this stage of the game.
By understanding the future needs and wants SGE is attempting to address, we can help you future-proof your search strategies as much as possible. To some extent we’re always at the whims of the algorithm, but by maintaining a user-centric approach, you can make your customers happy, regardless of how they find you.
MARKETING
How to create editorial guidelines that are useful + template
Before diving in to all things editorial guidelines, a quick introduction. I head up the content team here at Optimizely. I’m responsible for developing our content strategy and ensuring this aligns to our key business goals.
Here I’ll take you through the process we used to create new editorial guidelines; things that worked well and tackle some of the challenges that come with any good multi – stakeholder project, share some examples and leave you with a template you can use to set your own content standards.
What are editorial guidelines?
Editorial guidelines are a set of standards for any/all content contributors, etc. etc. This most often includes guidance on brand, tone of voice, grammar and style, your core content principles and the types of content you want to produce.
Editorial guidelines are a core component of any good content strategy and can help marketers achieve the following in their content creation process:
- Consistency: All content produced, regardless of who is creating it, maintains a consistent tone of voice and style, helping strengthen brand image and making it easier for your audience to recognize your company’s content
- Quality Control: Serves as a ‘North Star’ for content quality, drawing a line in the sand to communicate the standard of content we want to produce
- Boosts SEO efforts: Ensures content creation aligns with SEO efforts, improving company visibility and increasing traffic
- Efficiency: With clear guidelines in place, content creators – external and internal – can work more efficiently as they have a clear understanding of what is expected of them
Examples of editorial guidelines
There are some great examples of editorial guidelines out there to help you get started.
Here are a few I used:
1. Editorial Values and Standards, the BBC
Ah, the Beeb. This really helped me channel my inner journalist and learn from the folks that built the foundation for free quality journalism.
How to create editorial guidelines, Pepperland Marketing
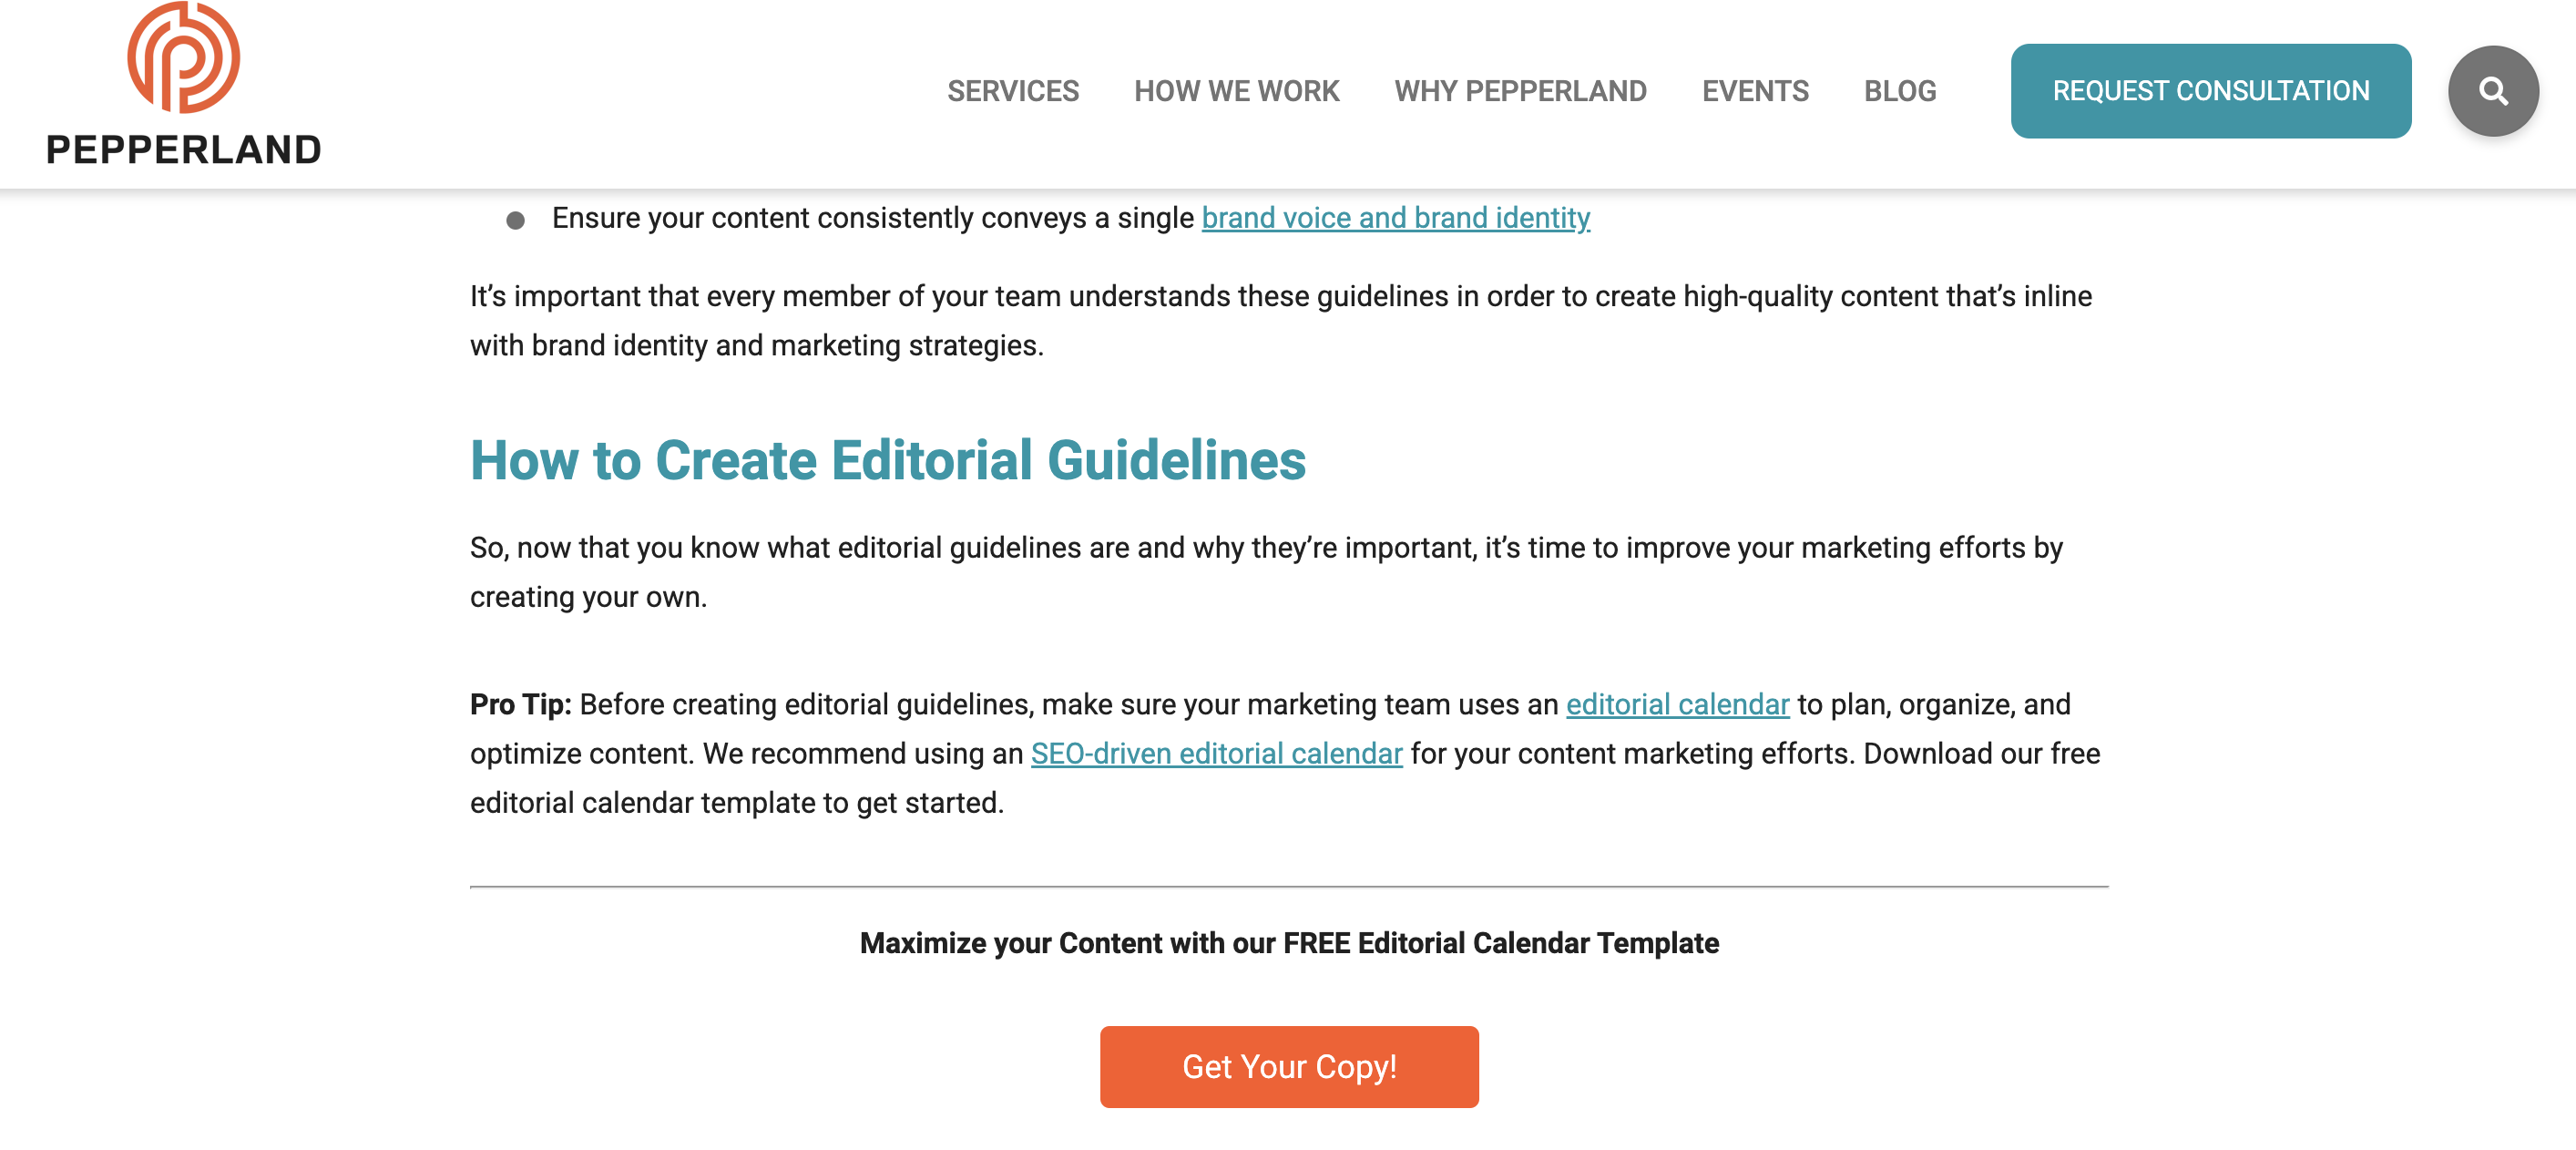
After taking a more big picture view I recognized needed more focused guidance on the step by step of creating editorial guidelines.
I really liked the content the good folks at Pepperland Marketing have created, including a free template – thanks guys! – and in part what inspired me to create our own free template as a way of sharing learnings and helping others quickstart the process of creating their own guidelines.
3. Writing guidelines for the role of AI in your newsroom?… Nieman Lab

As well as provide guidance on content quality and the content creation process, I wanted to tackle the thorny topic of AI in our editorial guidelines. Specifically, to give content creators a steer on ‘fair’ use of AI when creating content, to ensure creators get to benefit from the amazing power of these tools, but also that content is not created 100% by AI and help them understand why we feel that contravenes our core content principles of content quality.
So, to learn more I devoured this fascinating article, sourcing guidance from major media outlets around the world. I know things change very quickly when it comes to AI, but I highly encourage reading this and taking inspiration from how these media outlets are tackling this topic.
Learn more: The Marketer’s Guide to AI-generated content
Why did we decide to create editorial guidelines?
1. Aligning content creators to a clear vision and process
Optimizely as a business has undergone a huge transformation over the last 3 years, going through rapid acquisition and all the joys and frustrations that can bring. As a content team, we quickly recognized the need to create a set of clear and engaging guidelines that helps content creators understand how and where they can contribute, and gave a clear process to follow when submitting a content idea for consideration.
2. Reinvigorated approach to brand and content
As a brand Optimizely is also going through a brand evolution – moving from a more formal, considered tone of voice to one that’s much more approachable, down to earth and not afraid to use humor, different in content and execution.
See, our latest CMS campaign creative:
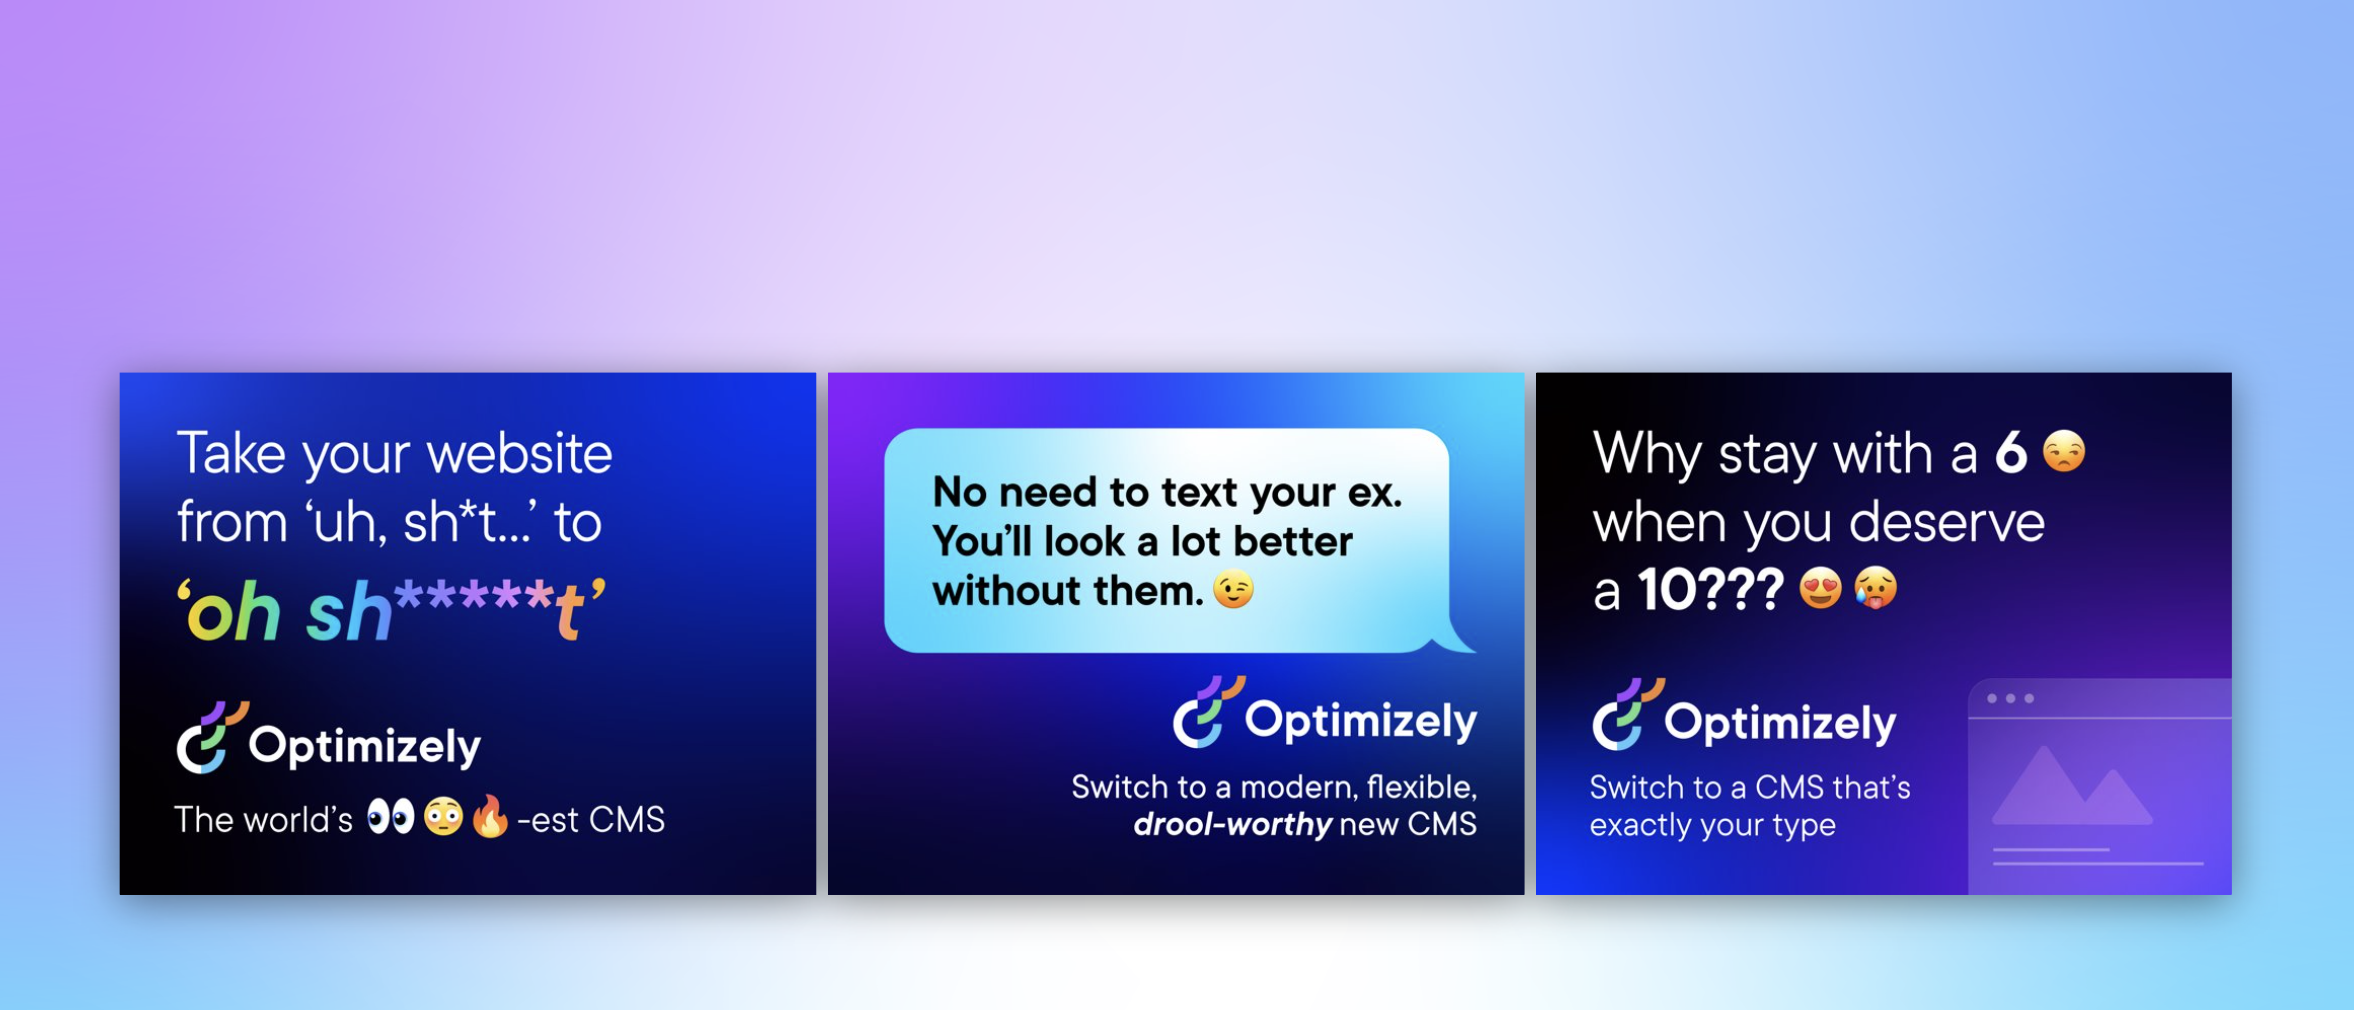
It’s pretty out there in terms of creative and messaging. It’s an ad campaign that’s designed to capture attention yes, but also – to demonstrate our abilities as a marketing team to create this type of campaign that is normally reserved for other more quote unquote creative industries.
We wanted to give guidance to fellow content creators outside the team on how they can also create content that embraces this evolved tone of voice, while at the same time ensuring content adheres to our brand guidelines.
3. Streamline content creation process
Like many global enterprises we have many different content creators, working across different time zones and locations. Documenting a set of guidelines and making them easily available helps content creators quickly understand our content goals, the types of content we want to create and why. It would free up content team time spent with individual contributors reviewing and editing submissions, and would ensure creation and optimization aligns to broader content & business goals.
It was also clear that we needed to document a process for submitting content ideas, so we made sure to include this in the guidelines themselves to make it easy and accessible for all contributors.
4. 2023 retrospective priority
As a content team we regularly review our content strategy and processes to ensure we’re operating as efficiently as possible.
In our last retrospective. I asked my team ‘what was the one thing I could do as a manager to help them be more impactful in their role?’
Editorial guidelines was the number 1 item on their list.
So off we went…
What we did
- Defined a discrete scope of work for the first version of the editorial guidelines, focusing on the Blog and Resources section of the website. This is where the content team spends most of its time and so has most involvement in the content creation process. Also where the most challenging bottlenecks have been in the past
- Research. Reviewed what was out there, got my hands on a few free templates and assembled a framework to create a first version for inputs and feedback
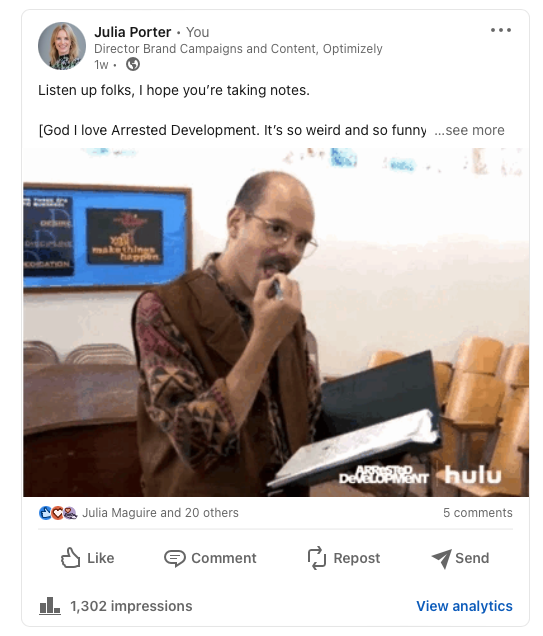
- Asked content community – I put a few questions out to my network on LinkedIn on the topic of content guidelines and content strategy, seeking to get input and guidance from smart marketers.
- Invited feedback: Over the course of a few weekswe invited collaborators to comment in a shared doc as a way of taking iterative feedback, getting ideas for the next scope of work, and also – bringing people on the journey of creating the guidelines. Look at all those reviewers! Doing this within our Content Marketing Platform (CMP) ensured that all that feedback was captured in one place, and that we could manage the process clearly, step by step:
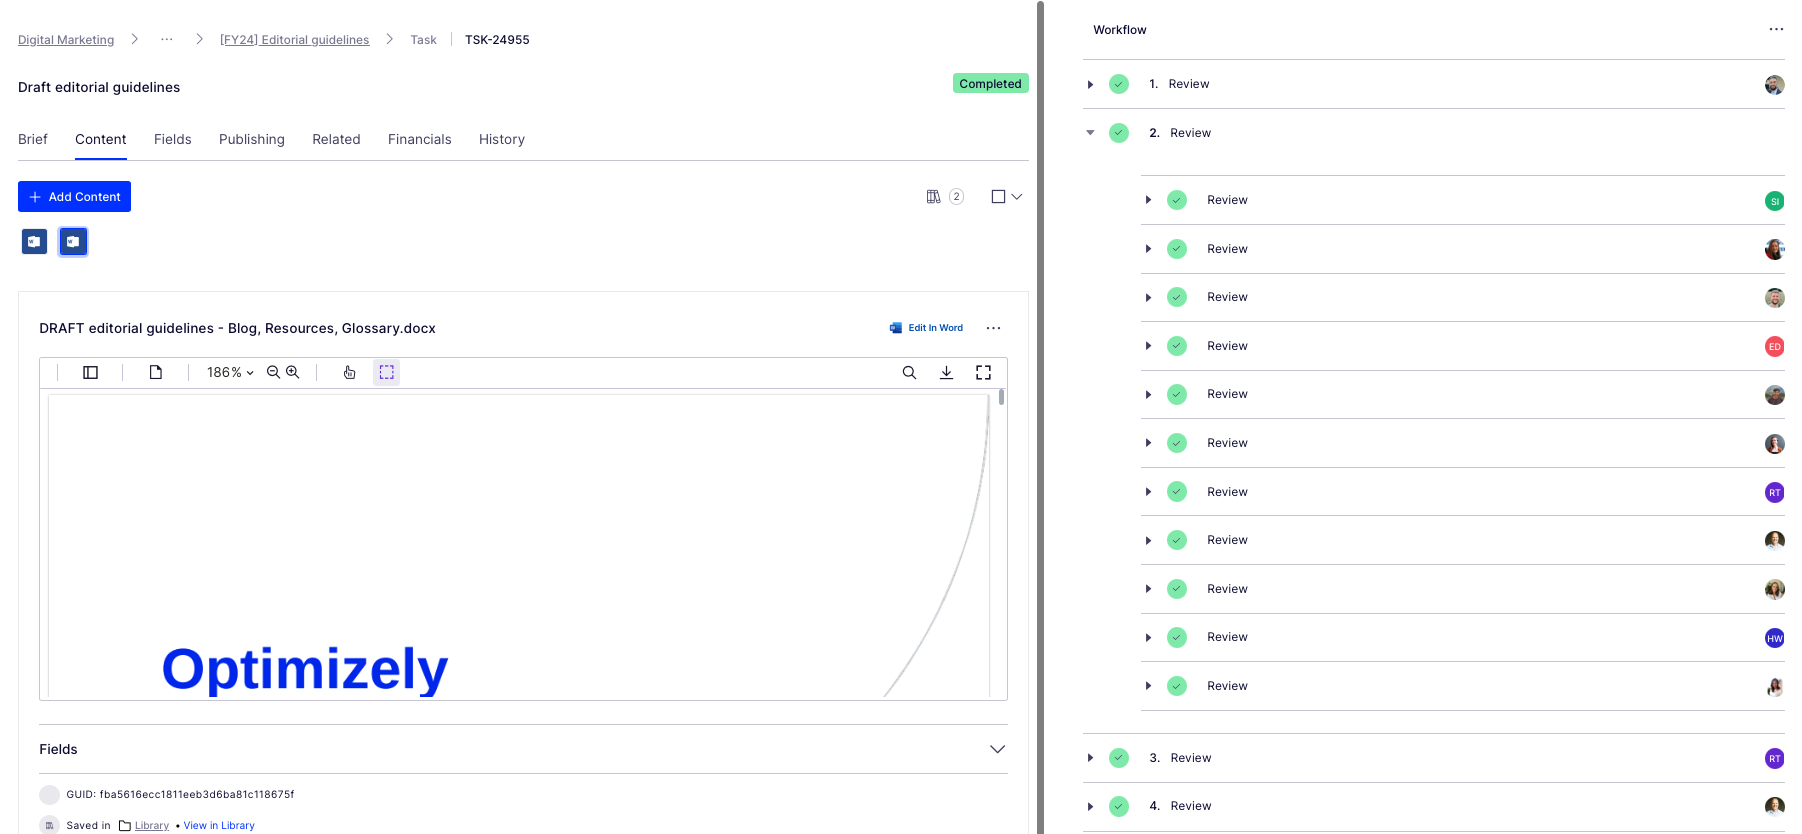
Look at all those collaborators! Thanks guys! And all of those beautiful ticks, so satisfying. So glad I could crop out the total outstanding tasks for this screen grab too (Source – Optimizely CMP)
- Updated content workflow: Now we have clear, documented guidance in place, we’ve included this as a step – the first step – in the workflow used for blog post creation:
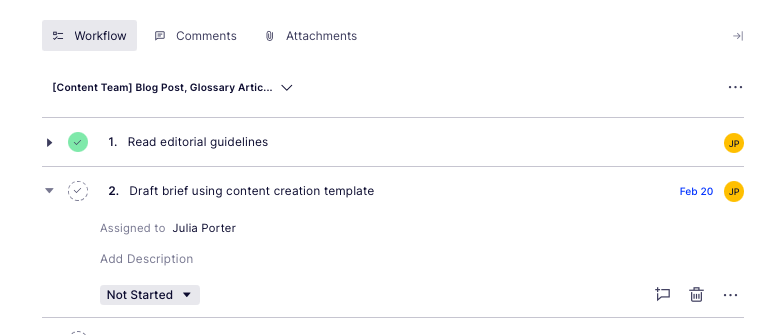
Source: Optimizely CMP
Results
It’s early days but we’re already seeing more engagement with the content creation process, especially amongst the teams involved in building the guidelines (which was part of the rationale in the first place :))

Source: My Teams chat
It’s inspired teams to think differently about the types of content we want to produce going forwards – for the blog and beyond.
I’d also say it’s boosted team morale and collaboration, helping different teams work together on shared goals to produce better quality work.
What’s next?
We’re busy planning wider communication of the editorial guidelines beyond marketing. We’ve kept the original draft and regularly share this with existing and potential collaborators for ongoing commentary, ideas and feedback.
Creating guidelines has also sparked discussion about the types of briefs and templates we want and need to create in CMP to support creating different assets. Finding the right balance between creative approach and using templates to scale content production is key.
We’ll review these guidelines on a quarterly basis and evolve as needed, adding new formats and channels as we go.
Key takeaways
- Editorial guidelines are a useful way to guide content creators as part of your overall content strategy
- Taking the time to do research upfront can help accelerate seemingly complex projects. Don’t be afraid to ask your community for inputs and advice as you create
- Keep the scope small at first rather than trying to align everything all at once. Test and learn as you go
- Work with stakeholders to build guidelines from the ground up to ensure you create a framework that is useful, relevant and used
And lastly, here’s that free template we created to help you build or evolve your own editorial guidelines!
MARKETING
Effective Communication in Business as a Crisis Management Strategy

Everyday business life is full of challenges. These include data breaches, product recalls, market downturns and public relations conflicts that can erupt at any moment. Such situations pose a significant threat to a company’s financial health, brand image, or even its further existence. However, only 49% of businesses in the US have a crisis communications plan. It is a big mistake, as such a strategy can build trust, minimize damage, and even strengthen the company after it survives the crisis. Let’s discover how communication can transform your crisis and weather the chaos.
The ruining impact of the crisis on business
A crisis can ruin a company. Naturally, it brings losses. But the actual consequences are far worse than lost profits. It is about people behind the business – they feel the weight of uncertainty and fear. Employees start worrying about their jobs, customers might lose faith in the brand they once trusted, and investors could start looking elsewhere. It can affect the brand image and everything you build from the branding, business logo, social media can be ruined. Even after the crisis recovery, the company’s reputation can suffer, and costly efforts might be needed to rebuild trust and regain momentum. So, any sign of a coming crisis should be immediately addressed. Communication is one of the crisis management strategies that can exacerbate the situation.
The power of effective communication
Even a short-term crisis may have irreversible consequences – a damaged reputation, high employee turnover, and loss of investors. Communication becomes a tool that can efficiently navigate many crisis-caused challenges:
- Improved trust. Crisis is a synonym for uncertainty. Leaders may communicate trust within the company when the situation gets out of control. Employees feel valued when they get clear responses. The same applies to the customers – they also appreciate transparency and are more likely to continue cooperation when they understand what’s happening. In these times, documenting these moments through event photographers can visually reinforce the company’s messages and enhance trust by showing real, transparent actions.
- Reputation protection. Crises immediately spiral into gossip and PR nightmares. However, effective communication allows you to proactively address concerns and disseminate true information through the right channels. It minimizes speculation and negative media coverage.
- Saved business relationships. A crisis can cause unbelievable damage to relationships with employees, customers, and investors. Transparent communication shows the company’s efforts to find solutions and keeps stakeholders informed and engaged, preventing misunderstandings and painful outcomes.
- Faster recovery. With the help of communication, the company is more likely to receive support and cooperation. This collaborative approach allows you to focus on solutions and resume normal operations as quickly as possible.
It is impossible to predict when a crisis will come. So, a crisis management strategy mitigates potential problems long before they arise.
Tips on crafting an effective crisis communication plan.
To effectively deal with unforeseen critical situations in business, you must have a clear-cut communication action plan. This involves things like messages, FAQs, media posts, and awareness of everyone in the company. This approach saves precious time when the crisis actually hits. It allows you to focus on solving the problem instead of intensifying uncertainty and panic. Here is a step-by-step guide.
Identify your crisis scenarios.
Being caught off guard is the worst thing. So, do not let it happen. Conduct a risk assessment to pinpoint potential crises specific to your business niche. Consider both internal and external factors that could disrupt normal operations or damage the online reputation of your company. Study industry-specific issues, past incidents, and current trends. How will you communicate in each situation? Knowing your risks helps you prepare targeted communication strategies in advance. Of course, it is impossible to create a perfectly polished strategy, but at least you will build a strong foundation for it.
Form a crisis response team.
The next step is assembling a core team. It will manage communication during a crisis and should include top executives like the CEO, CFO, and CMO, and representatives from key departments like public relations and marketing. Select a confident spokesperson who will be the face of your company during the crisis. Define roles and responsibilities for each team member and establish communication channels they will work with, such as email, telephone, and live chat. Remember, everyone in your crisis response team must be media-savvy and know how to deliver difficult messages to the stakeholders.
Prepare communication templates.
When a crisis hits, things happen fast. That means communication needs to be quick, too. That’s why it is wise to have ready-to-go messages prepared for different types of crises your company may face. These messages can be adjusted to a particular situation when needed and shared on the company’s social media, website, and other platforms right away. These templates should include frequently asked questions and outline the company’s general responses. Make sure to approve these messages with your legal team for accuracy and compliance.
Establish communication protocols.
A crisis is always chaotic, so clear communication protocols are a must-have. Define trigger points – specific events that would launch the crisis communication plan. Establish a clear hierarchy for messages to avoid conflicting information. Determine the most suitable forms and channels, like press releases or social media, to reach different audiences. Here is an example of how you can structure a communication protocol:
- Immediate alert. A company crisis response team is notified about a problem.
- Internal briefing. The crisis team discusses the situation and decides on the next steps.
- External communication. A spokesperson reaches the media, customers, and suppliers.
- Social media updates. A trained social media team outlines the situation to the company audience and monitors these channels for misinformation or negative comments.
- Stakeholder notification. The crisis team reaches out to customers and partners to inform them of the incident and its risks. They also provide details on the company’s response efforts and measures.
- Ongoing updates. Regular updates guarantee transparency and trust and let stakeholders see the crisis development and its recovery.
Practice and improve.
Do not wait for the real crisis to test your plan. Conduct regular crisis communication drills to allow your team to use theoretical protocols in practice. Simulate different crisis scenarios and see how your people respond to these. It will immediately demonstrate the strong and weak points of your strategy. Remember, your crisis communication plan is not a static document. New technologies and evolving media platforms necessitate regular adjustments. So, you must continuously review and update it to reflect changes in your business and industry.
Wrapping up
The ability to handle communication well during tough times gives companies a chance to really connect with the people who matter most—stakeholders. And that connection is a foundation for long-term success. Trust is key, and it grows when companies speak honestly, openly, and clearly. When customers and investors trust the company, they are more likely to stay with it and even support it. So, when a crisis hits, smart communication not only helps overcome it but also allows you to do it with minimal losses to your reputation and profits.
-
 WORDPRESS7 days ago
13 Best HubSpot Alternatives for 2024 (Free + Paid)
-

 MARKETING6 days ago
Advertising in local markets: A playbook for success
-

 SEARCHENGINES6 days ago
Google Core Update Flux, AdSense Ad Intent, California Link Tax & More
-

 SEARCHENGINES5 days ago
Google Needs Very Few Links To Rank Pages; Links Are Less Important
-

 MARKETING5 days ago
How to Use AI For a More Effective Social Media Strategy, According to Ross Simmonds
-

 PPC4 days ago
10 Most Effective Franchise Marketing Strategies
-
 SEARCHENGINES3 days ago
Google Won’t Change The 301 Signals For Ranking & SEO
-

 SEO5 days ago
How to Become an SEO Lead (10 Tips That Advanced My Career)





You must be logged in to post a comment Login