SEO
3 Unique Ways To Prove The Value Of SEO

The Truth About The Real ROI Of SEO
SEO often involves a significant initial investment with a longer ROI than other channels. And once you let SEO slide, the recovery budget can be even more taxing.
However, the ROI from an investment in SEO is generally higher than in other channels.
You know this, but do your stakeholders?
By displaying the right strategic investment in SEO, your brand will come through a period of economic uncertainty in a much stronger position – poised for growth.
I want to help you prove that to stakeholders.
How To Show Accurately Projected Results That Shareholders & Clients Can Plan Around
It’s your responsibility as the expert to ensure that SEO is a priority.
This can be done through strategic planning that your clients and stakeholders can trust.
Let’s look at two ways you can do that:
- Use SEO forecasting to better predict, select, and validate your marketing objectives, SEO goals, and business goals; with this, you can provide valuable insights to marketing directors, commercial managers, or finance directors.
- Identify hidden or less obvious opportunities for growth through organic search and validate them with SEO forecasting. You’ll show the value of the opportunity and what it means as an investment.
1. Use SEO Forecasting During SEO Strategy Creation To Validate Attainable Goals
Your first step to building your SEO strategy is to choose your goals and objectives.
These goals should be the north star that every part of your strategy works towards.
You’ve probably had to answer questions related to business objectives such as:
- What is the percentage increase in non-brand organic traffic we can expect with an investment?
- If we invest, how much additional revenue or leads will we receive from an increase in our organic search traffic?
- What will our ROI look like in 12 months’ time if we invest in improving our non-brand organic search traffic?
Using SEOmonitor’s Forecast, you’ll be able to answer these questions and secure your value as a thought leader.
Also, you’ll be able to explain these metrics, set expectations, and provide insight into where best to invest your marketing budget.
With the answers to those questions in your pocket, you’ll be able to start building the foundation of a highly-understandable SEO strategy that stakeholders will love.
As I’m personally a fan of the “SMART objectives” framework, I recommend you use it to build out your strategy, as it forces you to consider if your objectives are truly measurable and achievable.
One example to guide you can be: “Increase non-brand organic search traffic by X% within 12 months and Y% within 24 months while improving the website conversion rate for our agreed conversion goals by Z%.”
How To Validate Your SEO Objectives
Let’s look at an example to understand how forecasting helps create and explain these measurable and specific objectives.
In this example, I’m working on a real estate and property website, which I’ll call “Property Search”.
Property Search gets around 5 million organic search sessions a year.
My potential goals are to:
- Maintain and grow the non-brand organic search traffic the site is already receiving.
- Grow the organic, non-branded search traffic for new areas of opportunity.
What I need to answer next:
- What is the percentage increase?
- How would this affect conversions?
- What would an ROI look like in 12 months?
Now that you have your questions in mind, you can use SEO forecasting to help you make sure those metrics and goals are truly attainable.
Define Your Keyword Data On A Granular Level
The more granular you structure your keyword data, the better.
Define your information architecture and group strategic clusters of search phrases together.
SEOmonitor provides a folder and group structure, which helps you set up the level of granularity you need.
- Create Folders: When I set up my keyword research data for “Property Search”, I’ll opt to create individual folders to represent a top-level category in the information architecture (e.g. Offices or Retail).
- Create Groups: Then, inside of each folder, I’ll create groups that represent a sub-category (e.g. For Sale or For Rent).
- Add Keyword Phrase Clusters: To each group, add clusters of keyword phrases that relate to the category or sub-category in question.
- Add To SEOmonitor: These search phrases are either fed into SEOmonitor via Google Search Console and Google Analytics upon account setup or manually via your own keyword research methods.
-
Image by SEOmonitor, September 2022
This level of granularity lets you create different forecast scenarios based on your selection of specific folders or groups. That’s how you can validate relevant metrics against different objectives.
In order to forecast metrics for my first objective – “to maintain and grow non-brand organic search traffic the site is already receiving” – I start the forecasting process in SEOmonitor with the folders and groups I have structured that relate to “Property Search’s” current organic search footprint.
-
 Image by SEOmonitor, September 2022
Create & Test A Reliable SEO Strategy Scenario
The SEOmonitor forecasting solution provides you with all the key variables you need to create a reliable scenario:
- Timeframe: You’re able to forecast over a 3, 6, and 12-month period.
- Progress Speed: Gain the flexibility to adjust the speed at which you reach your goal: exponential, linear, or custom.
- Volume & YoY Trend: Easily consider average monthly volumes and year-over-year search trends.
- Rank Goal: Set rank position goals at the folder or group level.
- Goal Chance: See how realistic the goal you are setting is, based on your current organic search footprint and the personalized keyword difficulty metric for your targeted website.
A key part of the forecasting process is the ability to adjust the conversion rate in the SEOmonitor forecasting algorithm.
Sometimes, when you’re familiar with a brand, your expertise can help you tailor the forecast toward a more accurate prediction.
For instance, an issue I have come across in the past is conversion data in Google Analytics not matching up to the data in internal systems, in some cases by 20 – 30%. In this instance, adjusting the conversion rate that you are forecasting gives far more accurate metrics in the final forecast.
-
 Image by SEOmonitor, September 2022
The resulting forecast scenario provides me with all the data needed to answer the questions mentioned above, validate my first objective, and provide valuable insight to my client.
2. Uncover New Business Opportunities With SEO Forecasting
Building on this initial forecast scenario, we can now move our attention to the second objective I outlined: “to grow non-brand organic search traffic for new areas of opportunity.”
How To Identify Gaps In Your Competitor’s SEO Strategy
After extensive research into new areas of opportunity for “Property Search”, and identifying clusters of keyword phrases that related to the business, we identified achievable gaps in the competitors’ landscape.
We consider gaps achievable due to the business’s level of authority in the competitive landscape.
- Import Keyword Phrases & Clusters: We manually import them into SEOmonitor and create a second forecast scenario for our second objective; this forecast will present different metrics so we can validate the opportunity and our second objective.
- Create SMART Objectives: With the two completed forecast scenarios, I have all the metrics we need to create measurable and achievable SMART objectives, thus the ability to validate these objectives and our main SEO goal.
-
 Image by SEOmonitor, September 2022
3. Use Predicted SEO Forecasts To Help Business Decisions
Working with the Sales Director at “Property Search”, we were able to use the data in the two scenarios to forecast revenue generated from the site based on the increase in conversions.
Based on the estimated increase in non-brand traffic, we are also able to consider the uplift to their display advertising revenue from advertisers on their site.
All of this impacts the ability to forecast better commercials and make decisions at the board level as to the best areas of investment in marketing.
On a final note, you may be wondering why we did not group these two forecast scenarios together, which is a good question.
The reason for this is that the two objectives we had both required different tactics to achieve success for them:
- Our first objective required more significant time and investment in technical and on-page SEO.
- Our second objective had a stronger focus on content and digital PR.
Being able to assign these objectives to specific stakeholders within the “Property Search” team enabled better accountability and clarity on who was responsible for delivery in each area of our strategy.
Use SEO Forecasting To Show Business-Wide Needs For SEO
Forecasting SEO based on keywords and desired ranking targets enables you to set clear, measurable objectives and make a solid business case for:
- Leveraging current non-brand organic traffic.
- Identifying new opportunities to grow the non-brand organic traffic of the business.
That further translates into potential business outcomes that clients and stakeholders care about.
It’s how you turn the conversation from SEO as a cost to SEO as an investment.
With SEOmonitor’s Forecast, which considers all key variables influencing your keywords and ranks (device segmentation, search data including seasonality and year-over-year trends, CTRs, and conversion rates), you can check every calculation and trust the data.
Join us if you want to create greater value for your clients and stakeholders with more transparency and precision.
SEO
How to Combine SEO and Content Marketing (The Ahrefs’ Way)
SEO and content marketing are different marketing channels. But you don’t have to choose between them. They’re complementary.
In fact, you should combine them for greater effectiveness in your marketing.
Two main reasons:
1. Content marketing and SEO are like peanut butter and jelly—they work well together
Content marketing is the process of creating and distributing content to attract and retain customers.
Here’s how SEO helps content marketing:
- It tells you what your audience cares about — If you know what they’re searching on Google, you can create the type of content they want to see. This is known as keyword research, a key aspect of SEO.
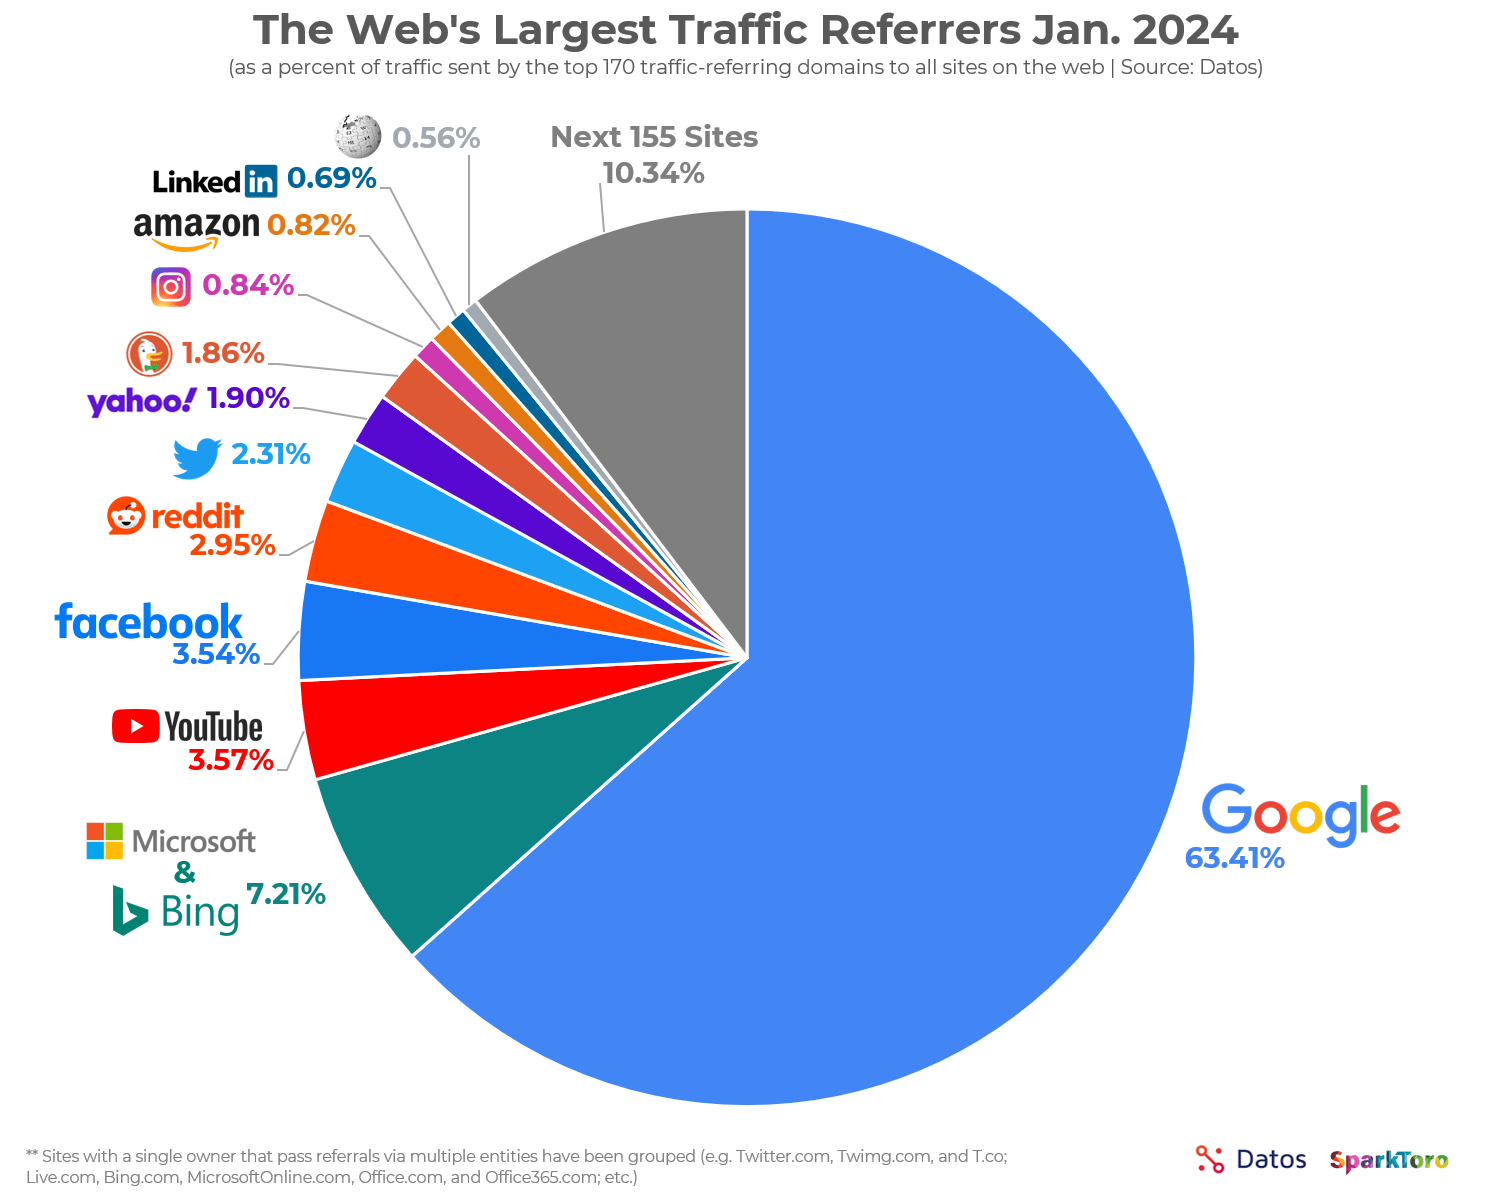
- It creates predictable distribution — Sparktoro’s study showed that 63.41% of all US web traffic referrals come from Google. Most of our blog traffic comes from search engines too.

SEO is the process of improving a website’s visibility in search engines to get more traffic.
Here’s how content marketing helps SEO:
- It helps you get more search traffic — If you want more search traffic, you need to rank for more keywords, which requires you to make more content.
- It makes SEO more effective — Thought leadership content acquires backlinks, gated content generates leads, and sales enablement converts traffic into sales.
2. The same amount of investment in effort, money, and time can generate results for both content marketing and SEO
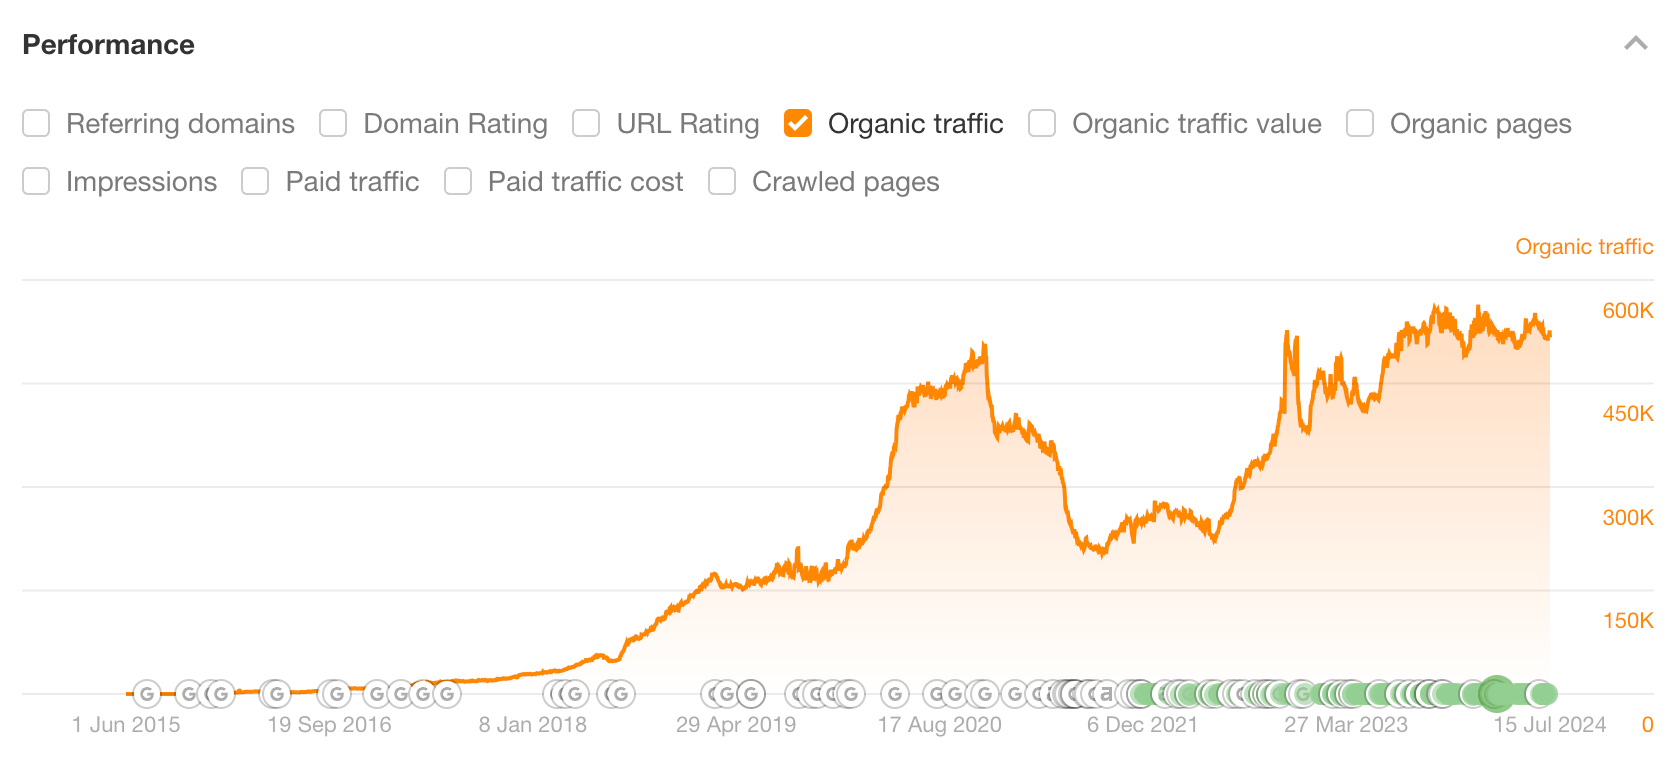
We’re the perfect example. Our content ranks high on Google and generates hundreds of thousands of monthly search visitors:

It also attracts links and shares on social media because we make sure each piece is unique and not just regurgitation or “AI content”.


Finally, each piece of content introduces visitors to our product and educates them on how to use it to solve their problems. (Keep on reading and you’ll see it in action too!)
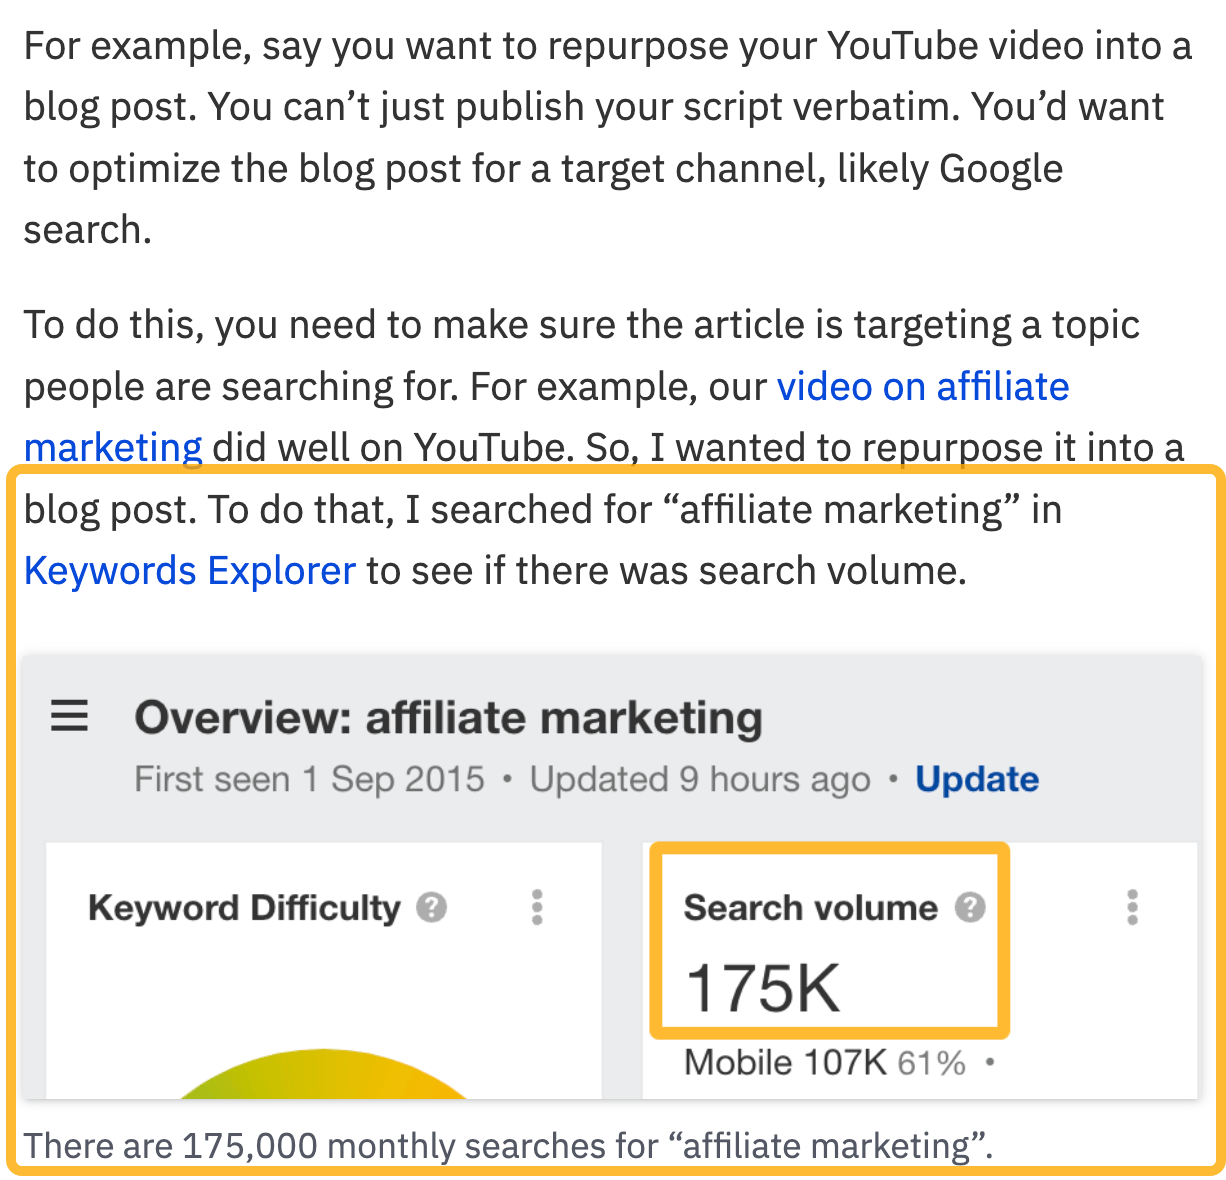

It hits all content marketing and SEO goals at once:
- Acquires search traffic ✅
- Builds thought leadership ✅
- Attracts links ✅
- Generates sales (over the long-term) ✅
How do we do what we do? Believe it or not, there’s a method to the madness. Here’s one line that summarizes our entire SEO content marketing strategy:
We create and maintain high-quality, product-led, search-focused content about topics with business potential and search traffic potential.
Let me break down how we combine SEO and content marketing:
If you want to acquire search traffic, you need to target topics that your potential customers are searching for.
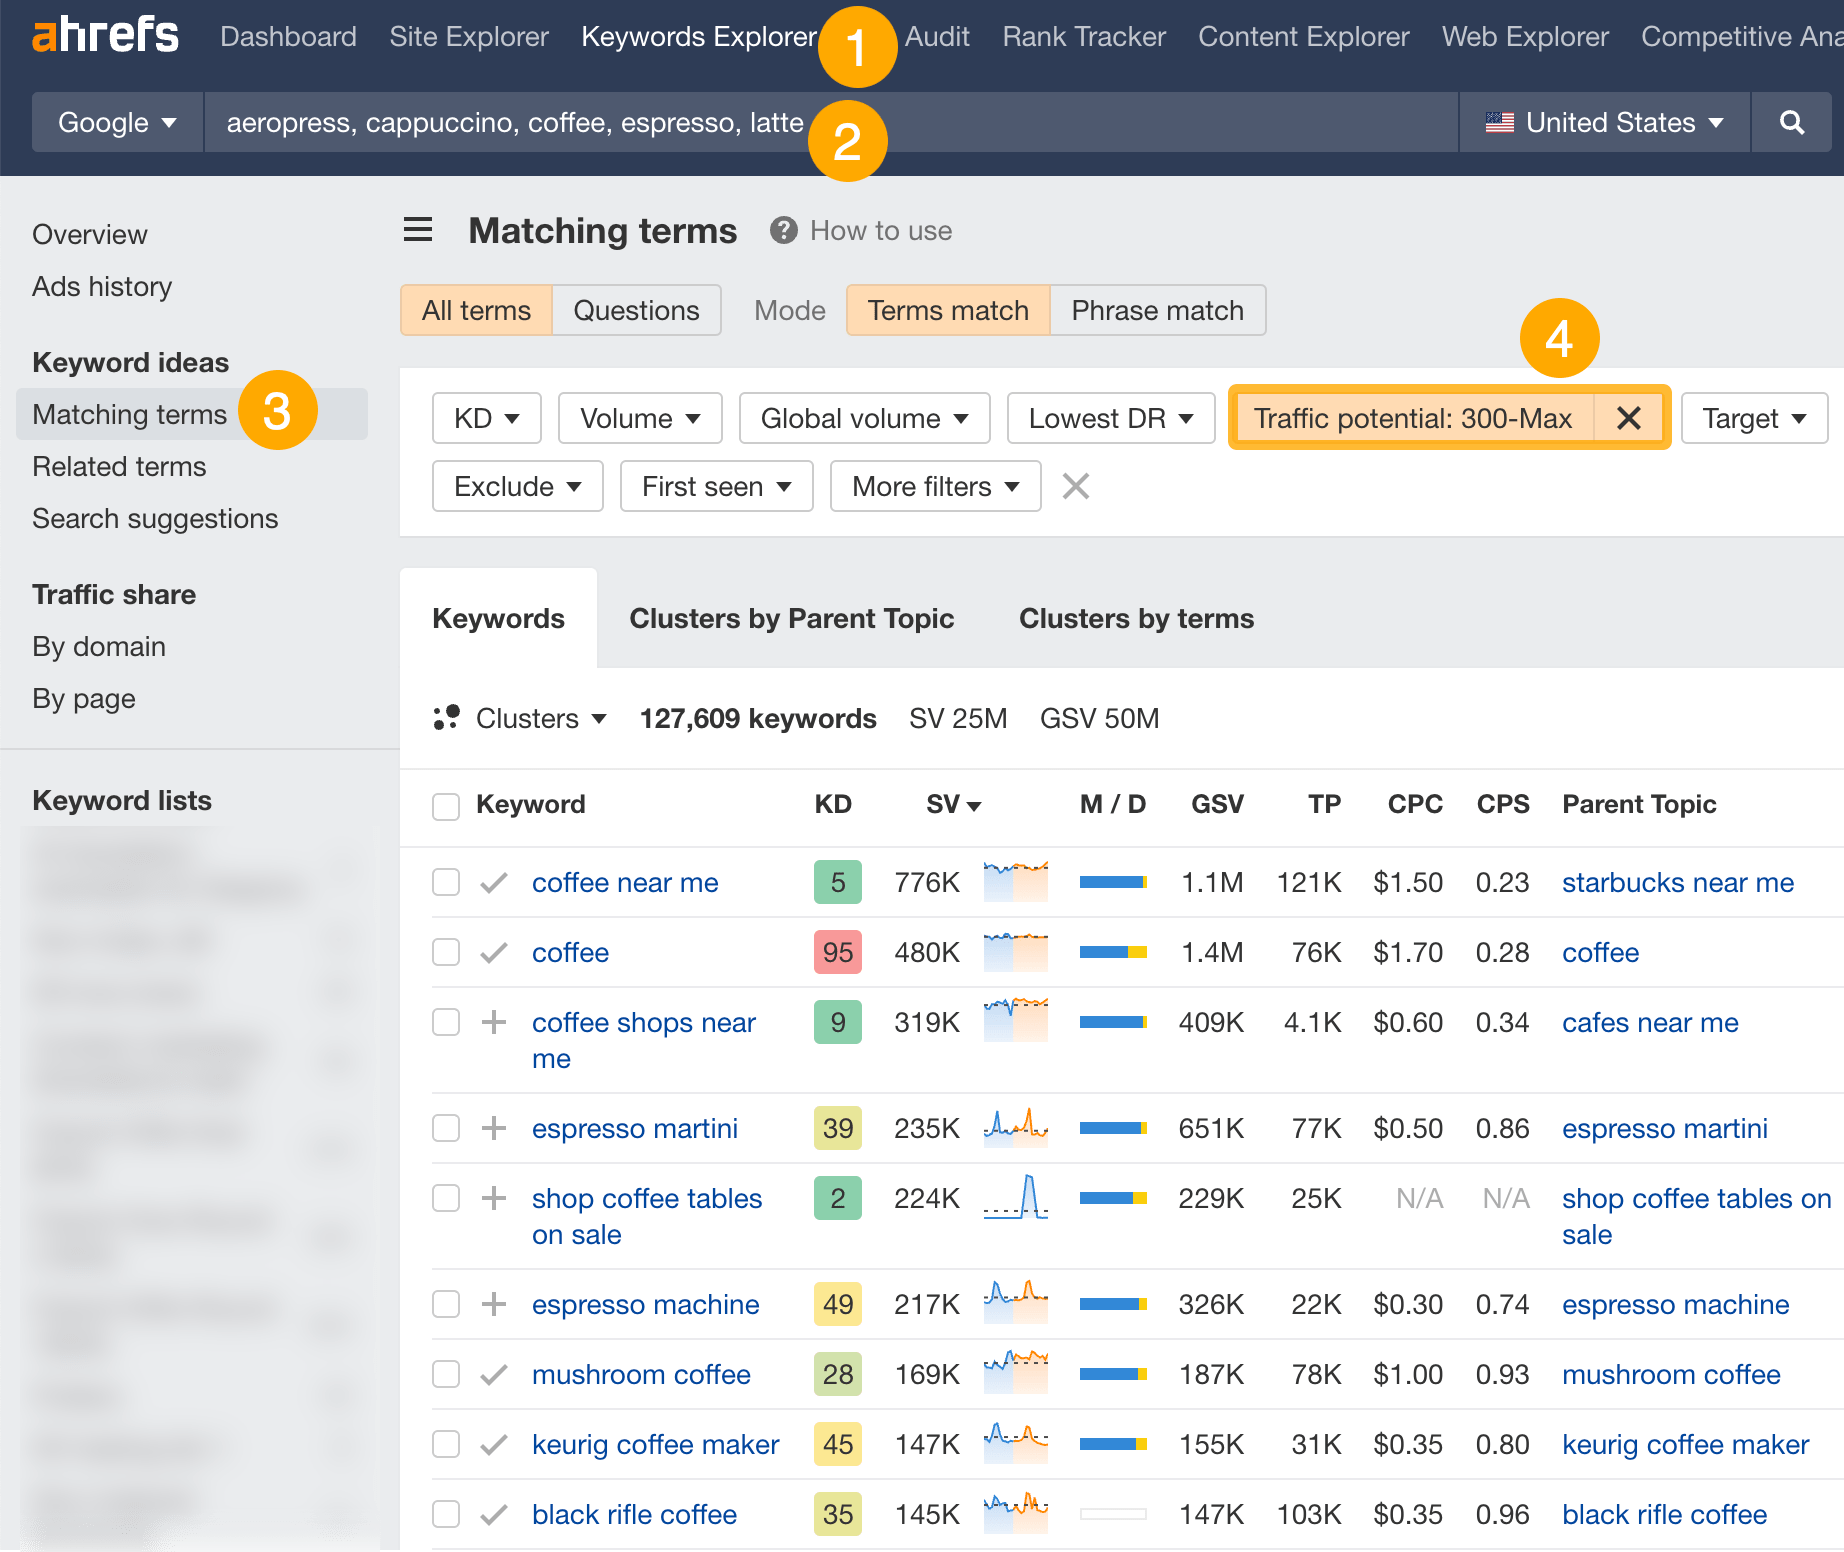
The easiest way to find these keywords is to use a keyword tool like Ahrefs’ Keywords Explorer:
- Go to Keywords Explorer
- Enter a few broad keywords related to your site or niche
- Go to the Matching terms report
- Filter for keywords with traffic potential (TP)

Sidenote.
Traffic Potential is the estimated monthly organic search traffic to the top-ranking page for a keyword. Since pages tend to rank for many keywords, Traffic Potential is a more reliable estimate than search volume.
Go through the report and pick out the keywords that are relevant to your site. For example, if I were an ecommerce store selling coffee equipment, this could be a potential keyword to target:


A keyword’s business potential is how easy it will be to pitch your product while covering a certain topic. It’s our ‘trade secret’—it’s why we can easily introduce our product and its features in every piece of content we create.
Here’s how to score a topic’s business potential:
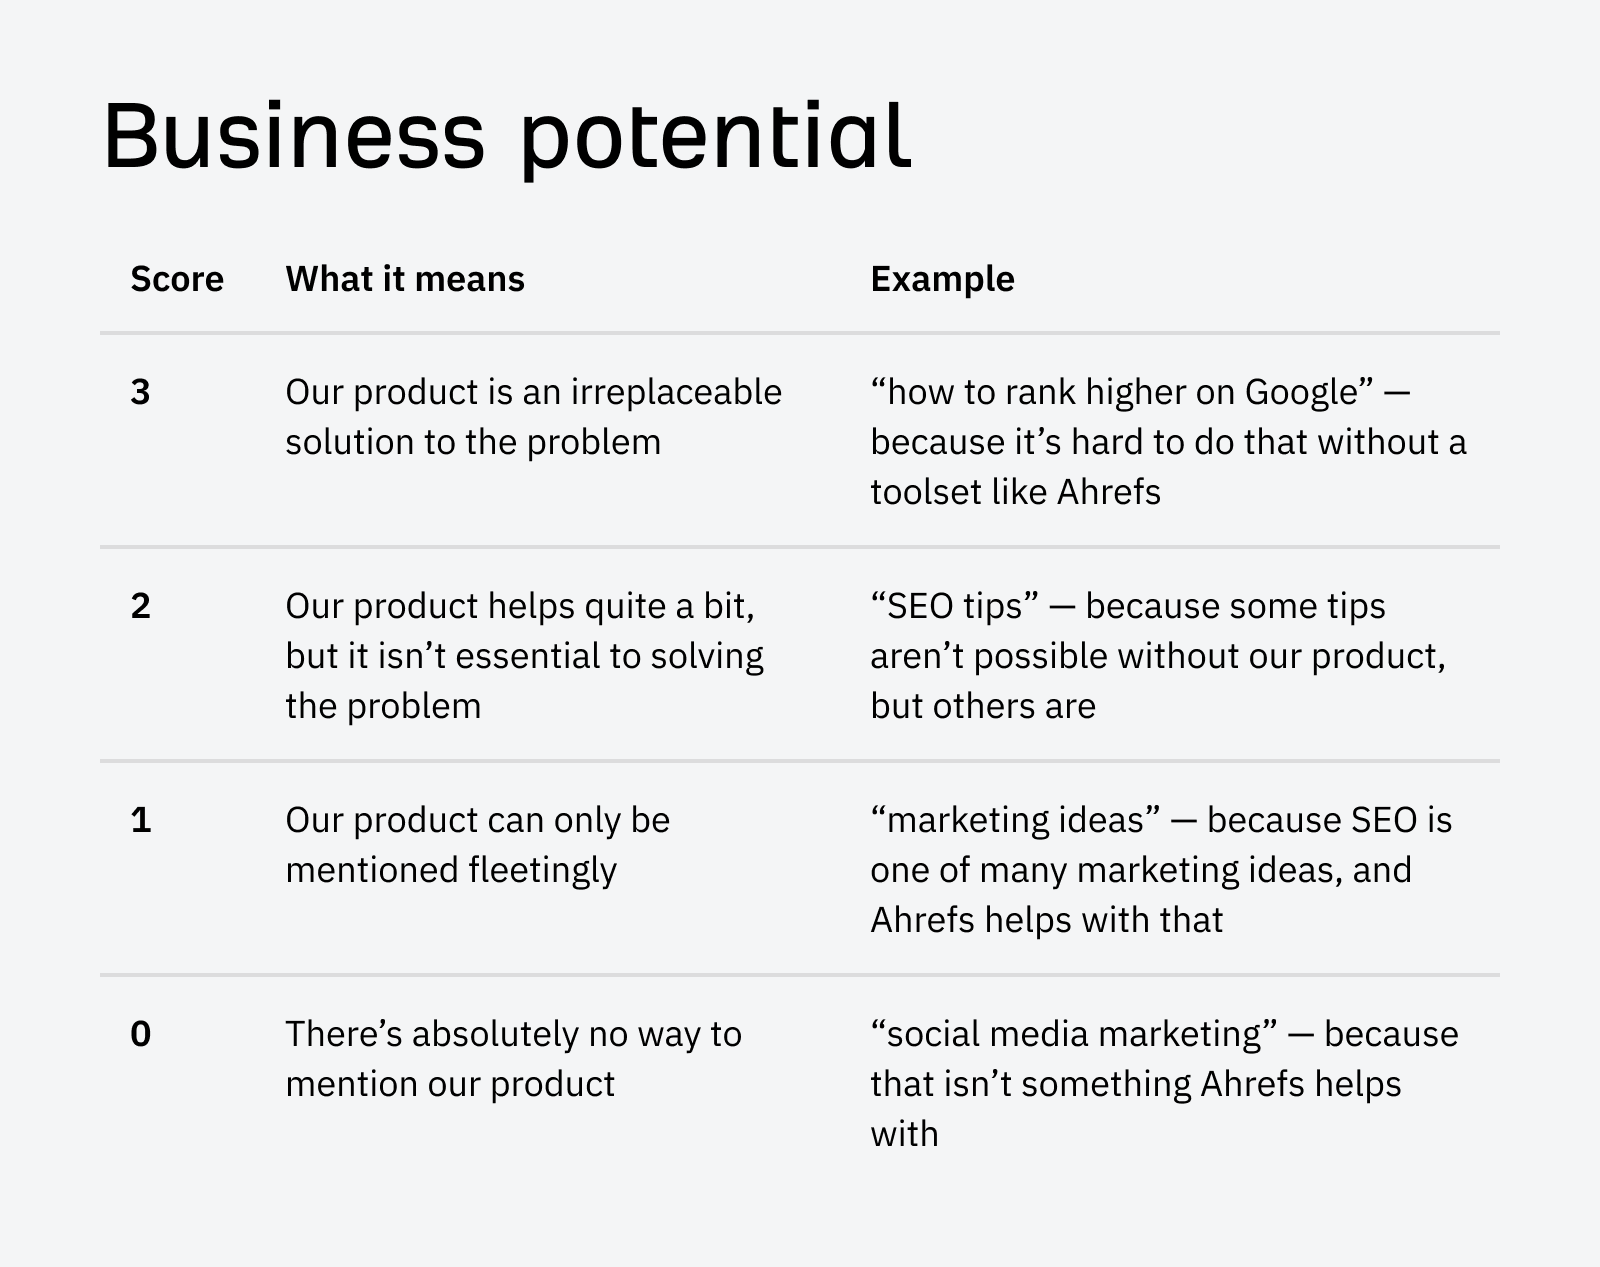

So, taking the above example, the topic “best coffee grinder” would score a “3” (provided we sell coffee grinders) whereas a topic like “does decaf coffee have caffeine” would score a “1” or even a “0”.
You should prioritize topics that score high on business potential, i.e. a “2” or a “3”.
What does all of the jargon mean? Let’s break it down.
Search-focused
Part one of being ‘search-focused’ is finding keywords that people are searching for. Part two is to figure out why they’re searching for those particular keywords. This ‘why’ is known as search intent.
Given that Google’s goal is to always rank the most relevant content, we can look at the search engine results (SERPs) to uncover search intent. Take your target keyword, enter it into Keywords Explorer, scroll down to SERP Overview, and click Identify intents:
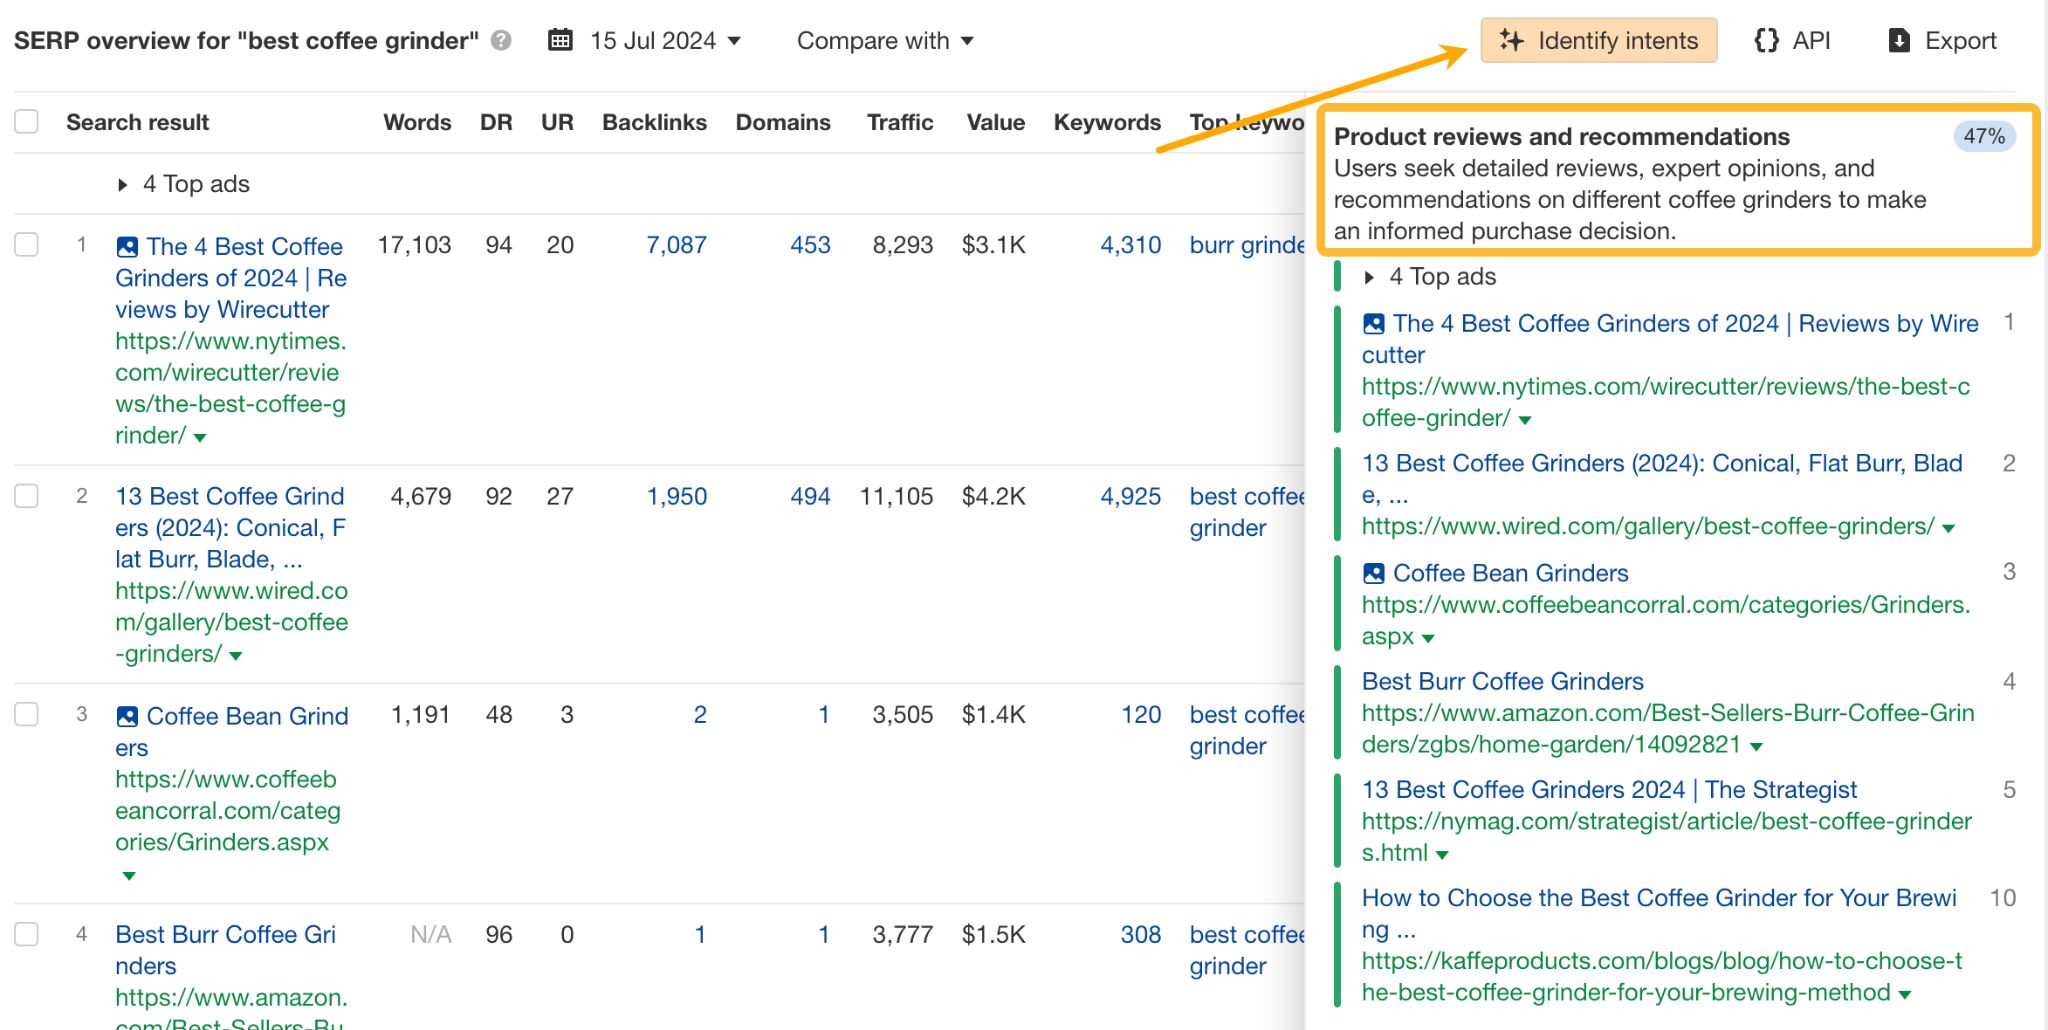

So, we can see that searchers looking for the keyword “best coffee grinders” want detailed reviews and expert recommendations on the best coffee grinders. Not only that, we can also see that searchers want a list that is fresh.
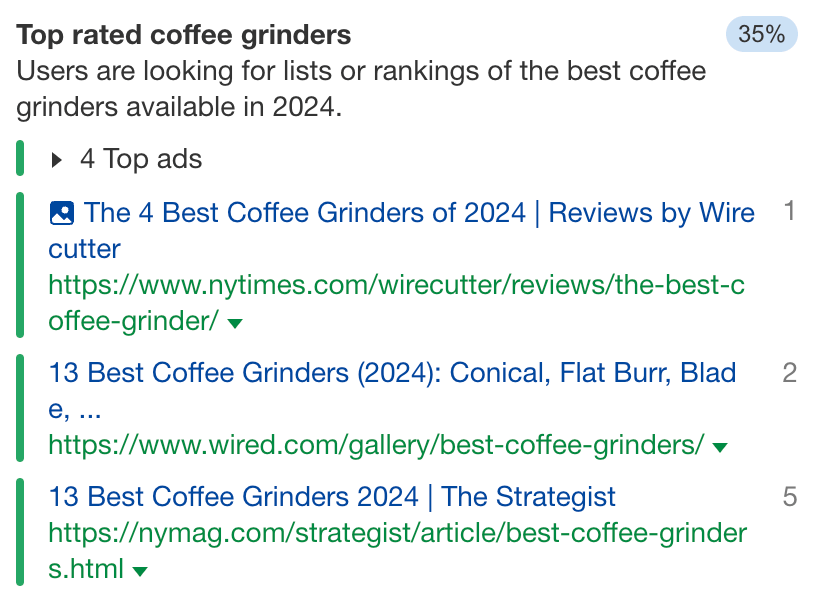

If we’re targeting this topic, making it search-focused means matching this search intent—we’ll need to create a list of the best coffee grinders for the current year.
Product-led
Product-led means ensuring you’re not just creating content for the sake of it; you’re also ‘selling’ your product. You want to be aware of which use case, feature, or service you want to weave into the narrative. Naturally, of course.
Scoring a topic’s business potential would have done 90% of the work here. If you’re creating content about a topic that scored a “3”, then your product pitch would be natural. For example, we could easily add links back to our coffee equipment store after covering the best coffee grinders. Or, if we make our coffee grinders, we could pitch them as one of the best. (That’s why I say the business potential score is our secret ingredient.)
The challenge comes when you’re covering topics that score a “1” or “0”. It’s not impossible, but you’ll need to be creative.
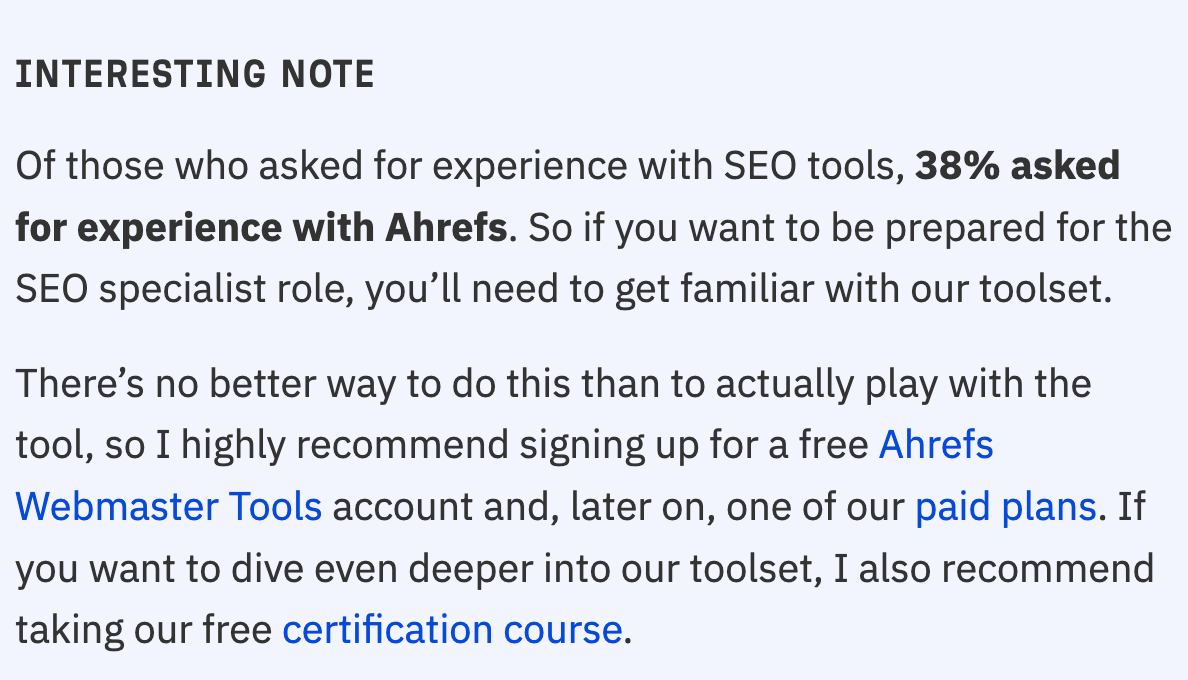
For example, I recently covered the topic “SEO specialist”. It had a business potential of “1” and was tough to include a product pitch. Fortunately, I noticed that some job listings asked for experience with different SEO toolsets (including us.) It was the perfect segue to introduce our product and certification course.

High-quality
This is subjective. Everyone’s standards are different. But here’s how we think of quality:
- Accurate — No hype, no lying. Every statement we make should be as accurate as possible.
- Clear — No fluff—delete all unnecessary words and sentences. Use jargon only when needed. When necessary, create illustrations to expand on ideas and concepts.
- Helpful — Being product-led is important but the content should not just be aimed at pitching. The content should be focused primarily on helping visitors solve their problems, while creatively weaving our product into the context.
- Unique — One way to make your content unique is to have skin in the game—conduct experiments, run data studies, and write from personal experience. If having skin is difficult, then interview practitioners. Focus on did, not could.
something i always look for when assessing the credibility of writing:
could/should/did
~ could: most writers talk about things you, the reader, could do. theoretical. abstract. based on no firsthand experience. should probably be disregarded. prime “content marketing”…
— Ryan Law (@thinking_slow) December 6, 2023
The deterioration of your content is inevitable:
- Search-focused — Your rankings may drop because of competitors. Or you didn’t even rank the first time round. Or your target topic’s search intent changed (e.g., the word corona’s search intent changed during the void years of 2020-2022.)
- Product-led — You may have new features, services, or use cases to introduce. Or your team has depreciated certain features or abandoned some services.
- High-quality — Statements may become inaccurate over time. Or your unique idea was so successful that everyone else copied you (and outranked you.) Or you might have better ways to reword sentences and paragraphs. Or just simply the ideas, screenshots, and content has become outdated.
That’s why you don’t build a train track and disappear. You have to actively maintain it to keep it working. (I’m looking at you London tube.) Same goes for your content.
The way to maintain your content is to conduct regular content audits. We do this every quarter—Each writer on our blog team goes through their portfolio of articles and selects at least three pieces to update. Each writer may also choose a couple to do a full rewrite.
I highly recommend going through our content audit template so you can see what went wrong with your content and what to do with it next.
Final thoughts
SEO and content marketing may be different marketing types, but that doesn’t mean you need to do one to the exclusion of the other.
Both channels are highly compatible and as you see above, can be designed as an entire strategy that hits all important marketing objectives.
SEO
Trending Content Output Compared in ChatGPT, Gemini & Claude

“Should we use ChatGPT, Gemini, or Claude to create trending content?”
That’s a good question – and one that I’m frequently asked when teaching a live class about engaging audiences through content.
You might mistakenly assume that instructors are supposed to answer questions like that. But my colleagues and I do something different.
We give our students relevant assignments that provide them with the opportunity to discover the answers to good questions for themselves.
This test-and-learn approach is something that you can also apply within your own company, agency, or team. Want to know which generative AI model to use to create trending content?
Well, conduct a test and compare the output.
Write Concise Descriptions Of The Most Emotionally Engaging Video Ads Of Euros 2024
You already know how to use Google Trends to identify search terms or topics that are trending now. In fact, many journalists use this free tool to get story ideas.
Over the long Fourth of July weekend, I used Google Trends and saw that the topic “Euros 2024” ranked No. 1 in Trending Searches with more than 1 million queries.
Next, I decided to avoid using OpenAI’s ChatGPT 3.5 for my tests. Why? Because it’s the most popular generative AI model, which means that your competitors are probably using it, too.
That means the content that this tool creates is less likely “to provide substantial value when compared to other pages in search results,” as Google’s long-standing advice recommends.
ChatGPT Output
So, I explored the custom versions of ChatGPT and selected Write For Me by puzzle.today.
Why? Because it ranked No. 1 in the Writing category. The tool also claimed it would help me “write tailored, engaging content with a focus on quality, relevance and precise word count.”
I want to create better content, not just content that is different from what everyone else is creating. So, I asked Write For Me to “write concise descriptions of the most emotionally engaging video ads of Euros 2024.”
Here’s what this generative AI tool produced:
1. Unity Through Football

 “A diverse group of children from different European countries come together on a pristine football pitch. As they play, the camera captures their joy and camaraderie, transcending language and cultural barriers. The ad concludes with a montage of professional players joining the children, emphasizing football's power to unite nations and foster friendship.”

2. Legacy of Legends

 “The ad begins with black-and-white footage of iconic moments from past Euros, highlighting legendary players. It transitions to vibrant, modern clips of current stars recreating these moments, symbolizing the passing of the torch. A heartfelt narration speaks to the continuity of dreams and the legacy carried by each generation.”

3. Homecoming

 “A montage of fans traveling from various parts of Europe to the host country, capturing their excitement and anticipation. Emotional reunions with fellow fans, old friends, and family members create a sense of belonging and community. The ad closes with a panoramic shot of a stadium filled with cheering supporters, underscoring the tournament's role in bringing people together.”

4. The Dream Begins

 “The ad follows a young aspiring footballer practicing tirelessly, inspired by their favorite Euros moments. Interspersed with clips of professional matches, it shows the child's journey from local games to a stadium filled with fans. The message is clear: dreams start small but can lead to greatness, encouraging viewers to pursue their passions.”

5. Heartbeat of the Game

 “This ad features a rhythmic sequence of football-related sounds: the thud of a ball, cheers from the crowd, and the whistle of the referee. These sounds build into a symphony, interspersed with clips of players’ intense focus and emotional celebrations. The heartbeat sound underscores the passion and excitement of the Euros, resonating with fans’ own emotions.”

6. From Streets to Stadiums

 “Children playing football in urban alleys, rural fields, and makeshift pitches across Europe are showcased. Their raw passion and joy are mirrored by professional players in grand stadiums, blurring the lines between dreams and reality. The ad concludes with a powerful message: football belongs to everyone, from the streets to the grandest arenas.
Now, it’s perfectly clear why video ads with these descriptions would be emotionally engaging, but it is frustratingly unclear which brands are running these ads during Euros 2024.
So, I’d have to do some double-checking to make sure that ChatGPT isn’t hallucinating.
Gemini Output
Next, I gave Google’s Gemini (formerly Bard) the same prompt. Here’s what this generative AI model produced:
1. Adidas: "Hey Jude" (Most Engaging)

 “This ad features rising England star Jude Bellingham alongside football legends like David Beckham and Frank Lampard. It taps into positive emotions by showcasing the passing of the torch and the enduring spirit of the game.”

2. Irn-Bru: "Get to Germany"

 “This ad, likely using humor, aims to create positive feelings and excitement around the Euros being held in Germany.”

3. Budweiser: "Bring it Home"

“This ad uses a patriotic theme, likely aiming to inspire viewers and evoke a sense of national pride for their team's chance to win the Euros.”
It’s perfectly clear which brands are running the most emotionally engaging video ads of Euros 2024, but it’s still unclear which methodology Gemini is using to make this selection.
So, I’d still have to do more due diligence to discover that it’s probably recent articles and posts about new research from DAIVID.
Claude Output
I asked Anthropic’s Claude 3.5 Sonnet to “write concise descriptions of the most emotionally engaging video ads of Euros 2024.” Here’s what this generative AI tool replied:
“I apologize, but I don't have access to specific information about video ads from Euro 2024, as my knowledge cutoff is in April 2024, and I can't browse the internet for current information.”

 “I can, however, offer some general thoughts on what makes emotionally engaging soccer/football ads:”

“Underdog stories of players or teams overcoming adversity.”
“Nostalgic montages showcasing historic Euro moments.”
“Depictions of passionate fans and their connection to the sport.”
“Inspirational messages about unity and international cooperation.”
“Cinematic recreations of iconic goals or plays.”

 “If you'd like me to expand on any of these concepts or discuss emotionally engaging sports ads in general, I'd be happy to do so. For accurate information about Euro 2024 ads, I'd recommend checking official UEFA sources or recent sports media coverage.”
Well, Claude’s honesty is admirable. But its knowledge cutoff means that I shouldn’t use this generative AI model for content about fairly recent trends.
Write Short Captions For The Funniest Photos From The 2024 Nathan’s Hot Dog Eating Contest
For my second test, I used the Google autocomplete feature to confirm that the phrase, [Nathan’s hot dog eating contest], was a trending search term.
Then, I asked each of the three generative AI tools to “write short captions for the funniest photos from the 2024 Nathan’s Hot Dog Eating Contest.”
ChatGPT Output
Here’s what Write For Me generated:
“Captions for Funniest Photos from the 2024 Nathan’s Hot Dog Eating Contest:”

"When you realize you're only halfway through your 50 hot dogs."
"Eyes on the prize: the ketchup bottle!"
"Training for this by swallowing my pride daily."
"When the bun hits you harder than the hot dog."
"Mustard not? I mustered up the courage!"
"New strategy: inhale, don’t chew."
"Hot dogs: 10, Dignity: 0."
"When you think it’s the last dog but it’s not."
"The face you make when you beat your personal best... by 1 dog."
"Calories don’t count if you don’t chew, right?"
Okay, I admit that many of these captions are funny. But it’s difficult to tell if they belong to actual photos or if this custom version of ChatGPT hallucinated the entire list.
And don’t get me started on getting permission to use any photos that exist. Of course, I could always use DALL-E 3 to turn the text above into images.
Gemini Output
Next, I gave Gemini the same assignment. Here’s what it generated:
1. Mustard Mishap: "Someone's about to be redecorated in yellow!" (Photo of a competitor with mustard splattered all over their face).

2. Relish the Moment: "This is what pure competitive joy looks like." (Photo of a competitor mid-devour with a look of intense concentration and relish dripping down their chin).

3. Bun Bungee: "Is that a hot dog or a bungee jumper? Defying the laws of physics, one frankfurter at a time." (Photo of a competitor with a hot dog halfway down their esophagus).

4. Fountain of Fury: "Looks like someone forgot their manners! (But they're probably winning.)" (Photo of a competitor with a spray of water and ketchup erupting from their mouth).

5. Doggy Downtime: "Even champions gotta rest sometimes. (Just don't let Joey Chestnut see this.)" (Photo of a competitor slumped back in their chair with a belly full of hot dogs).”
Um, okay. These are also funny captions.
But it’s hard to know if they go with actual photos that were posted on July 4, 2024, without using Google Images to conduct a series of relevant searches. And that still doesn’t give me permission to use them even if they do exist.
[Note, these responses were generated a few days before Google announced their support for labelling AI-generated images.]Claude Output
Then, I asked Claude 3.5 Sonnet to “write short captions for the funniest photos from the 2024 Nathan’s Hot Dog Eating Contest.” Here’s what it replied:
“I apologize, but I don't have access to specific photos from the 2024 Nathan's Hot Dog Eating Contest, as my knowledge cutoff is in April 2024. Additionally, I can't generate, produce, edit, manipulate or create images.”

 “However, I can suggest some hypothetical humorous captions that might be appropriate for funny moments at a hot dog eating contest:”

"When the hot dogs fight back"
"Regretting that 50th hot dog"
"Mid-contest nap: Expert level achieved"
"Ketchup everywhere... except on the hot dogs"
"When you realize it's only been 2 minutes"
"The face of a champion... or indigestion"
"Spectators' faces: Equal parts horror and awe"
"When the bun-to-dog ratio is all wrong"
"Competitive eating: Where table manners go to die"
"That moment you question all your life choices"


“Remember, these are fictional captions for imaginary photos. For accurate information about the 2024 contest, you'd need to check official sources or news reports from after the event.”
Once again, Claude gets high marks for being honest about its limitations.
But unless I want to select some of these hypothetical humorous captions and use them as prompts in Adobe Firefly, then I need to use one of the other options.
Write A 400-Word Blog Post About The Top Omni Channel Retailing Trends Of 2024
For my third test, I used SparkToro to research the audience of 5,000 to 6,000 people who search for the keyword [customer retention] each month.
I used SparkToro’s trending keywords feature to analyze the search terms that have risen in popularity among searchers for “customer retention” over the last quarter.
Then, I selected the trending keyword, “omni channel retailing trends,” for this test.
ChatGPT Output
When I asked Write For Me to “write a 400-word blog post about the top omni channel retailing trends of 2024,” here’s what this generative AI tool produced:
Top Omnichannel Retailing Trends of 2024

 “As we move into 2024, the landscape of retail continues to evolve rapidly, driven by technological advancements and changing consumer expectations. Omnichannel retailing, which integrates various shopping channels into a seamless customer experience, remains at the forefront of this evolution. Here are the top omnichannel retailing trends to watch out for in 2024.”

1. Enhanced Personalization Through AI and Data Analytics
“In 2024, personalization goes beyond just using the customer’s name in emails. Retailers are leveraging advanced AI and data analytics to offer hyper-personalized shopping experiences. By analyzing consumer behavior, preferences, and purchase history, retailers can tailor recommendations, promotions, and content to individual customers. This level of personalization enhances customer satisfaction and increases conversion rates.”

2. Seamless Integration of Physical and Digital Channels
“The line between online and offline shopping continues to blur. In 2024, more retailers are perfecting the integration of physical and digital channels. Innovations like in-store augmented reality (AR) mirrors, smart fitting rooms, and mobile app functionalities that enhance in-store experiences are becoming standard. Additionally, services like click-and-collect and in-store returns for online purchases are expected to become more streamlined and widespread.”

3. Expansion of Mobile Commerce (M-Commerce)
“Mobile commerce continues to grow as consumers increasingly use their smartphones for shopping. Retailers are optimizing their mobile websites and apps to provide faster, more intuitive, and secure shopping experiences. Features like one-click purchasing, mobile wallets, and personalized push notifications are becoming essential components of mobile strategies.”

 4. Social Commerce Revolution
“Social media platforms are transforming into powerful retail channels. In 2024, social commerce, where shopping experiences are embedded within social media, is set to explode. Platforms like Instagram, Facebook, and TikTok are enhancing their shopping functionalities, allowing users to discover, browse, and purchase products without leaving the app. Influencer marketing and user-generated content continue to drive this trend, making social media a critical part of omnichannel strategies.”

5. Sustainable and Ethical Retailing
“Consumers are increasingly demanding sustainability and transparency from the brands they support. In response, retailers are incorporating sustainable practices and ethical sourcing into their omnichannel strategies. This includes offering eco-friendly products, reducing packaging waste, and providing transparency about product origins and manufacturing processes. Brands that can effectively communicate their sustainability efforts through all channels will gain a competitive edge.”

6. Voice Commerce and Conversational AI
“Voice-activated shopping and conversational AI are becoming more prevalent. With the rise of smart speakers and virtual assistants, consumers are using voice commands to search for products, place orders, and track deliveries. Retailers are integrating voice commerce capabilities into their omnichannel strategies to enhance convenience and improve customer engagement.”

Conclusion
“In 2024, the retail industry is embracing these omnichannel trends to create more cohesive and engaging shopping experiences. By focusing on personalization, integrating physical and digital channels, leveraging mobile and social commerce, prioritizing sustainability, and adopting voice commerce, retailers can stay ahead in a competitive market. These trends highlight the importance of flexibility and innovation in meeting the evolving needs of modern consumers.”
Um, okay. This is 498 words long. This content seems designed for publication at the beginning of the year.
The blog post is missing citations from reliable sources, credible quotes, and relevant statistics, as Roger Montti’s article, “Researchers Discover How To SEO For AI Search,” noted back on Dec. 18, 2023.
So, it’s not as bad as a first draft. But I would hope that writers would learn by using this custom version of ChatGPT that they need to craft something a little bit better.
Gemini Output
Next, I asked Gemini to tackle the same assignment. Here’s what this generative AI tool produced:
The Future of Shopping: Top Omnichannel Retail Trends in 2024

“The retail landscape is ever-evolving, and 2024 is no exception. Consumers today expect a seamless shopping experience, regardless of whether they're browsing online, visiting a physical store, or interacting with a brand on social media. This is where omnichannel retail thrives. By creating a unified experience across all touchpoints, retailers can build stronger customer loyalty and drive sales.”

“Let's delve into the top omnichannel retail trends shaping the industry in 2024:”

 1. The Rise of the Data-Driven Experience:
 “With the demise of third-party cookies, retailers are focusing on collecting and utilizing first-party customer data. This data allows for real-time personalization across all channels. Imagine receiving targeted email promotions based on your recent in-store purchases, or seeing personalized product recommendations on a brand's app. Advanced analytics will not only personalize marketing efforts but also optimize search functionalities and product merchandising on e-commerce platforms.”

 2. AI Takes Center Stage:
“Artificial intelligence (AI) is rapidly transforming the retail experience. AI-powered chatbots can answer customer queries 24/7, recommend products based on browsing history, and even assist with in-store tasks. Generative AI can create personalized marketing content at scale, while AI-driven sales automation streamlines processes for both retailers and customers.”

3. The Blur Between Physical and Digital:
“The lines between online and offline shopping are continuing to blur. We're seeing a rise in ‘phygital’ experiences, such as augmented reality (AR) apps that allow customers to virtually try on clothes or visualize furniture in their homes. In-store kiosks can facilitate online purchases and allow for easy returns or exchanges. Additionally, ‘showrooming,’ where customers browse in-store and then purchase online, necessitates seamless product availability and pricing across channels.”

4. Social Commerce Takes Off:
“Social media platforms are no longer just for browsing; they're becoming powerful shopping destinations. ‘Live shopping’ experiences with influencers showcasing products are gaining traction, while social media platforms are integrating smoother buying functionalities within their apps. User-generated content and social proof will continue to influence purchasing decisions, making social media a crucial touchpoint in the omnichannel journey.”

 5. Personalization Beyond Products:
“The future of omnichannel retail goes beyond just product recommendations. Retailers are focusing on creating personalized experiences that cater to individual customer preferences. This could involve offering flexible delivery options, loyalty programs with tiered benefits, or the ability to curate in-store shopping experiences through appointments or personalized product selections.”

Conclusion:
“In today's competitive retail environment, omnichannel isn't just a trend; it's a necessity. By embracing these trends and prioritizing a data-driven, personalized approach, retailers can not only survive but thrive in the ever-evolving landscape of commerce.”
Well, the headline is better and it’s 433 words long, which is closer to what I’d asked for. But this blog post is also missing citations from reliable sources, credible quotes, and relevant statistics.
So, I hope writers would learn the same lesson by using Gemini that they learned using a custom version of ChatGPT: It’s not bad, but a human with experience and expertise can do better.
Claude Output
Finally, I asked Claude 3.5 Sonnet to “write a 400-word blog post about the top omni channel retailing trends of 2024.” Here’s what this generative AI tool produced:
Top Omnichannel Retailing Trends Shaping 2024

“As we navigate through 2024, the retail landscape continues to evolve rapidly. Omnichannel strategies have become more crucial than ever, with consumers expecting seamless experiences across all touchpoints. Let's explore the key trends defining omnichannel retailing this year.”

1. AI-Powered Personalization: “Artificial intelligence is revolutionizing how retailers understand and cater to individual customer preferences. In 2024, we're seeing more sophisticated AI algorithms that analyze customer data across channels to deliver hyper-personalized recommendations, offers, and experiences.”

2. Augmented Reality Integration: “AR is bridging the gap between online and offline shopping. Retailers are leveraging AR technology to allow customers to virtually try on clothes, visualize furniture in their homes, or explore products in detail before making a purchase decision.”

3. Social Commerce Acceleration: “Social media platforms are increasingly becoming direct sales channels. Retailers are optimizing their presence on platforms like Instagram, TikTok, and Pinterest, enabling in-app purchases and creating shoppable content that seamlessly integrates with users' social experiences.”

4. Sustainable and Ethical Omnichannel Practices: “Consumers are more environmentally conscious than ever. Retailers are responding by implementing sustainable practices across their omnichannel operations, from eco-friendly packaging to transparent supply chains and ethical sourcing information available across all channels.”

5. Voice Commerce Integration: “With the growing adoption of smart speakers and voice assistants, retailers are optimizing their digital presence for voice search and enabling voice-activated purchases, adding another dimension to the omnichannel experience.”

6. Phygital Experiences: “The blend of physical and digital experiences, or ‘phygital,’ is gaining traction. Retailers are creating innovative in-store digital touchpoints and bringing elements of the physical store experience to online platforms.”

7. Unified Customer Data Platforms: “Retailers are investing in advanced customer data platforms that consolidate information from all channels, providing a single view of the customer and enabling more cohesive marketing and service strategies.”

8. Flexible Fulfillment Options: “The line between online and offline continues to blur with the expansion of services like buy online, pick up in-store (BOPIS), curbside pickup, and same-day delivery. Retailers are optimizing their logistics to offer customers maximum flexibility.”

9. Subscription-Based Models: “More retailers are incorporating subscription services into their omnichannel strategies, providing regular product deliveries or exclusive access to content and experiences across multiple platforms.”

10. Advanced Analytics for Real-Time Insights: “Retailers are leveraging advanced analytics tools to gain real-time insights into customer behavior across channels, allowing for quick adjustments to inventory, pricing, and marketing strategies.”

“As these trends show, the future of retail lies in creating cohesive, customer-centric experiences that seamlessly blend online and offline touchpoints. Retailers who successfully adapt to these omnichannel trends will be well-positioned to thrive in the dynamic retail environment of 2024 and beyond.”
Claude’s content is 443 words long, which is longer than Gemini’s, but shorter than the custom version of ChatGPT. And Claude generated 10 trends, while ChatGPT generated six, and Gemini generated five.
But just like the other generative AI tools, Claude’s blog post is missing citations from reliable sources, credible quotes, and relevant statistics.
So, Claude is also good at creating a rough draft. But I’d hope that writers would learn by using ChatGPT, Gemini, and Claude that they shouldn’t become a tool of their tools.
AI Is Not Going To Take Your Job
A year ago, Jensen Huang, the founder, president, and CEO of Nvidia, said,
“AI is not going to take your job. The person who uses AI is going to take your job.”
Well, a year later, we’ve learned by comparing the content output generated by ChatGPT, Gemini, and Claude that it’s still smarter to use generative AI tools to brainstorm or create a good first draft.
Then, use your experience, expertise, authoritativeness, and trustworthiness (E-E-A-T) to add emotionally engaging videos, eye-catching photos, citations from reliable sources, credible quotes, and relevant statistics to your content.
Why? Because this is the best way to provide substantial value when compared to other pages in search results.
More resources:
Featured Image: jomel alos/Shutterstock
SEO
Can You Spot Google Updates with XmR Charts?

Website traffic data normally looks like this:
Ups and downs, peaks and troughs.
If we’re doing our job properly, we generally expect traffic to trend upwards over time, but in any given month, it’s difficult to say whether a peak or a trough is worth paying attention to.
Did we do something great and trigger a new phase of growth? Did we benefit from a new Google update? Or is it just normal variation, part of the natural ebb and flow of people finding our website?
Or suppose you make a change to your content process—you pruned and redirected a bunch of old content—and then traffic dropped the next month. Was that drop caused by the change, or was it just a coincidence?
I’ve been experimenting with a simple statistical tool designed to help answer these questions: XmR charts, also known as process control charts.
Here’s an XmR chart:
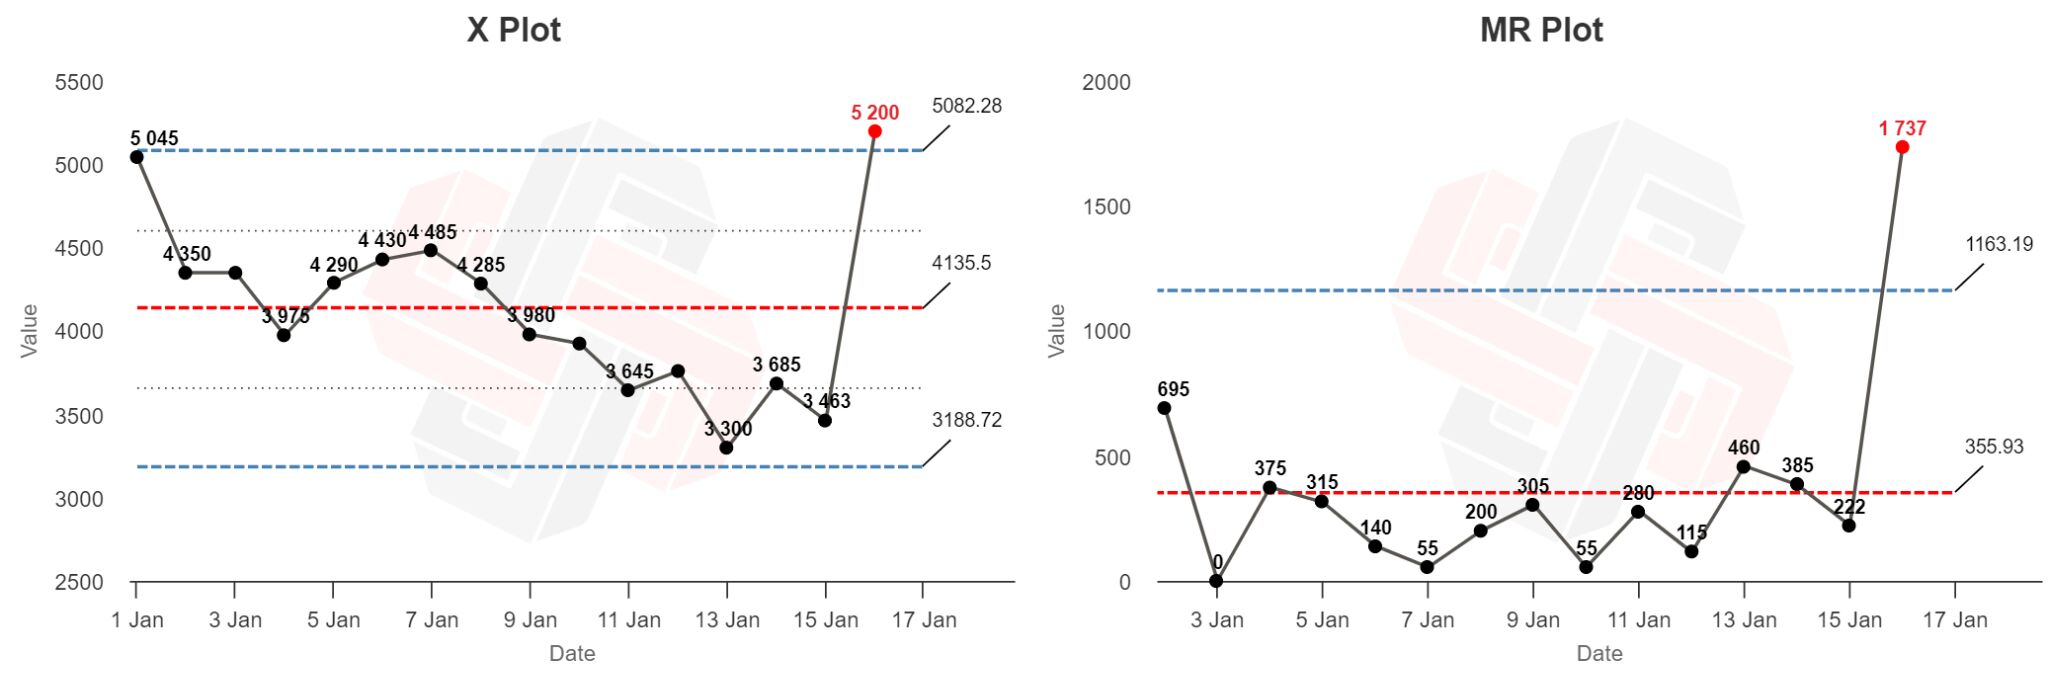

XmR charts are designed to tell you whether any single data point from a time series is likely to be caused by normal fluctuation (“routine variation”) or a sign that something happened and needs to be investigated (“exceptional variation”).
XmR charts consist of an X plot (named after the x-value, the “thing” we care about—like widgets produced or sales closed)…
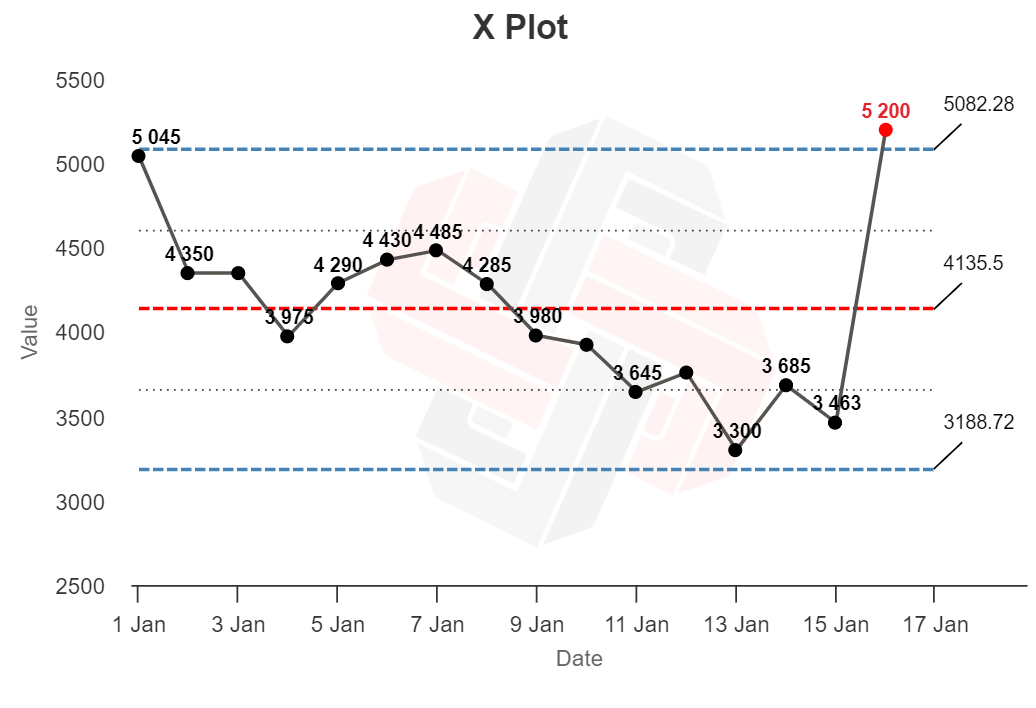

…and an MR plot (named after the moving range, basically the “gap” between each data point):
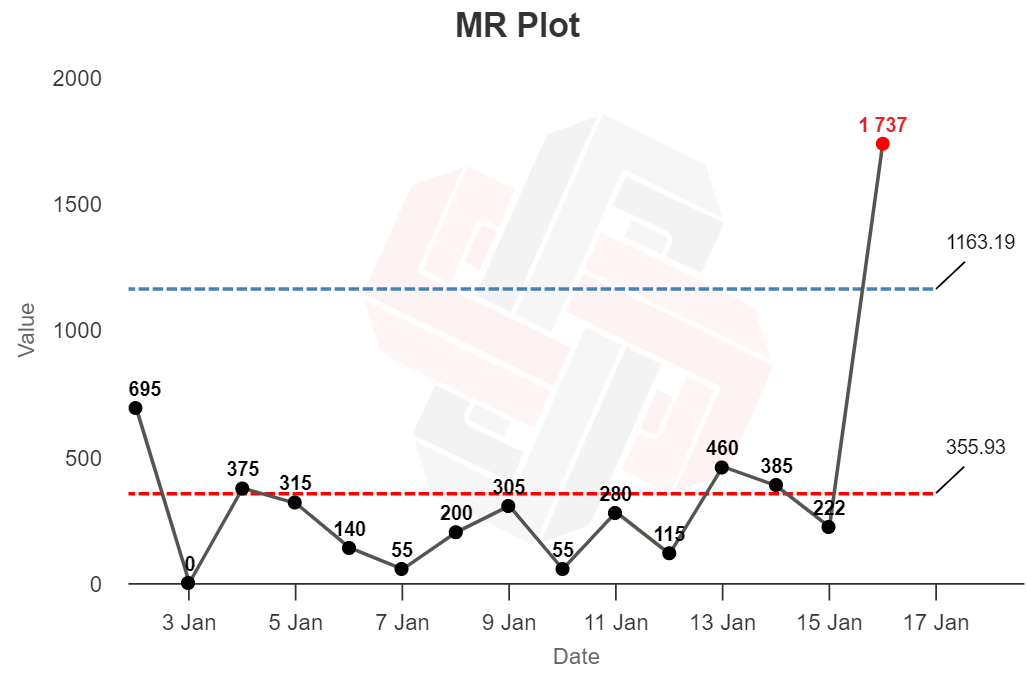

In its simplest use, if you plot your data on the chart and it wiggles up and down around the central line, without crossing the upper and lower bounds—no problem! These ups and downs likely represent normal variation.
But any points that appear outside the upper or lower bounds (shown in red) should be treated as anomalies that need to be investigated.
In the X plot above, the time series seems to show routine variation until January 16th, when the first red out-of-bounds point appears.
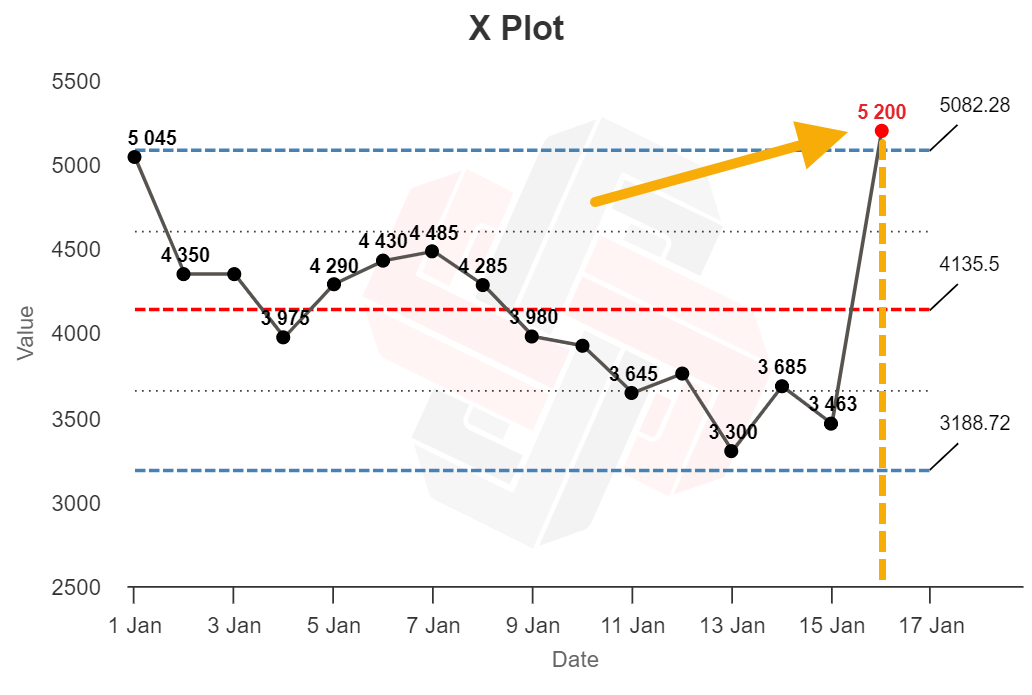

The XmR chart suggests that something happened on the 16th to mess with our production process (for better or for worse). Our job is to investigate why.
Sidenote.
The line in the middle is the average value of the dataset; the upper and lower bounds represent 3-standard deviations away from the average (known as three-sigma). Any point that falls outside of these upper and lower bounds is very likely to be an anomaly, and not part of the original probability distribution.
There are other “signals” that the XmR chart can show you (like eight consecutive points on one side of the average line representing another type of exceptional variation)—but I will leave you to investigate those on your own time.
When I started reading about XmR charts, one obvious use came to mind: identifying the impact of Google algorithm updates.
If a site’s traffic tanks to zero, it’s easy to say “we were hit by a manual penalty.” But for smaller changes, like a few months’ consecutive traffic decline, it’s harder to work out the cause. Did we get caught out by a Google update? Is it seasonality? Or is it just a coincidence, with traffic likely to return to normal in the future?
Here’s two years of monthly organic traffic data for the Ahrefs blog, pulled from Site Explorer and plotted on an XmR chart:
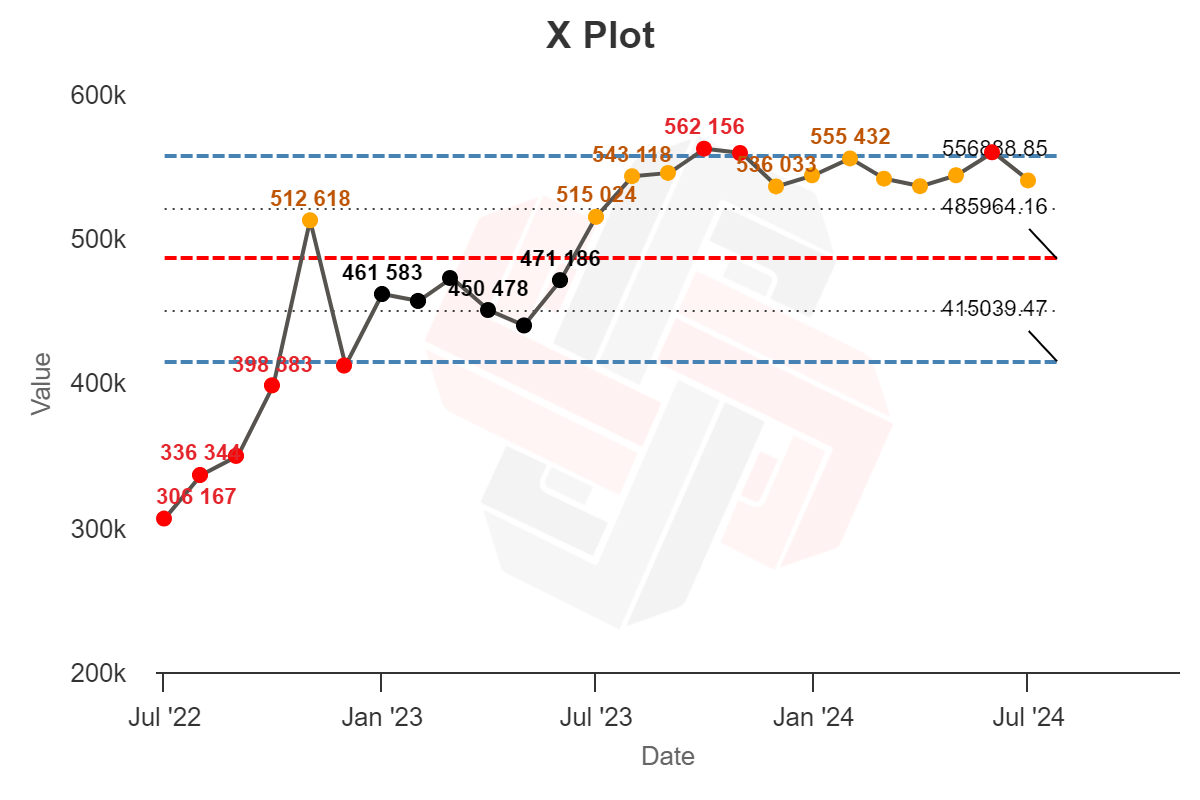

Now… this is not particularly useful.
There are tons of data points outside the expected range (red), with very few sitting nearer the center line than the quartile limits (orange).
The XmR chart is supposed to show exceptional variation in a consistent process—but in this image, almost all of the data points suggest exceptional variation. What gives?
Process charts were designed around simple manufacturing processes, and they work very well when the expected output of a process is constant.
If your goal is manufacturing 10,000 widgets each and every week, an XmR chart will help you work out if that 5,600-widget month was a normal “blip” in routine operation, or caused by a real problem that needs to be investigated.
Website traffic is more complicated. There are tons of variables that impact traffic:
- the fluctuating search volume of each topic,
- individual ranking positions,
- new competing articles,
- search features,
- seasonality,
- publishing frequency,
- Google algorithm updates…
That means that running an XmR analysis on a long series of traffic data probably won’t be very helpful. Your “blogging process” is not likely to remain stable for very long.
In my case, this particular two-year snapshot of data probably doesn’t come from a single, stable process—there may be multiple probability distributions hidden in there.
But we can make the analysis more useful.
The best practice for XmR charts is to limit the analysis to a period of time when you know the process was relatively static, and recalculate it when you suspect something has changed.
Looking at the Moving Range chart for this data below, large amounts of traffic variance happened in November and December. We should investigate possible causes. 

I know that our publishing frequency was fairly static (we definitely didn’t double our content output). Seasonality would cause a traffic drop, not a spike (we’re writing about SEO, not holiday gift guides).
But there was a big Google update at the start of December:
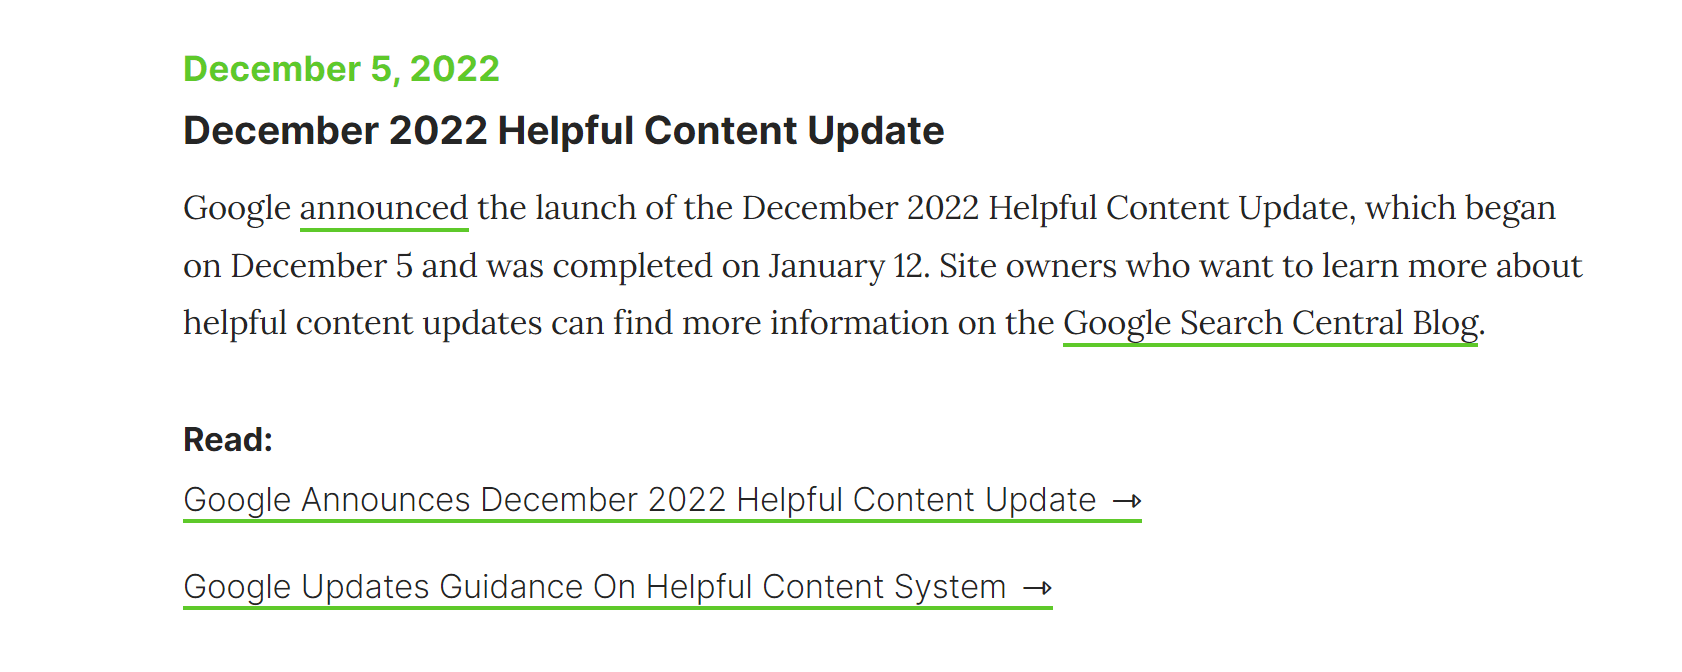

If we work on the assumption that something happened to our blog process around this time—likely a change to traffic caused by the Google update—we can add a divider to our XmR chart.
Instead of trying to analyze our traffic as a single process, we can treat it as two processes, and calculate XmR charts separately:
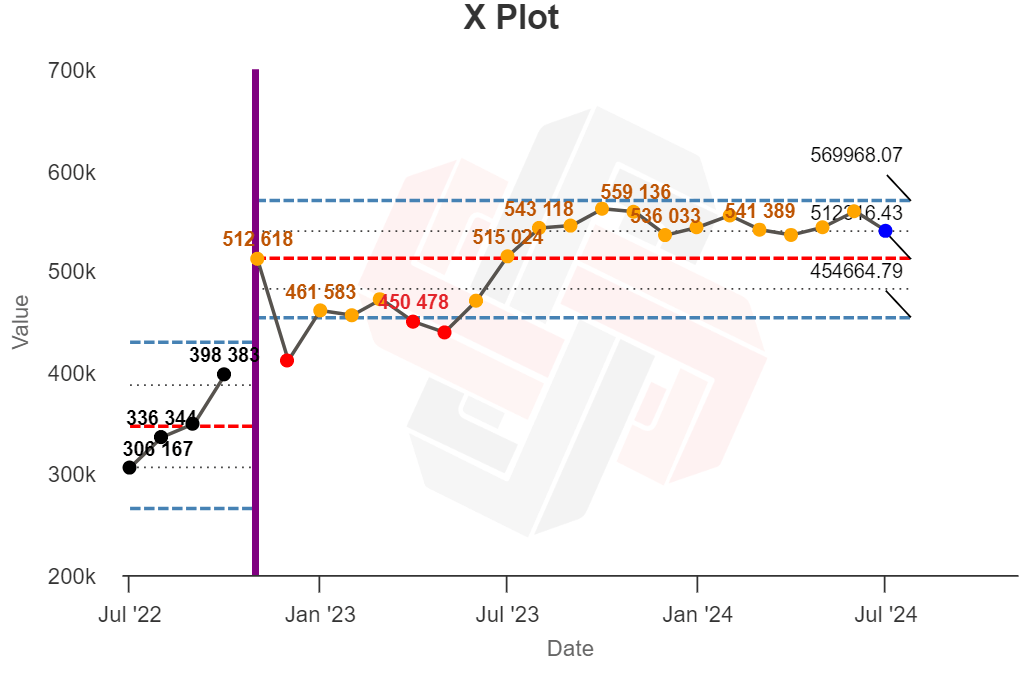

Now the first process looks stable (all black dots). The second process shows less extreme variation (red) too, but there’s still too much moderate variation (orange) to look stable. There may be another process lurking within.
And per a rule of thumb for analyzing XmR charts: “the duration of an XmR chart needs to be revisited when a ‘long-run’ of data remains above or below the Average line.” This trend begins in late summer (which is also around the time that Google announced another core update):


We can add another divider at the start of this “long-run” of data to create three separate XmR analyses:
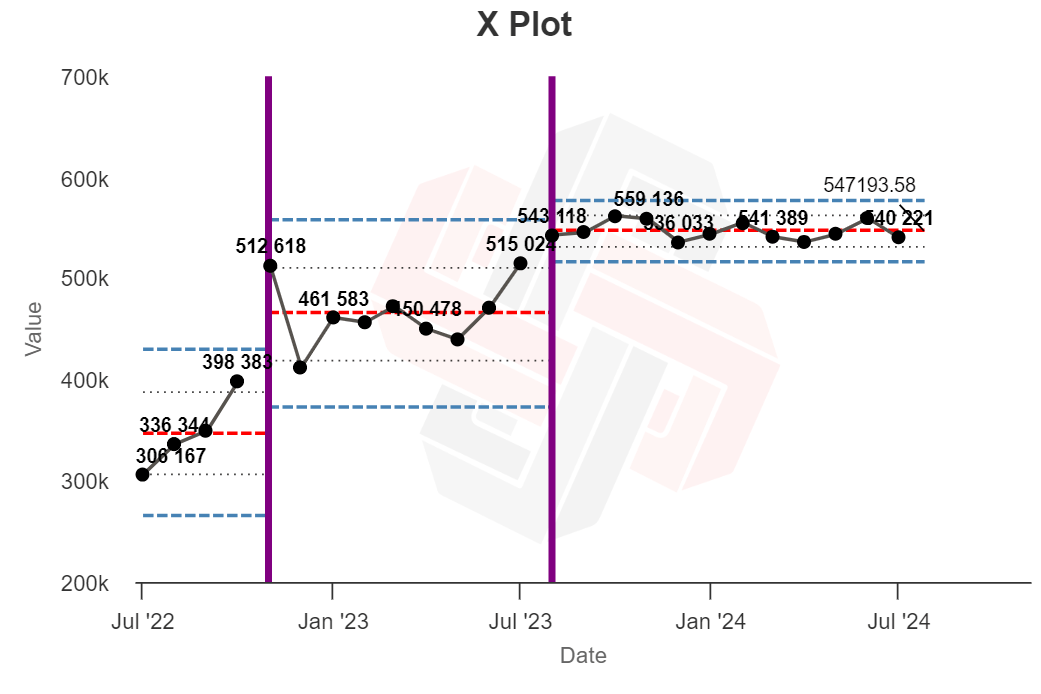

In doing so, all three analyses seem stable, with no points of extreme variance. In other words, we seem to have done a good job at capturing three distinct processes happening within our traffic data.
From this analysis, there seems to be a good chance that our traffic was impacted by external factors around the time of two major Google updates.
Now… this is basically a post-hoc data torturing exercise. We can’t infer any causation from this analysis, and it’s entirely possible that other arbitrary divisions would yield similar results.
But that’s okay. These charts can’t give you definitive, concrete reasons why your traffic changed, but they can tell you where to look, and help you work out whether troubleshooting a traffic dip or spike is a good use of your time.
The ultimate measure of a model’s usefulness is its ability to help you predict things. Will XmR charts help me do a better job running the Ahrefs blog in the future?
I think yes.
Assuming my “blog process” remains relatively stable—I publish at the same frequency, target the same topics, compete with the same competitors—I now have a set of “stable” data that I can use to provide extra context for future traffic numbers:
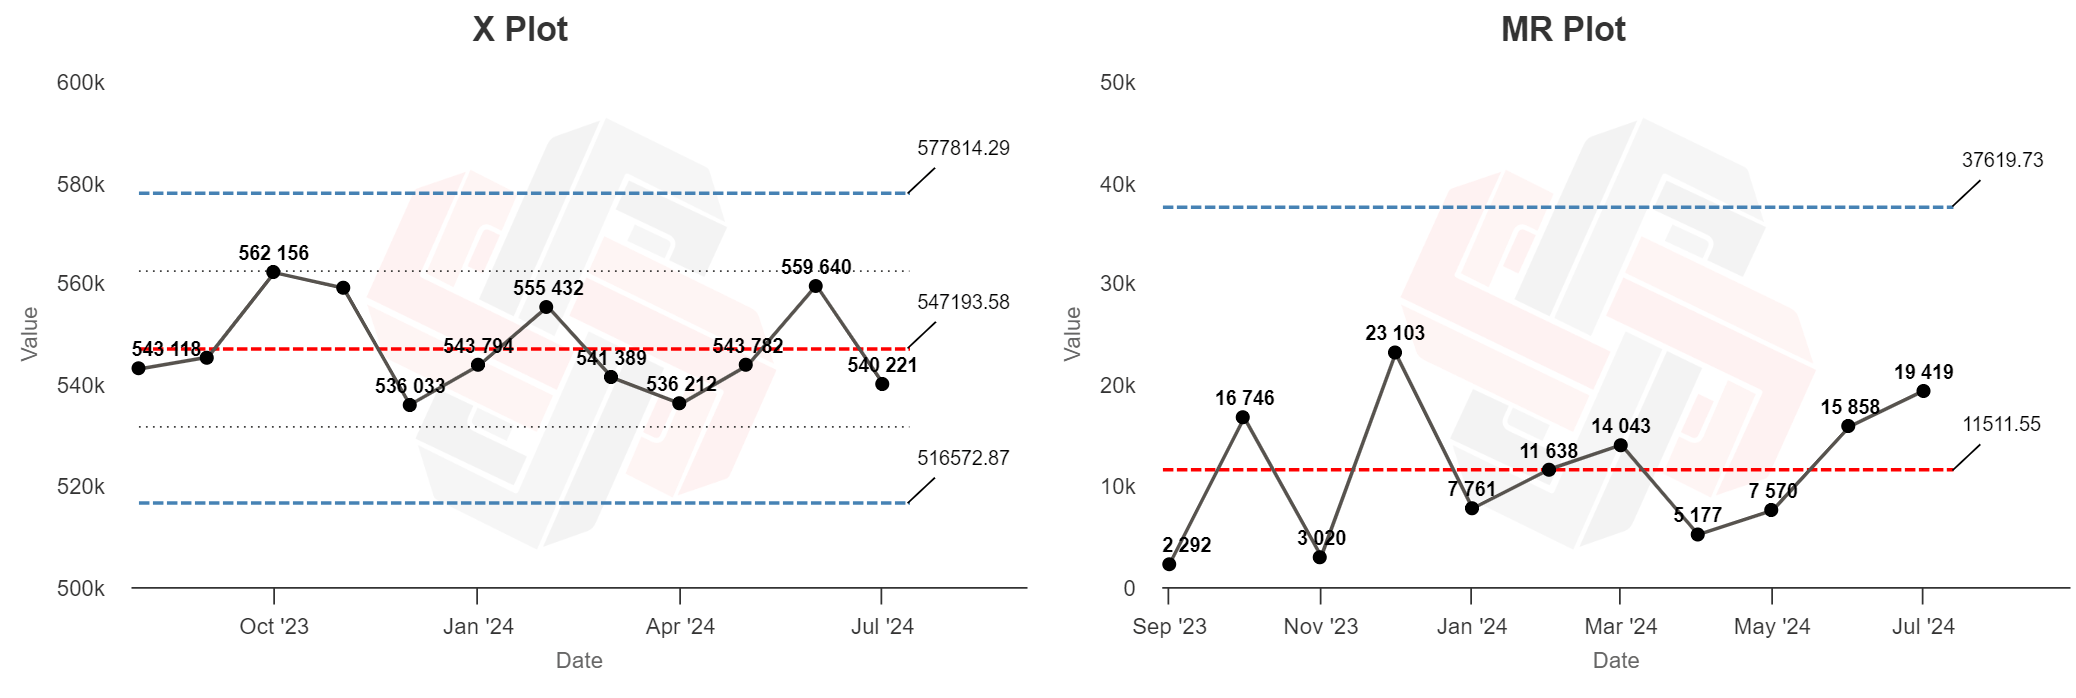

In the months that follow, I can work out whether dips or spikes in our traffic are likely the result of normal variance, or whether something has changed that requires my attention—like a Google update.
If, for example, my traffic does this next month… 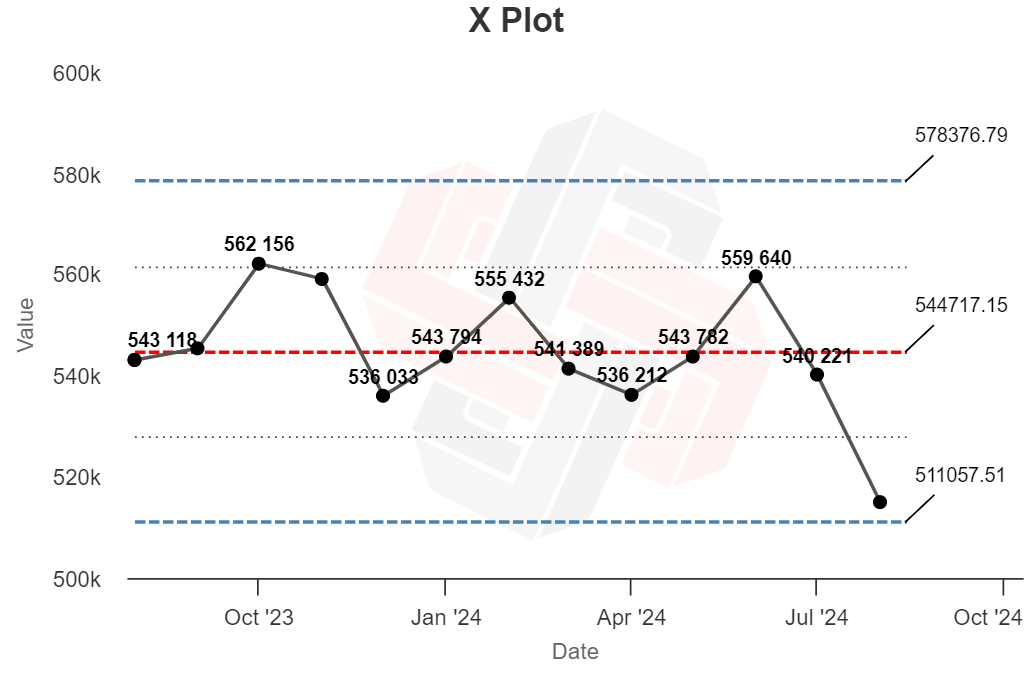

…I know that—given this distribution—that traffic drop could well be normal, unexciting variance.
But if it does this…
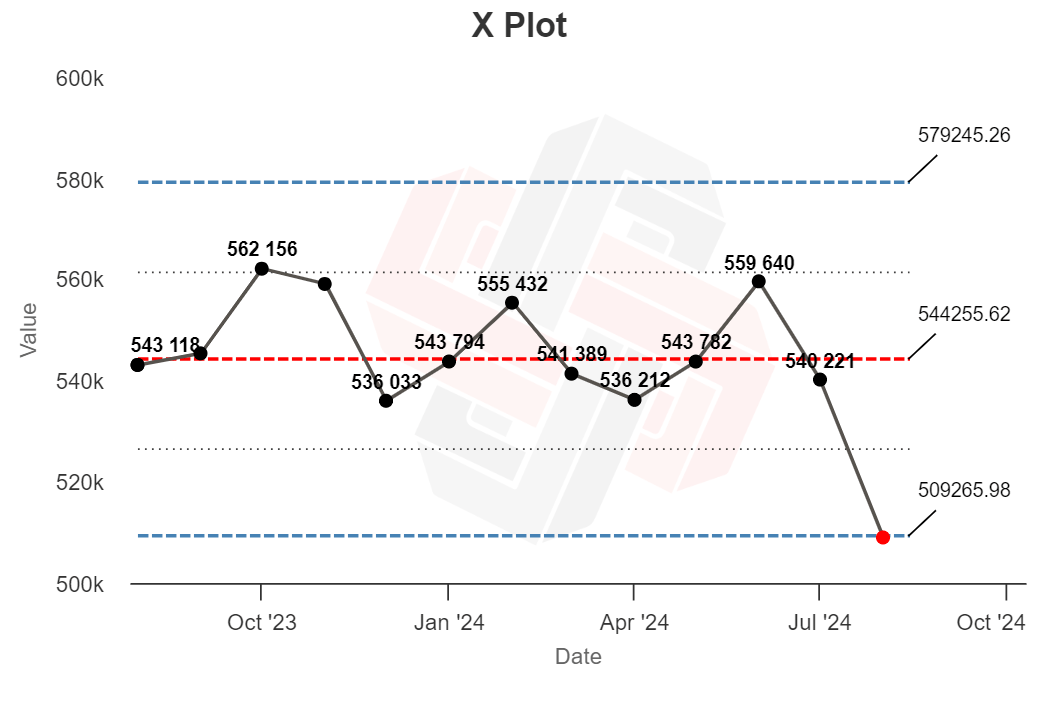

…there’s probably something else at work.
With extreme traffic changes you can usually “eyeball” traffic charts and guess what happened. But XmR charts are useful for more subtle variations, and there’s a chance I will be able to identify and act on just a single month’s worth of data. That’s pretty cool.
Final thoughts
Troubleshooting traffic changes is a big challenge for SEOs and content marketers (and we’re working on a few ways to help you identify the signal amongst the noise of your traffic data).
In the meantime, I have found XmR charts an interesting tool in my toolkit, useful for contextualizing my monthly reporting numbers and justifying when I should (or shouldn’t) spend my energy troubleshooting a down month.
(At the very least, XmR charts might just give you the confidence necessary to say “get off my back” when that VP sends you a brusque 3AM email complaining about last month’s 8% traffic dip.)
Sidenote.
Thanks to Benyamin Elias, VP of Marketing at Podia, for introducing me to XmR charts.
-

 WORDPRESS6 days ago
How to Connect to API of eCommerce Platform
-

 SEO7 days ago
Google’s Indifference To Site Publishers Explained
-

 WORDPRESS7 days ago
10 Steps for Profitable Home Based Clothing Businesses in 2024
-
SEARCHENGINES5 days ago
Daily Search Forum Recap: July 17, 2024
-

 SEO6 days ago
Google’s Web Crawler Fakes Being “Idle” To Render JavaScript
-

 AFFILIATE MARKETING6 days ago
Beware of These Risky Sales Tactics That Are Doomed to Fail or Backfire
-

 SEARCHENGINES6 days ago
Google Core Update Expected In Coming Weeks
-

 SEO4 days ago
What SEO Should Know About Brand Marketing With Mordy Oberstein


You must be logged in to post a comment Login