SEO
Does Adding a Related Post Section Help Your Blog? We Tested It
We already do a great job with internal linking on the Ahrefs blog. But we wondered if adding a related posts section would help us and whether users would use it.
Our marketing team was fairly split on whether we should have a section like this and whether it would help. I’ve had great results with this personally on sites with a lot of content, and I was convinced it would help the Ahrefs blog.
In December 2022, we added the “Keep Learning” section at the bottom of the posts using a popular related posts plugin for WordPress. Here’s what it looks like:
When I looked back to check what happened, the results were okay, but nothing spectacular. We saw a slight uptick overall, but based on the trend, I couldn’t conclude it had anything to do with the internal linking.
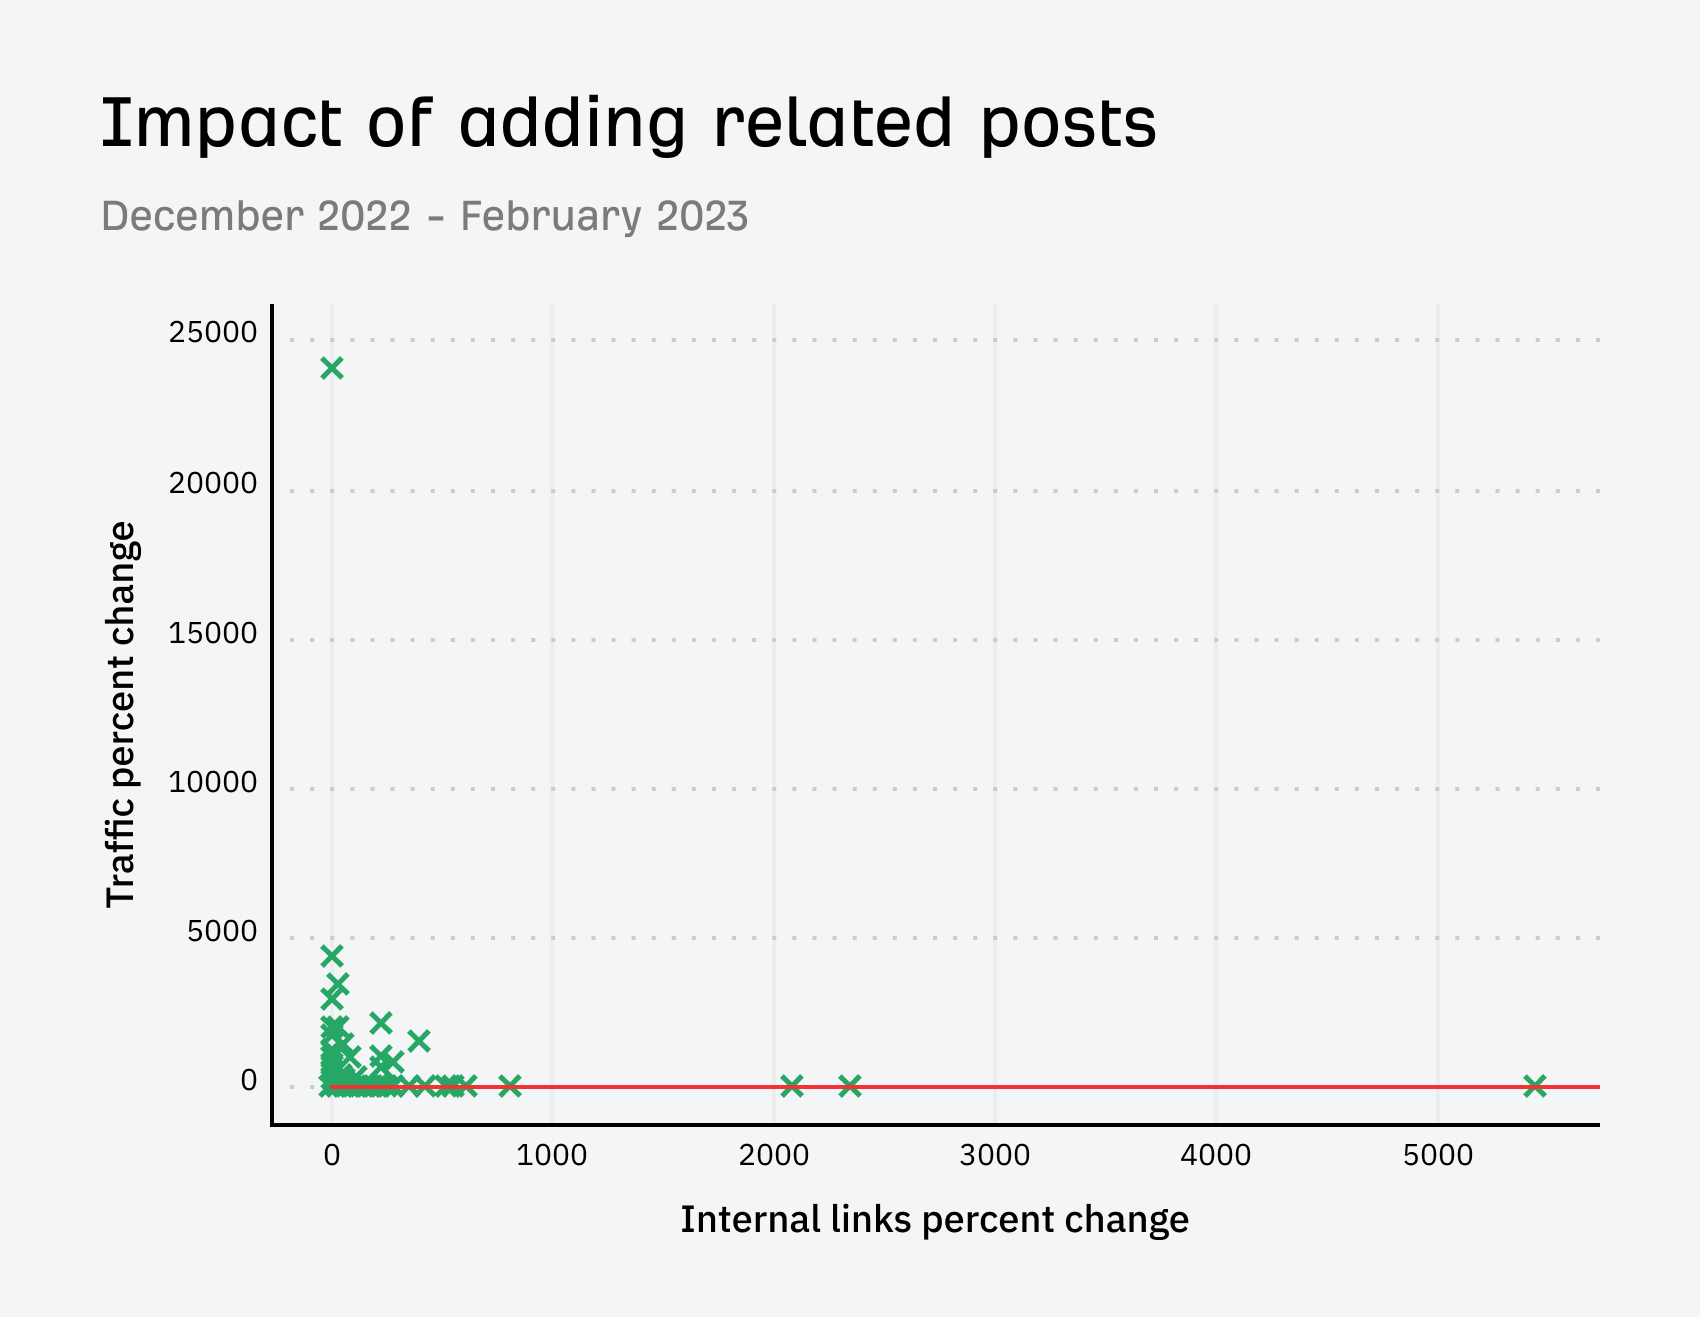

Two algorithm updates rolled out during the period we added the related posts: a Helpful Content Update and a Link Spam Update. This made the test data messy, but we decided to leave it for a while anyway.
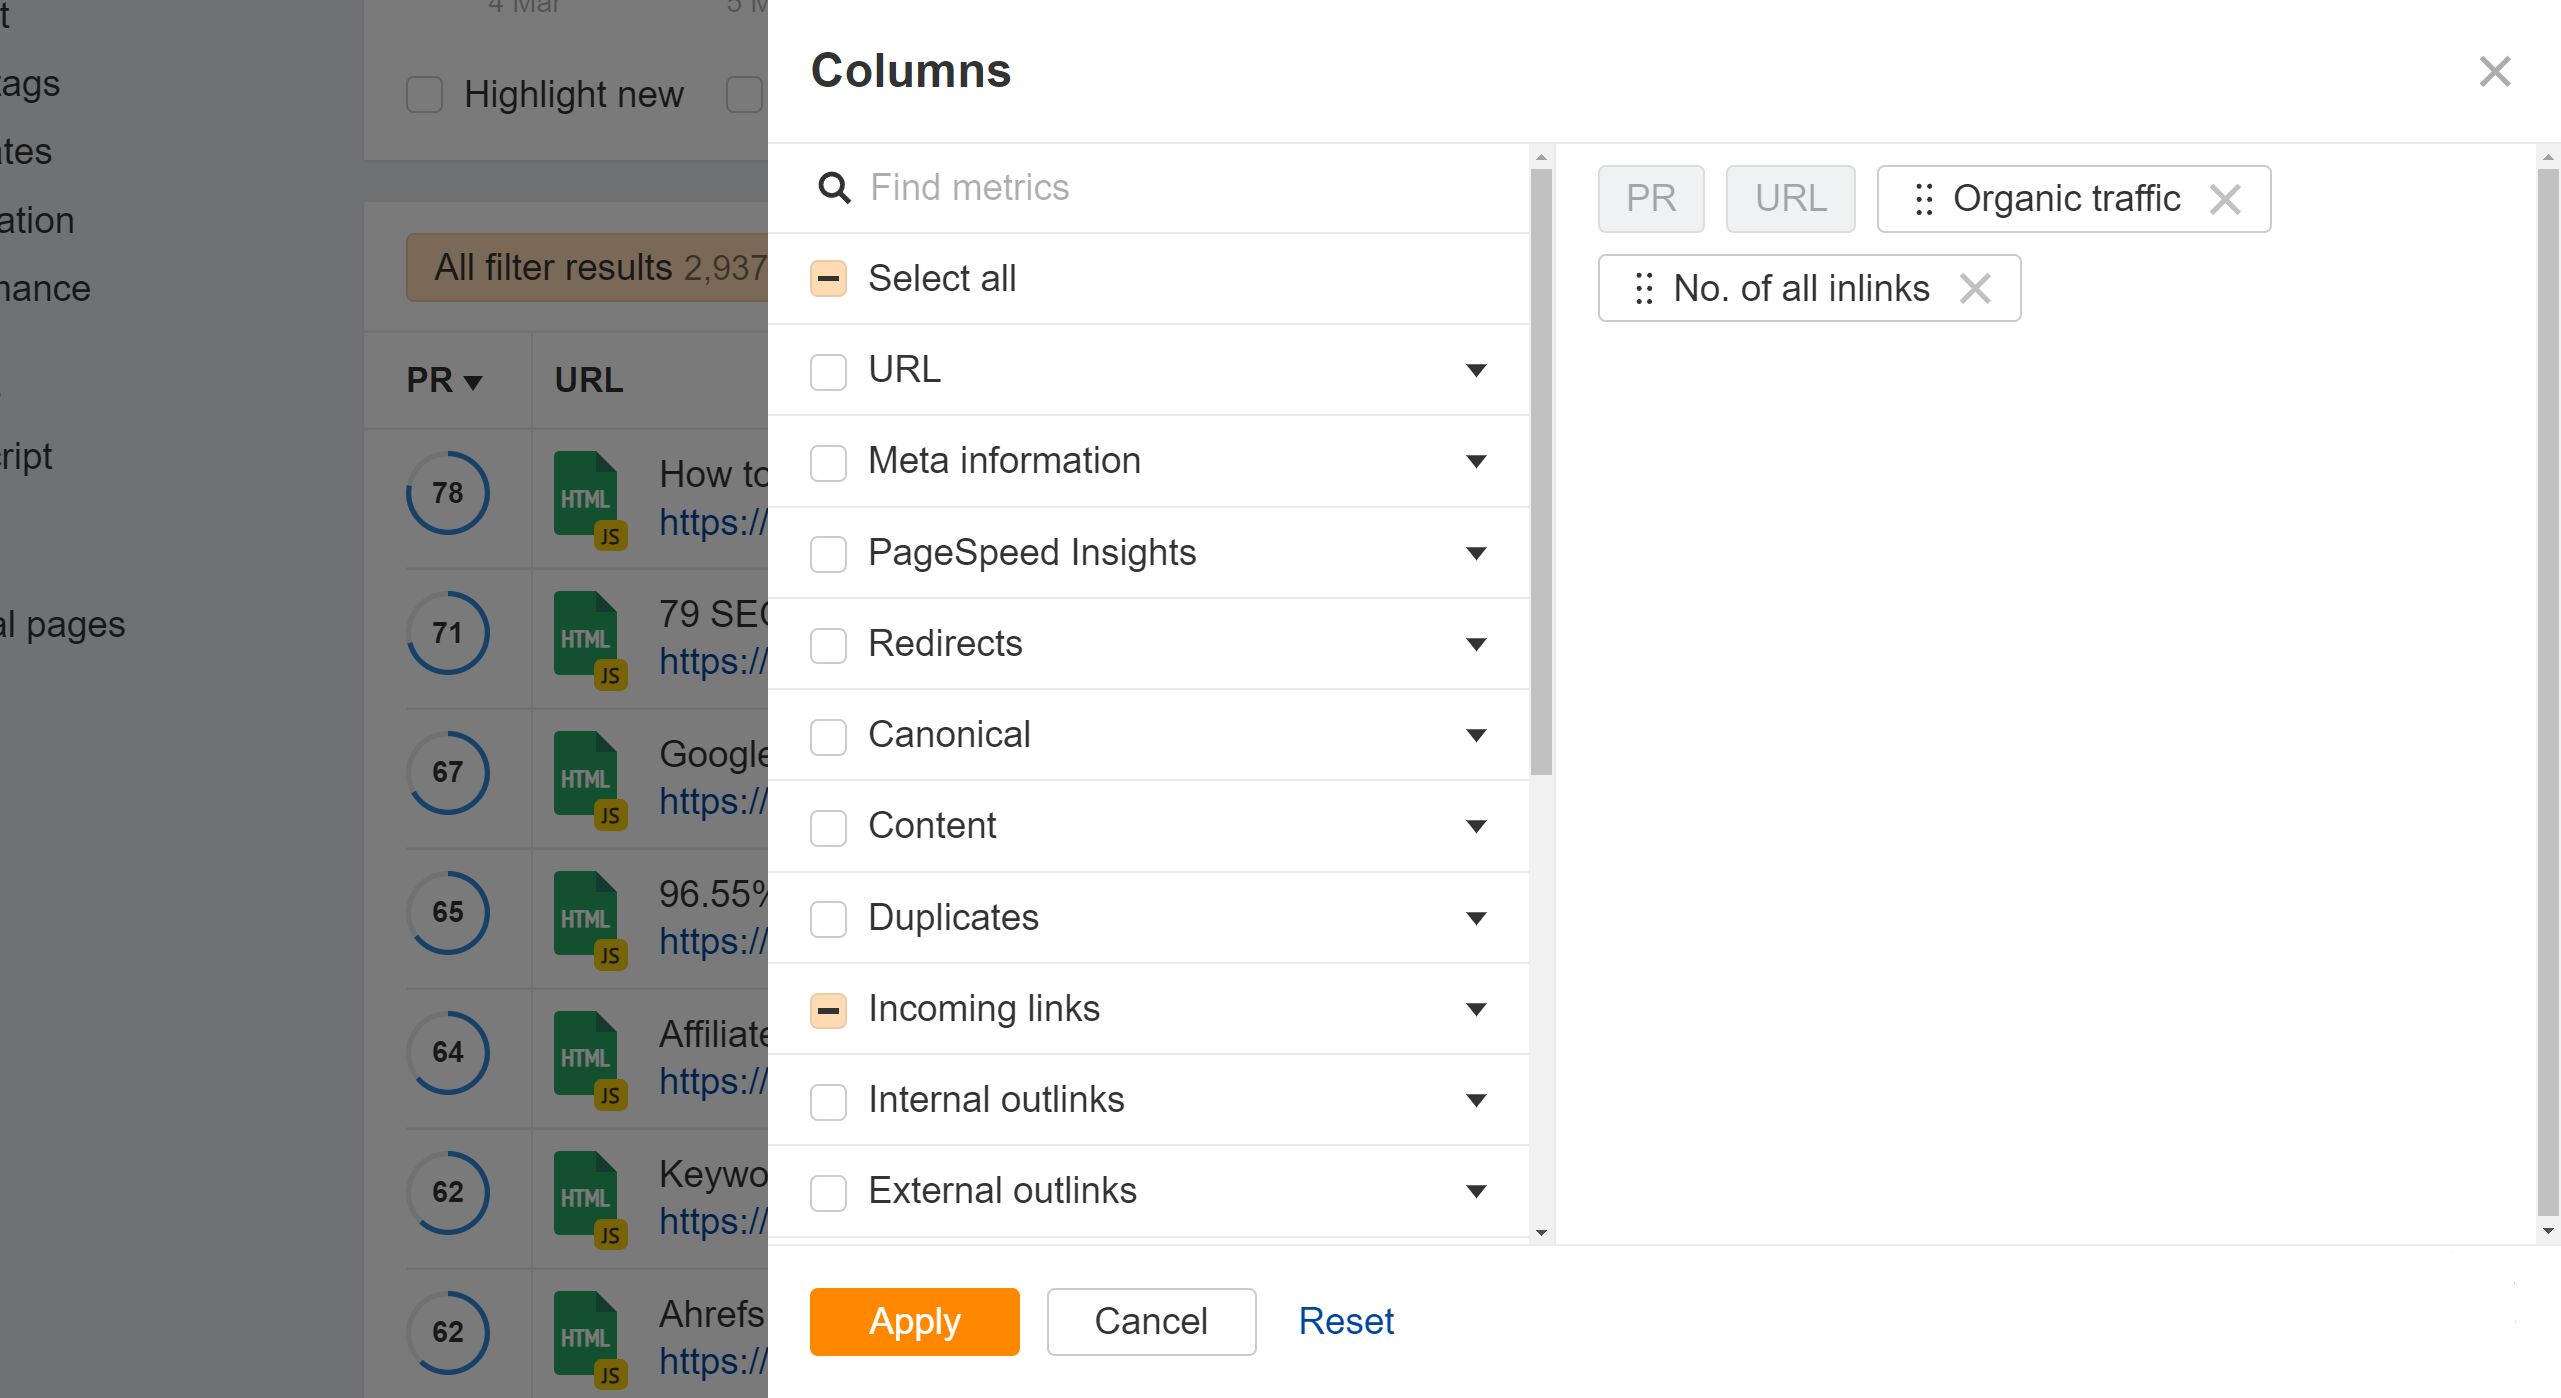
If you want to do this kind of comparison yourself, you can pull the data directly from Site Audit. The Page Explorer report has customizable columns. All you need are the “No. of all inlinks” and “Organic traffic” columns. These are stored per crawl, so I was able to compare the data from different crawls to make the visuals for this study.

After a few months, the topic came up to remove the related posts from the site. Some people just didn’t want it, and others didn’t think it had much impact. I didn’t object to it because I was curious to see what would happen.
When we removed it, we saw some traffic losses to a lot of pages. This time, the trend indicated it was related to the internal links that were removed.
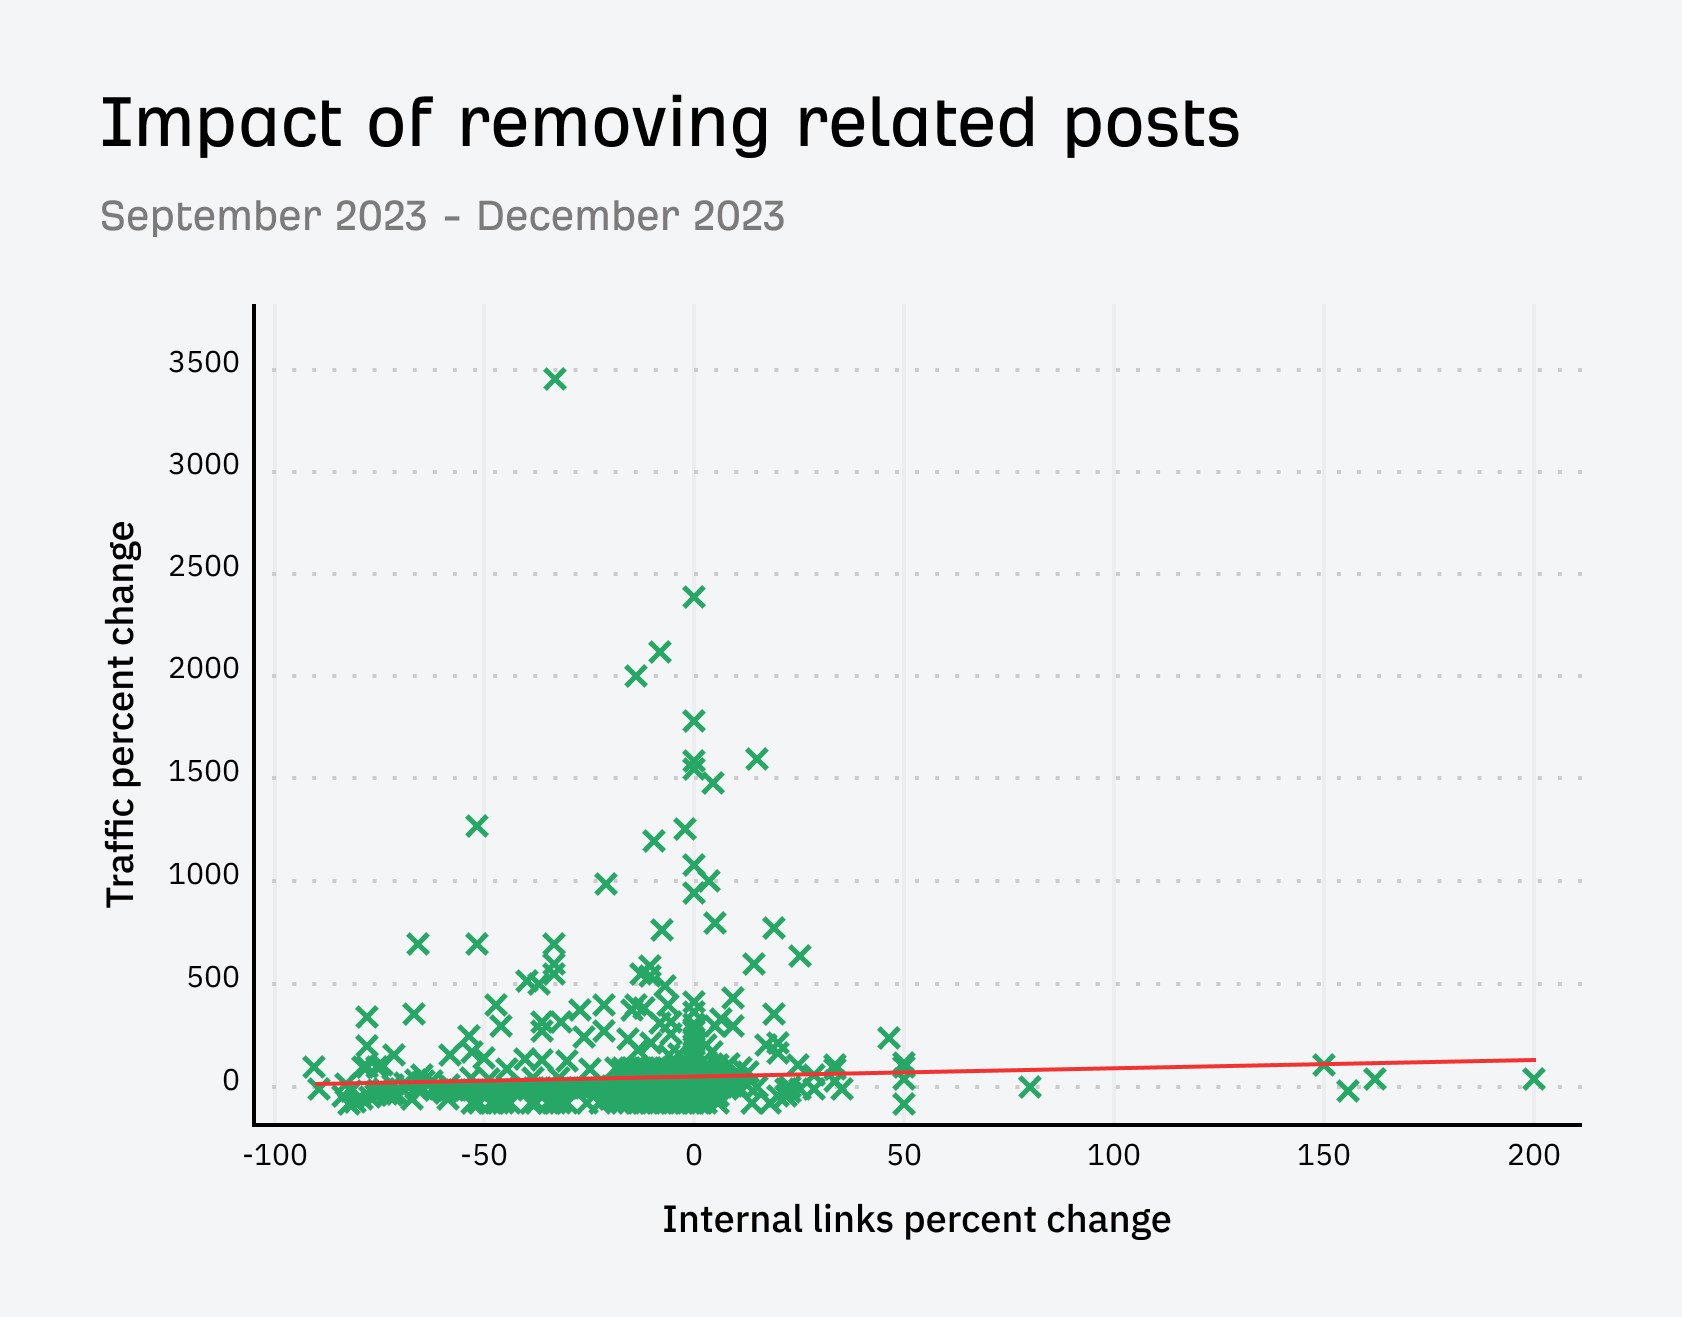

Even though we waited until after a Core Update to remove the related posts, Google rolled out another Helpful Content Update right after we removed them. Once again, the data for this test was a bit messy.
I waited a few months, and this time, I checked our analytics and noticed that when we had the related posts section, people spent more time on the site and viewed more pages. Users were actually clicking these related posts!
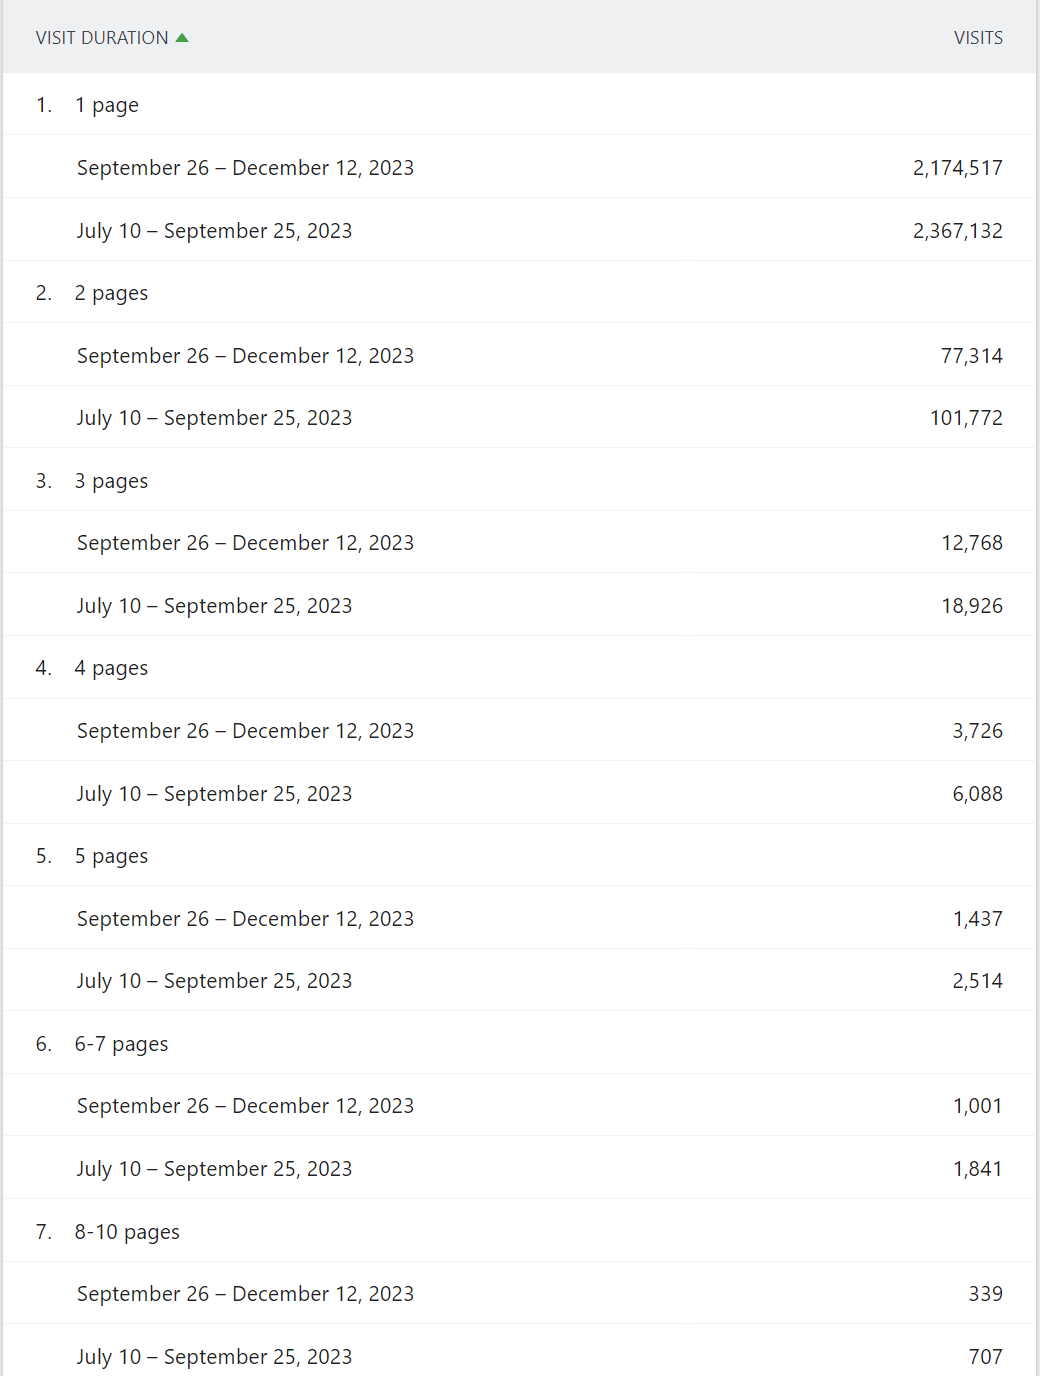

We decided to add it back, but only on English pages. We wanted to improve the match quality before adding it back to other languages.
This set up a nice split test because we could now see the difference between how the English pages were impacted vs pages in other languages.
Things looked good. We saw more traffic and it seemed to somewhat correlate to the pages that got more internal links.
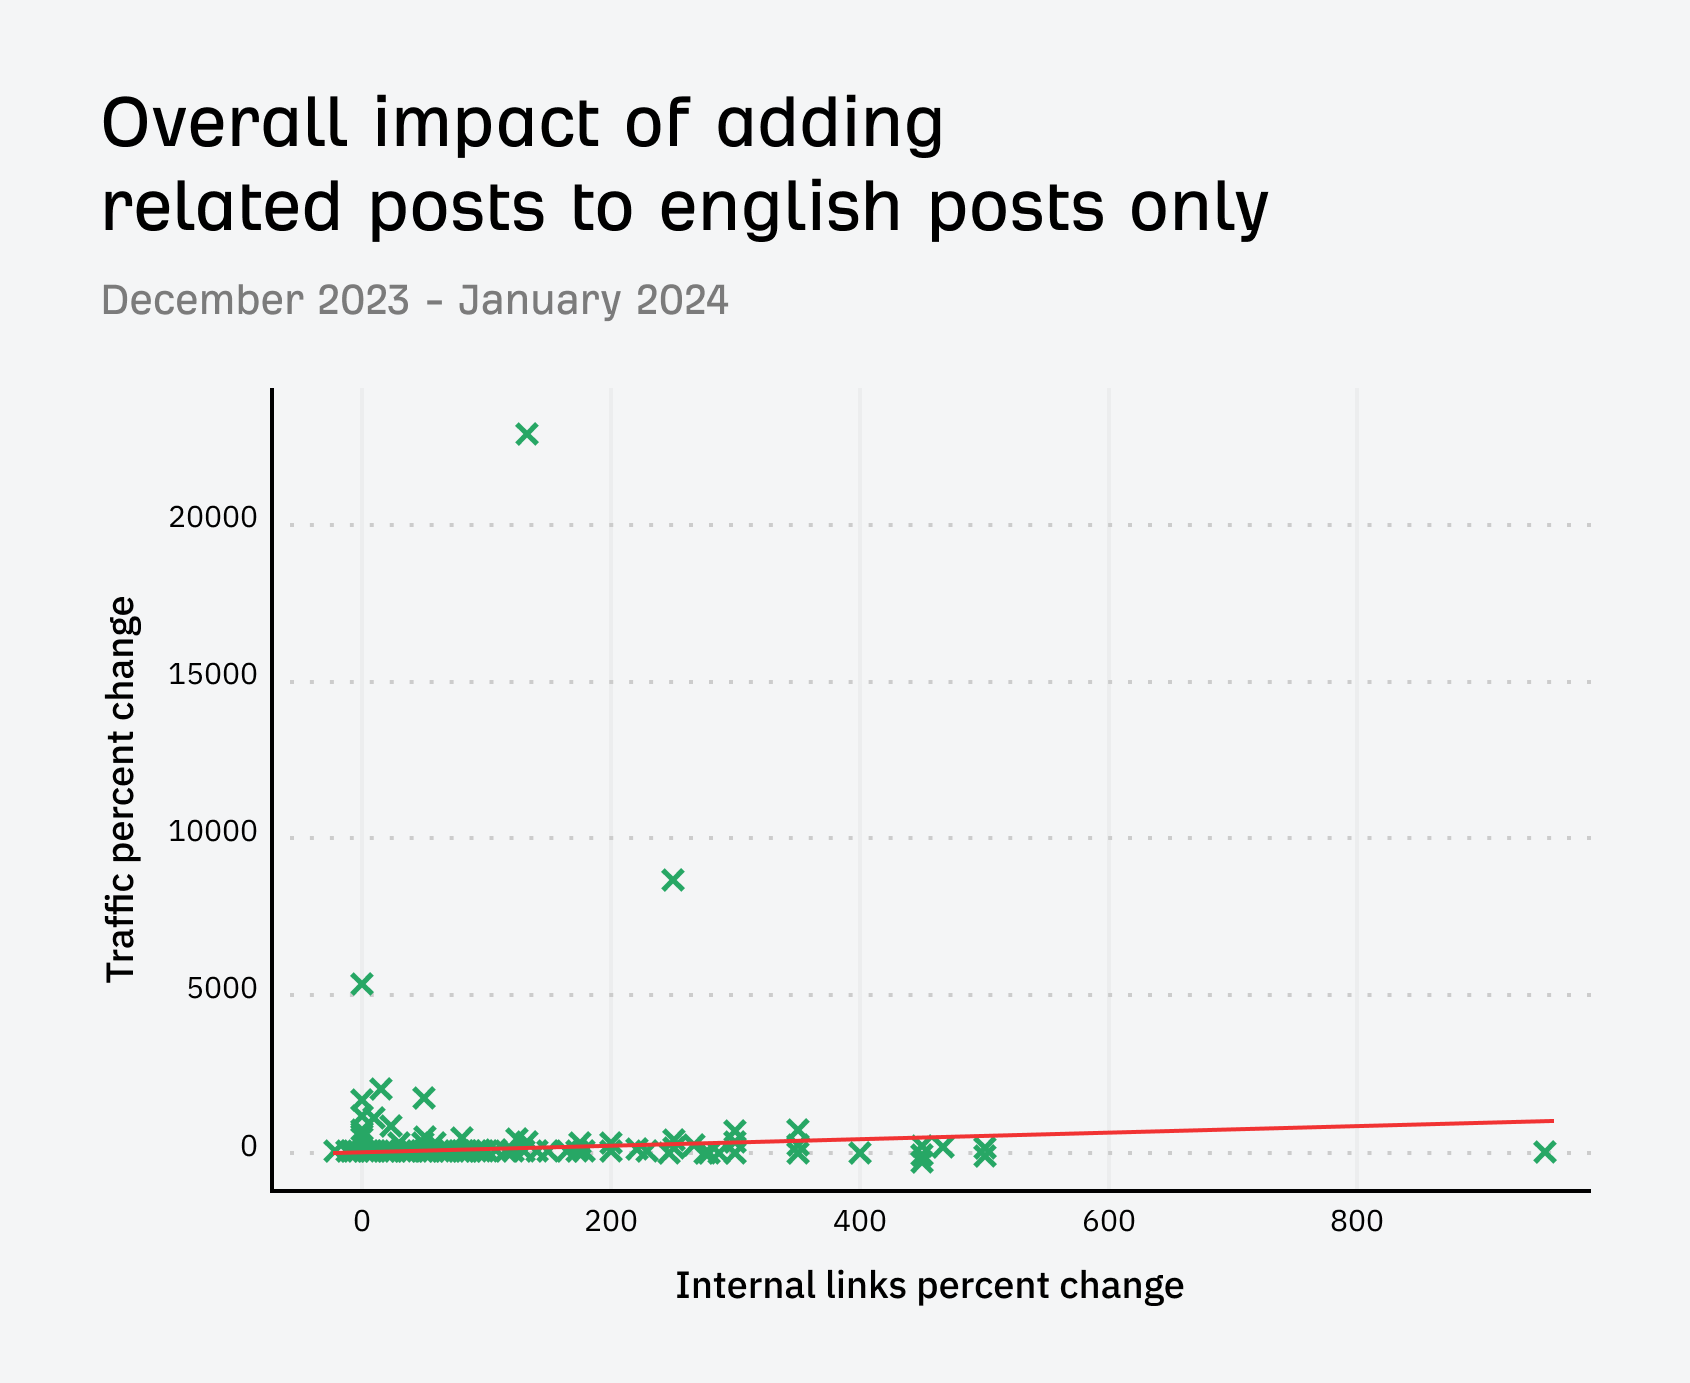

This time, we had no update, so we had a real test with a control group. The results for English blog posts were positive.
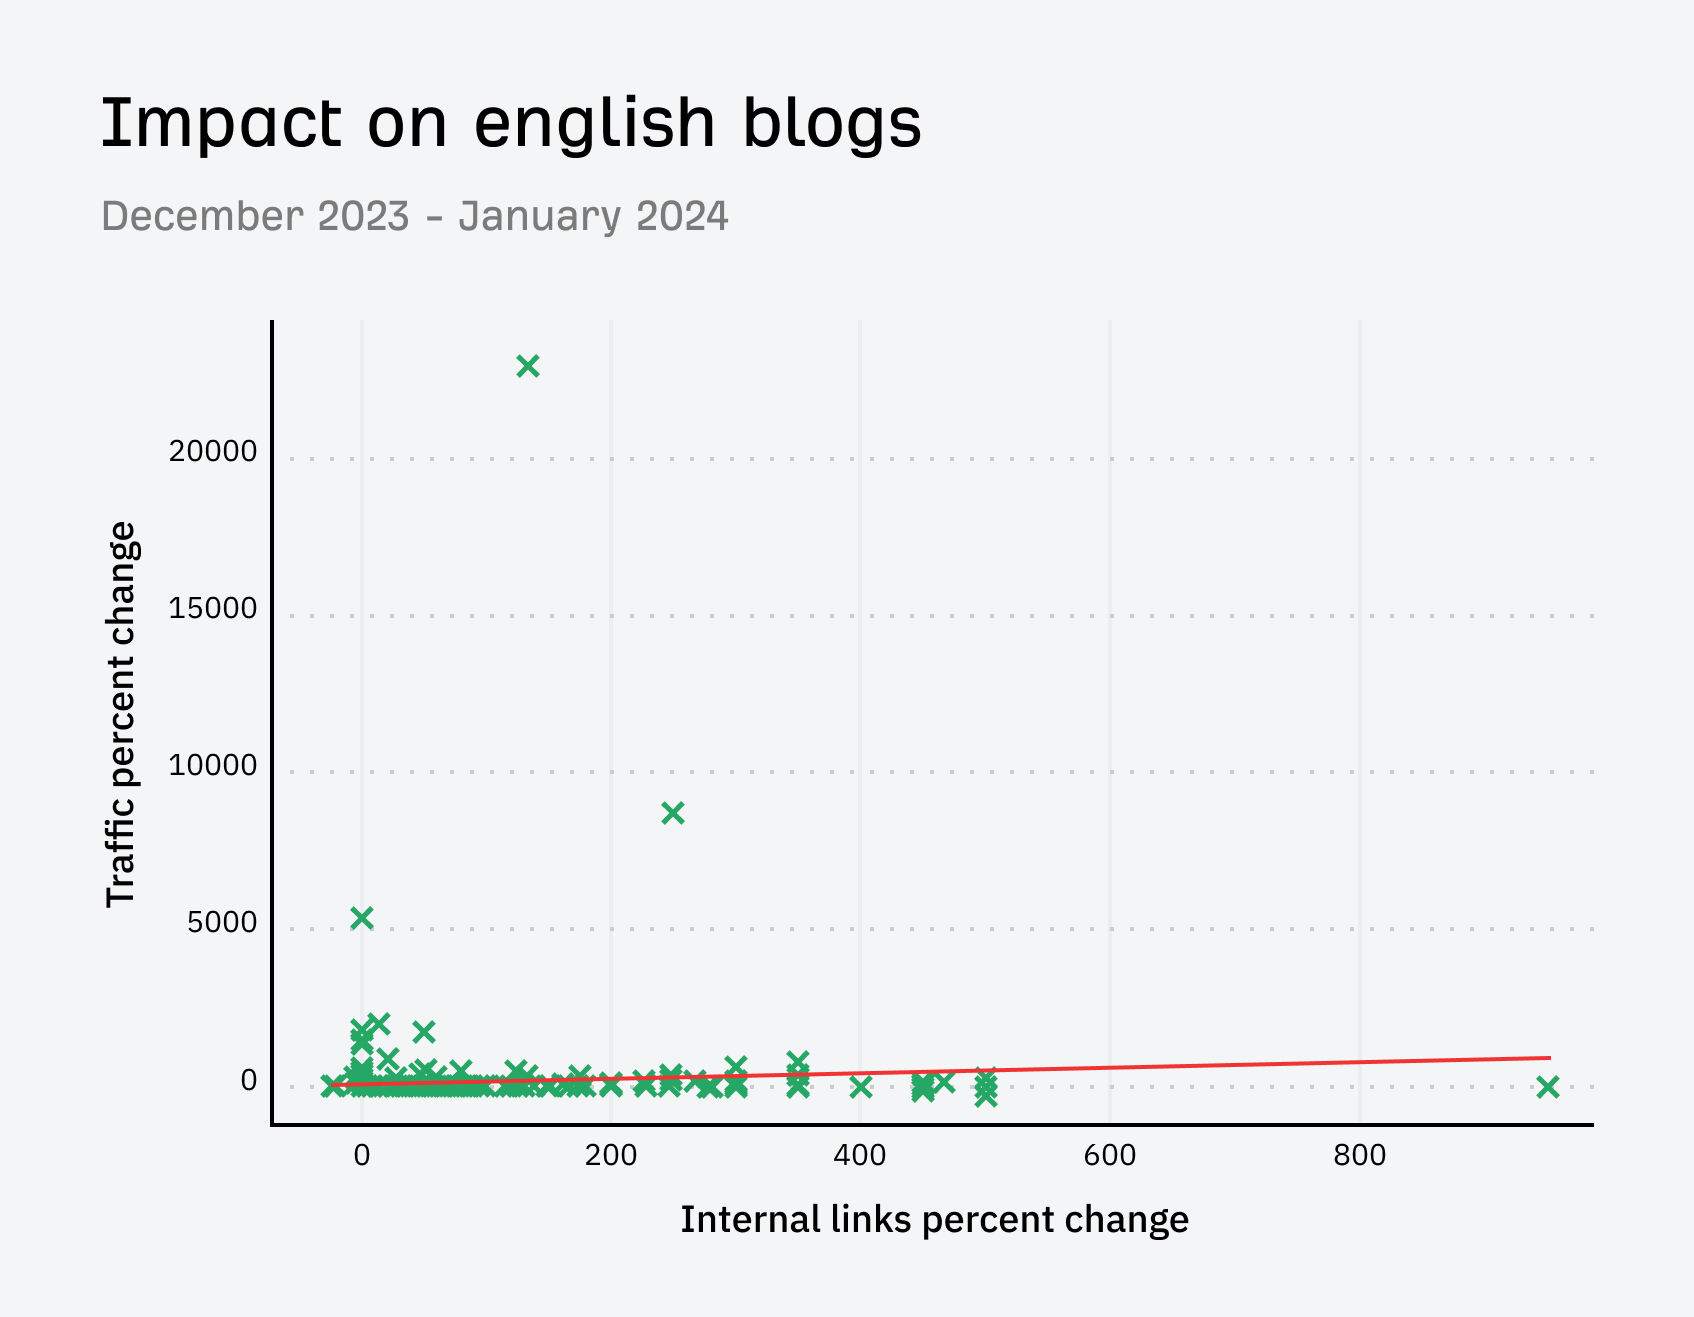

The results for the non-English blog posts were kind of mixed, but we had a lot of posts that lost traffic here.
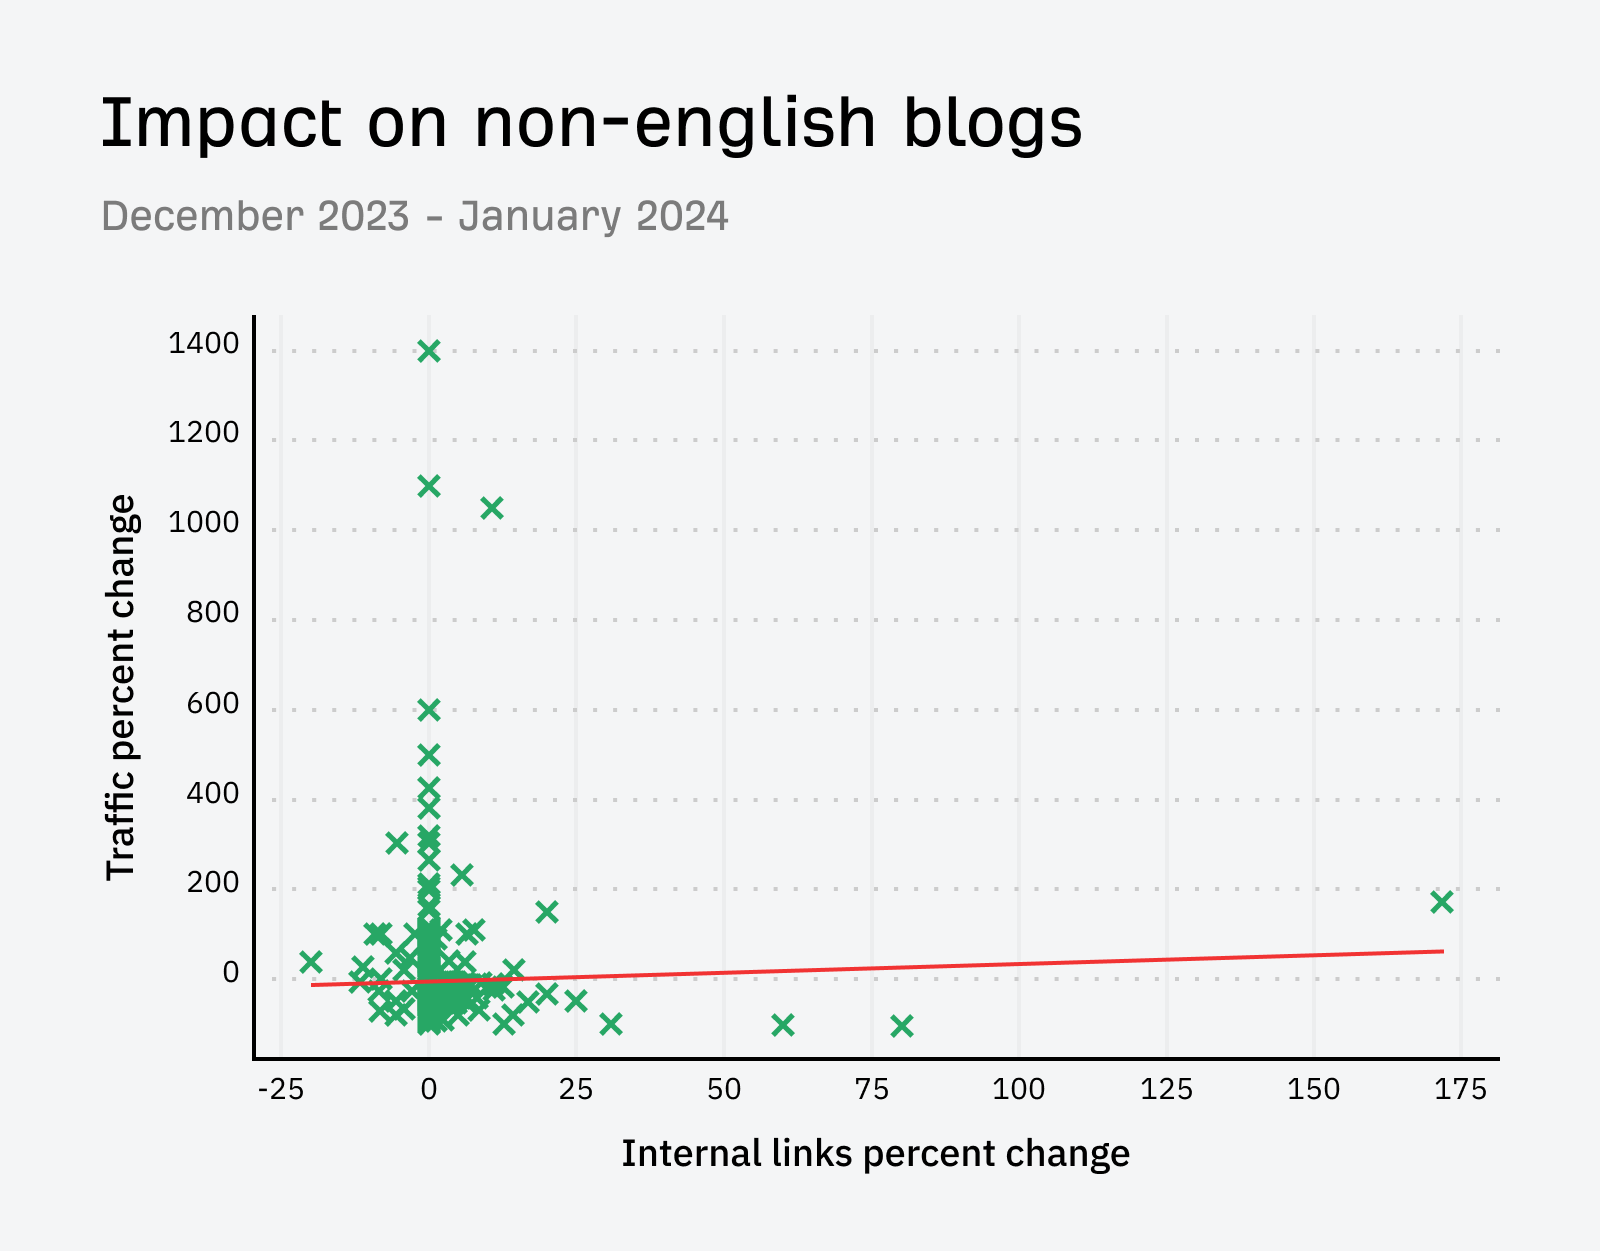

I decided to go back further, from when we removed the related posts section until now (about a month and a half after we added the section back to English blogs).
The English blogs showed a strong correlation this time. It definitely seemed that having the internal links helped with their traffic.
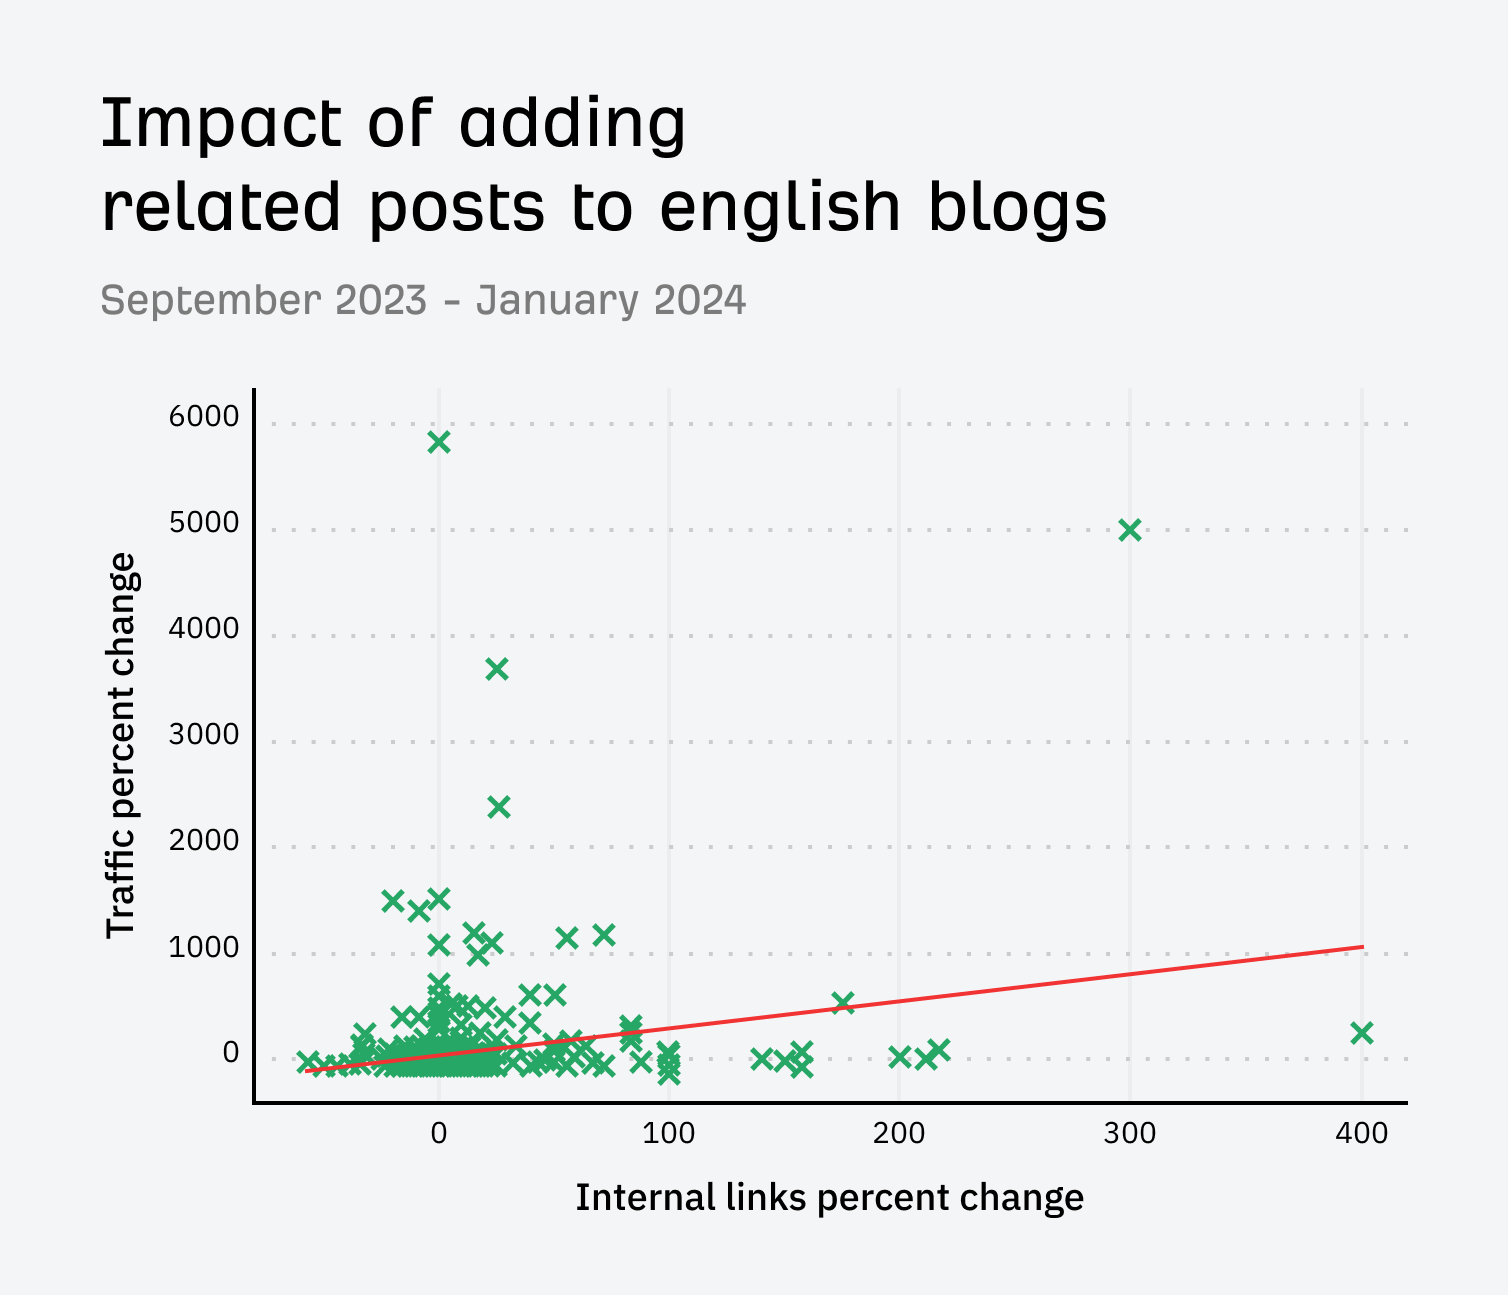

The non-English blogs were pretty mixed, but there were a lot of losers and not as strong of a correlation.
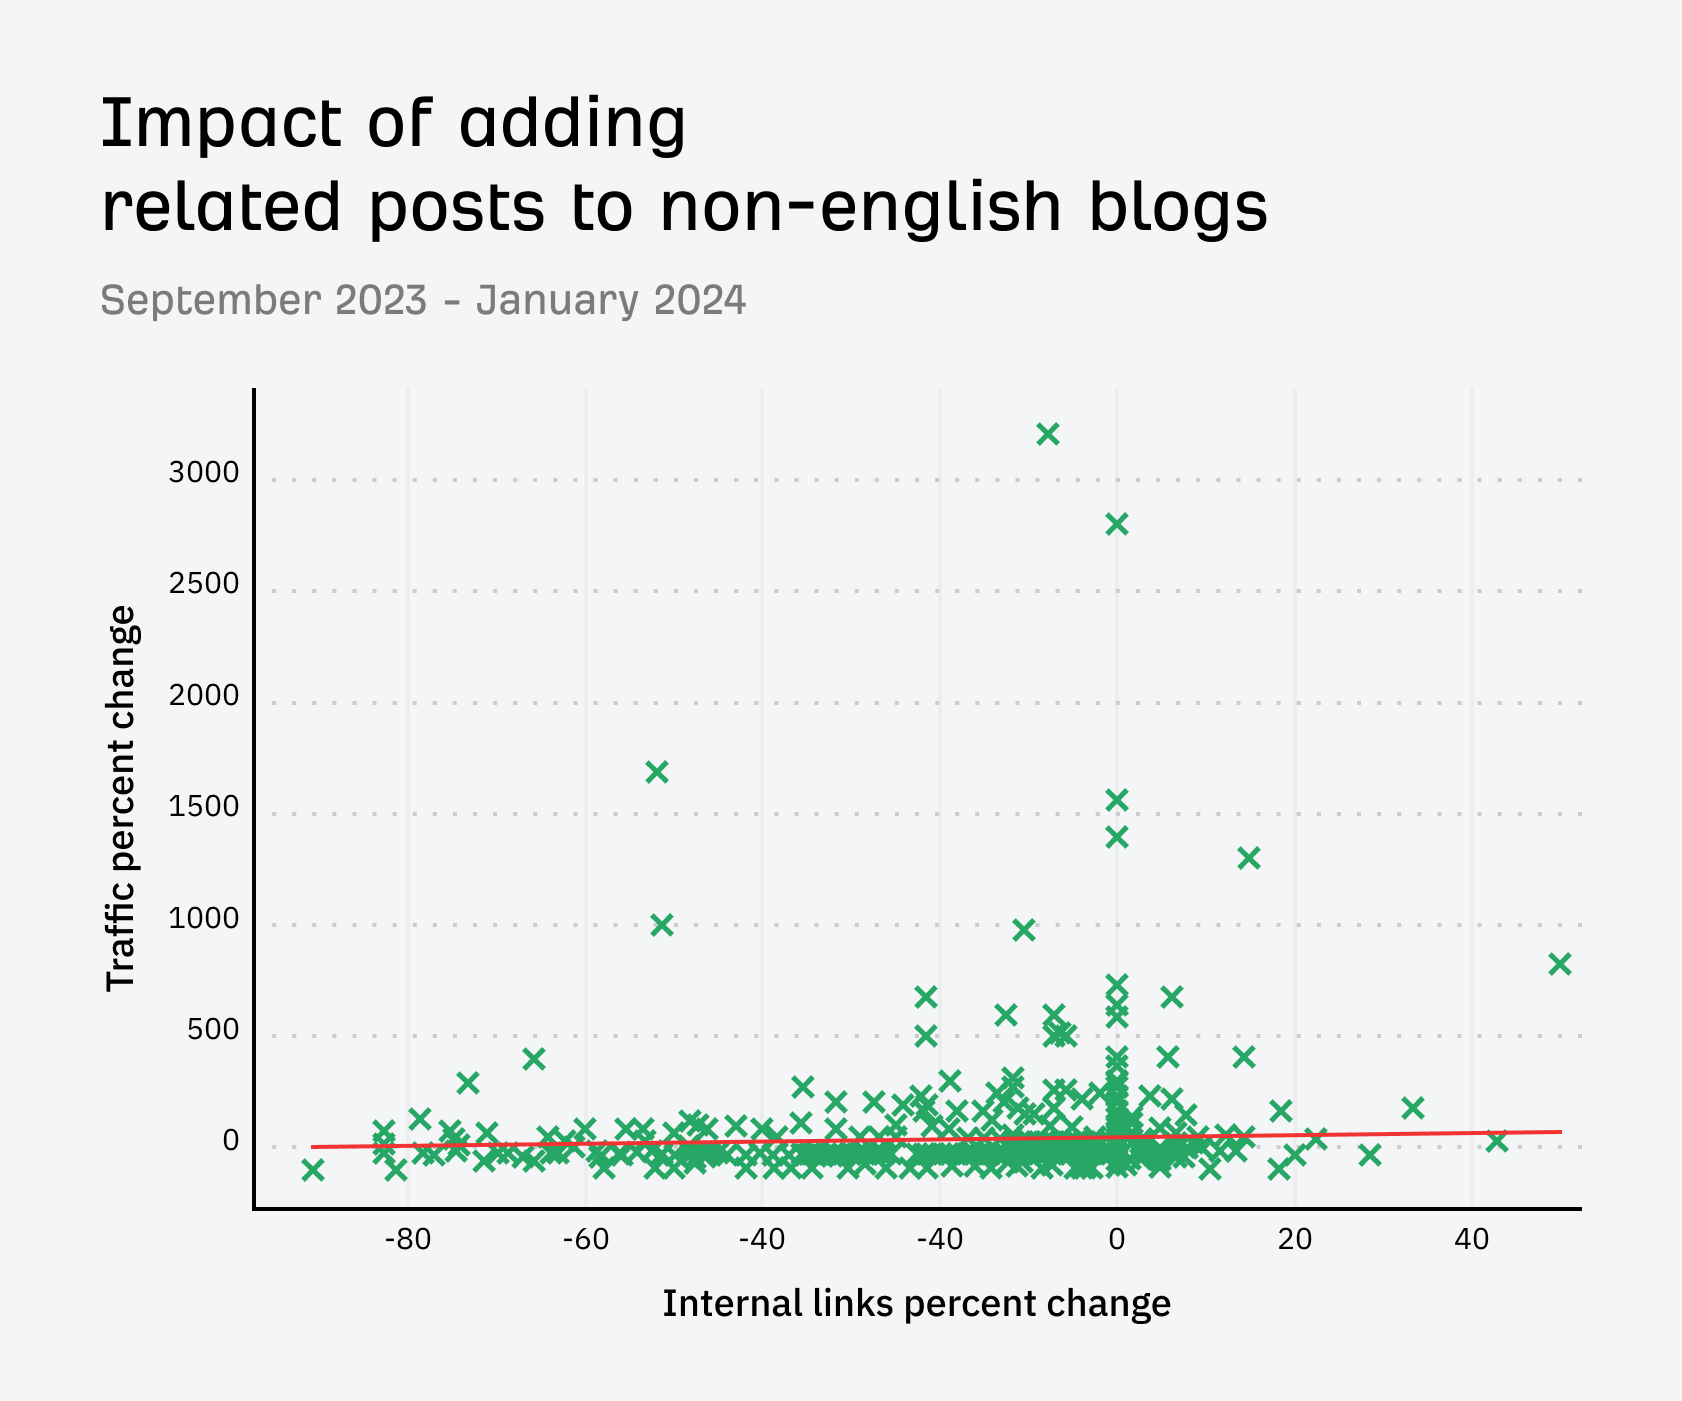

The results speak for themselves and are exactly what I expected to see. We saw some increase from having these extra internal links in the related posts section, but not a lot of impact since we already link well internally.
My best guess as to why we see some impact is that often, the related links are pieces of content that we wouldn’t naturally link to from within the blog content.
On blogs that aren’t as well optimized as ours for internal linking but have a lot of content, I would expect to see even more impact.
That’s it for now. We’ll probably add the related posts back to the non-English posts at some point this year. I’ll update the article with what happens when we do that, but I would expect a small bump for the content.
For more ideas on getting internal links, read Internal Links for SEO: An Actionable Guide.
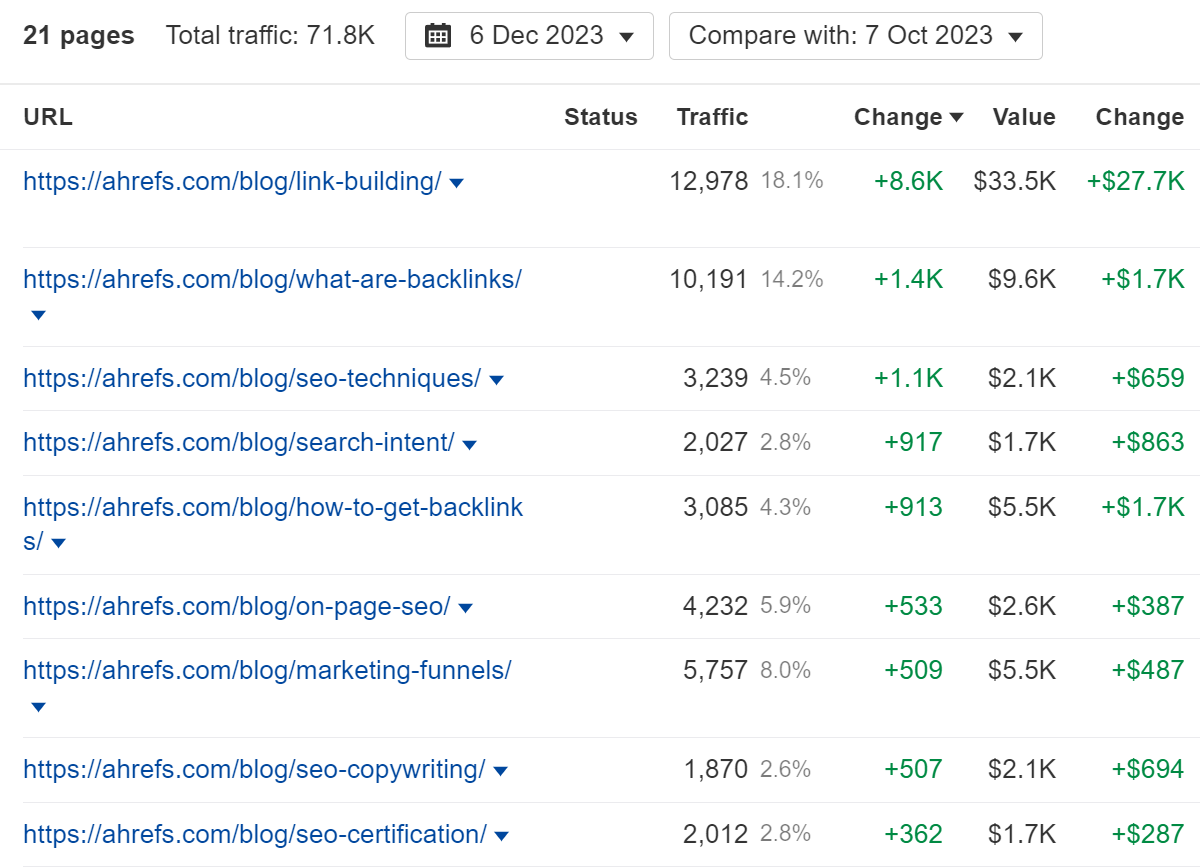
If you want to run a test to see if adding internal links helps your content, I highly recommend creating a Portfolio that includes the pages. You’ll be able to see the impact your changes had.
I created a portfolio for some articles we made edits on and was able to easily see that the changes were positive.

If you have questions, message me on X.
SEO
Google Rolls Out New ‘Web’ Filter For Search Results

Google is introducing a filter that allows you to view only text-based webpages in search results.
The “Web” filter, rolling out globally over the next two days, addresses demand from searchers who prefer a stripped-down, simplified view of search results.
Danny Sullivan, Google’s Search Liaison, states in an announcement:
“We’ve added this after hearing from some that there are times when they’d prefer to just see links to web pages in their search results, such as if they’re looking for longer-form text documents, using a device with limited internet access, or those who just prefer text-based results shown separately from search features.”
We’ve added this after hearing from some that there are times when they’d prefer to just see links to web pages in their search results, such as if they’re looking for longer-form text documents, using a device with limited internet access, or those who just prefer text-based…
— Google SearchLiaison (@searchliaison) May 14, 2024
The new functionality is a throwback to when search results were more straightforward. Now, they often combine rich media like images, videos, and shopping ads alongside the traditional list of web links.
How It Works
On mobile devices, the “Web” filter will be displayed alongside other filter options like “Images” and “News.”
If Google’s systems don’t automatically surface it based on the search query, desktop users may need to select “More” to access it.
 Screenshot from: twitter.com/GoogleSearchLiaison, May 2024.
More About Google Search Filters
Google’s search filters allow you to narrow results by type. The options displayed are dynamically generated based on your search query and what Google’s systems determine could be most relevant.
The “All Filters” option provides access to filters that are not shown automatically.
Alongside filters, Google also displays “Topics” – suggested related terms that can further refine or expand a user’s original query into new areas of exploration.
For more about Google’s search filters, see its official help page.
Featured Image: egaranugrah/Shutterstock
SEO
Why Google Can’t Tell You About Every Ranking Drop

In a recent Twitter exchange, Google’s Search Liaison, Danny Sullivan, provided insight into how the search engine handles algorithmic spam actions and ranking drops.
The discussion was sparked by a website owner’s complaint about a significant traffic loss and the inability to request a manual review.
Sullivan clarified that a site could be affected by an algorithmic spam action or simply not ranking well due to other factors.
He emphasized that many sites experiencing ranking drops mistakenly attribute it to an algorithmic spam action when that may not be the case.
“I’ve looked at many sites where people have complained about losing rankings and decide they have a algorithmic spam action against them, but they don’t. “
Sullivan’s full statement will help you understand Google’s transparency challenges.
Additionally, he explains why the desire for manual review to override automated rankings may be misguided.
Two different things. A site could have an algorithmic spam action. A site could be not ranking well because other systems that *are not about spam* just don’t see it as helpful.
I’ve looked at many sites where people have complained about losing rankings and decide they have a…
— Google SearchLiaison (@searchliaison) May 13, 2024
Challenges In Transparency & Manual Intervention
Sullivan acknowledged the idea of providing more transparency in Search Console, potentially notifying site owners of algorithmic actions similar to manual actions.
However, he highlighted two key challenges:
- Revealing algorithmic spam indicators could allow bad actors to game the system.
- Algorithmic actions are not site-specific and cannot be manually lifted.
Sullivan expressed sympathy for the frustration of not knowing the cause of a traffic drop and the inability to communicate with someone about it.
However, he cautioned against the desire for a manual intervention to override the automated systems’ rankings.
Sullivan states:
“…you don’t really want to think “Oh, I just wish I had a manual action, that would be so much easier.” You really don’t want your individual site coming the attention of our spam analysts. First, it’s not like manual actions are somehow instantly processed. Second, it’s just something we know about a site going forward, especially if it says it has change but hasn’t really.”
Determining Content Helpfulness & Reliability
Moving beyond spam, Sullivan discussed various systems that assess the helpfulness, usefulness, and reliability of individual content and sites.
He acknowledged that these systems are imperfect and some high-quality sites may not be recognized as well as they should be.
“Some of them ranking really well. But they’ve moved down a bit in small positions enough that the traffic drop is notable. They assume they have fundamental issues but don’t, really — which is why we added a whole section about this to our debugging traffic drops page.”
Sullivan revealed ongoing discussions about providing more indicators in Search Console to help creators understand their content’s performance.
“Another thing I’ve been discussing, and I’m not alone in this, is could we do more in Search Console to show some of these indicators. This is all challenging similar to all the stuff I said about spam, about how not wanting to let the systems get gamed, and also how there’s then no button we would push that’s like “actually more useful than our automated systems think — rank it better!” But maybe there’s a way we can find to share more, in a way that helps everyone and coupled with better guidance, would help creators.”
Advocacy For Small Publishers & Positive Progress
In response to a suggestion from Brandon Saltalamacchia, founder of RetroDodo, about manually reviewing “good” sites and providing guidance, Sullivan shared his thoughts on potential solutions.
He mentioned exploring ideas such as self-declaration through structured data for small publishers and learning from that information to make positive changes.
“I have some thoughts I’ve been exploring and proposing on what we might do with small publishers and self-declaring with structured data and how we might learn from that and use that in various ways. Which is getting way ahead of myself and the usual no promises but yes, I think and hope for ways to move ahead more positively.”
Sullivan said he can’t make promises or implement changes overnight, but he expressed hope for finding ways to move forward positively.
Featured Image: Tero Vesalainen/Shutterstock
SEO
56 Google Search Statistics to Bookmark for 2024
If you’re curious about the state of Google search in 2024, look no further.
Each year we pick, vet, and categorize a list of up-to-date statistics to give you insights from trusted sources on Google search trends.
- Google has a web index of “about 400 billion documents”. (The Capitol Forum)
- Google’s search index is over 100 million gigabytes in size. (Google)
- There are an estimated 3.5 billion searches on Google each day. (Internet Live Stats)
- 61.5% of desktop searches and 34.4% of mobile searches result in no clicks. (SparkToro)
- 15% of all Google searches have never been searched before. (Google)
- 94.74% of keywords get 10 monthly searches or fewer. (Ahrefs)
- The most searched keyword in the US and globally is “YouTube,” and youtube.com gets the most traffic from Google. (Ahrefs)
- 96.55% of all pages get zero search traffic from Google. (Ahrefs)
- 50-65% of all number-one spots are dominated by featured snippets. (Authority Hacker)
- Reddit is the most popular domain for product review queries. (Detailed)
- Google is the most used search engine in the world, with a mobile market share of 95.32% and a desktop market share of 81.95%. (Statista)

- Google.com generated 84.2 billion visits a month in 2023. (Statista)
- Google generated $307.4 billion in revenue in 2023. (Alphabet Investor Relations)
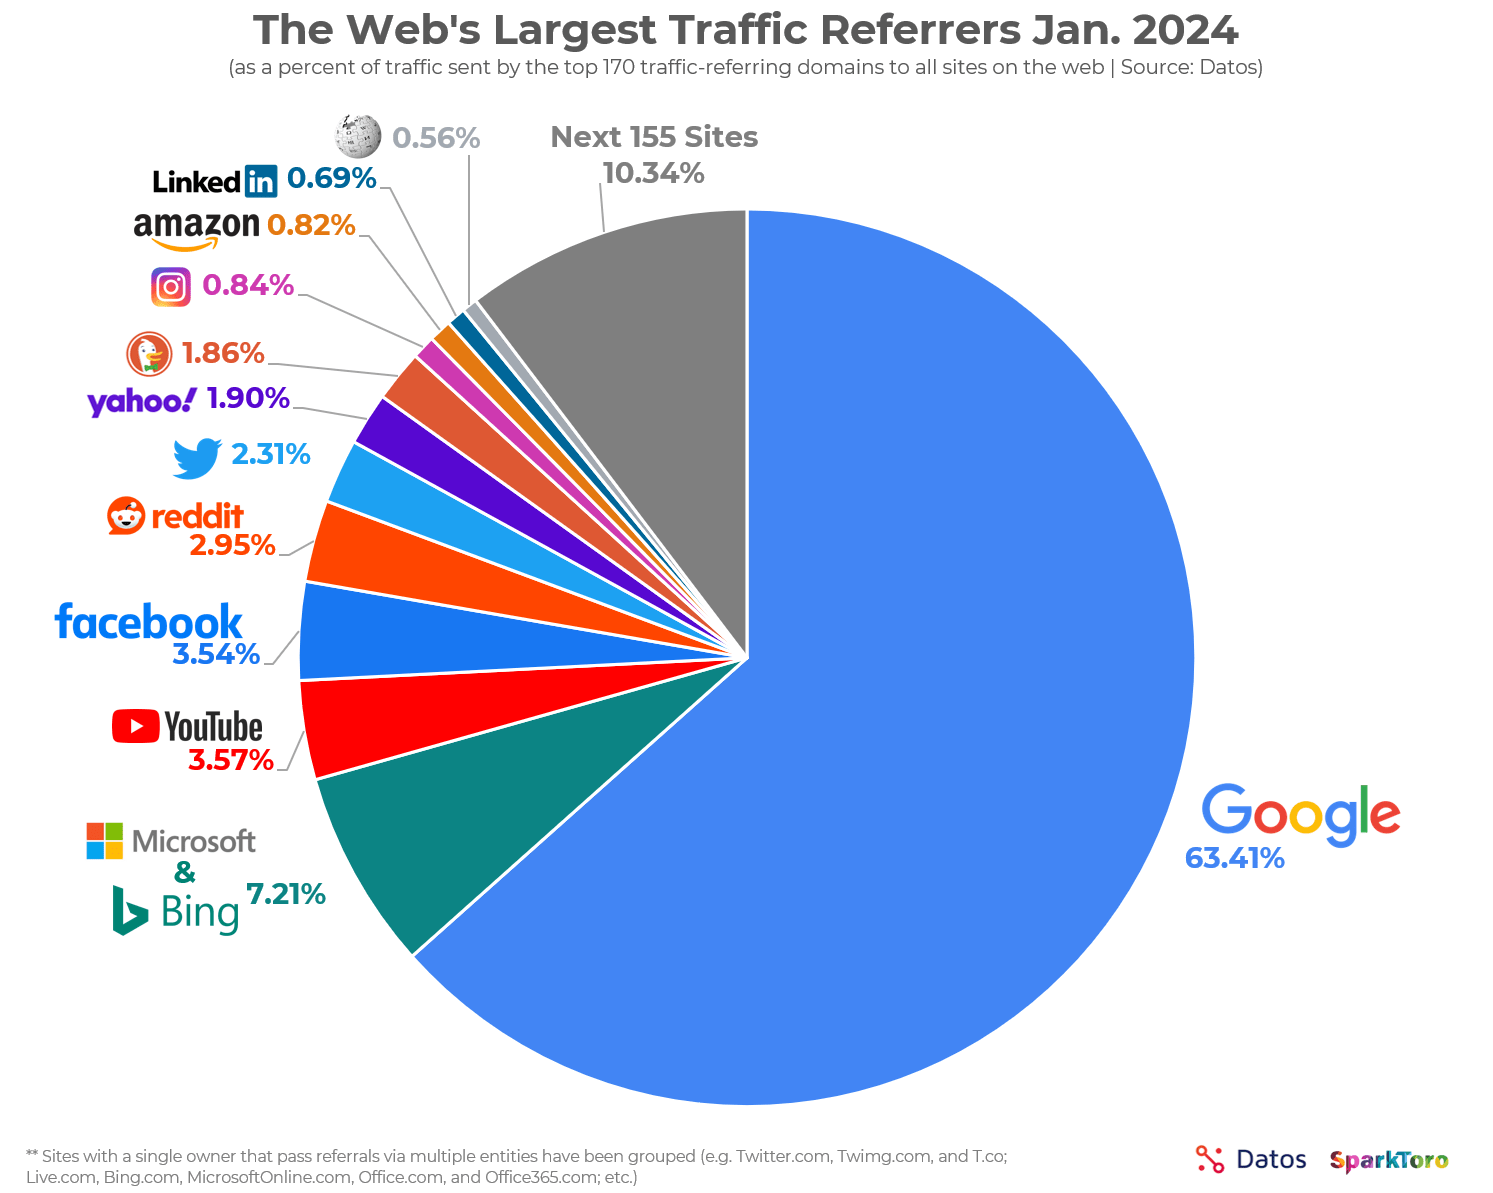
- 63.41% of all US web traffic referrals come from Google. (SparkToro)
- 92.96% of global traffic comes from Google Search, Google Images, and Google Maps. (SparkToro)
- Only 49% of Gen Z women use Google as their search engine. The rest use TikTok. (Search Engine Land)
- 58.67% of all website traffic worldwide comes from mobile phones. (Statista)
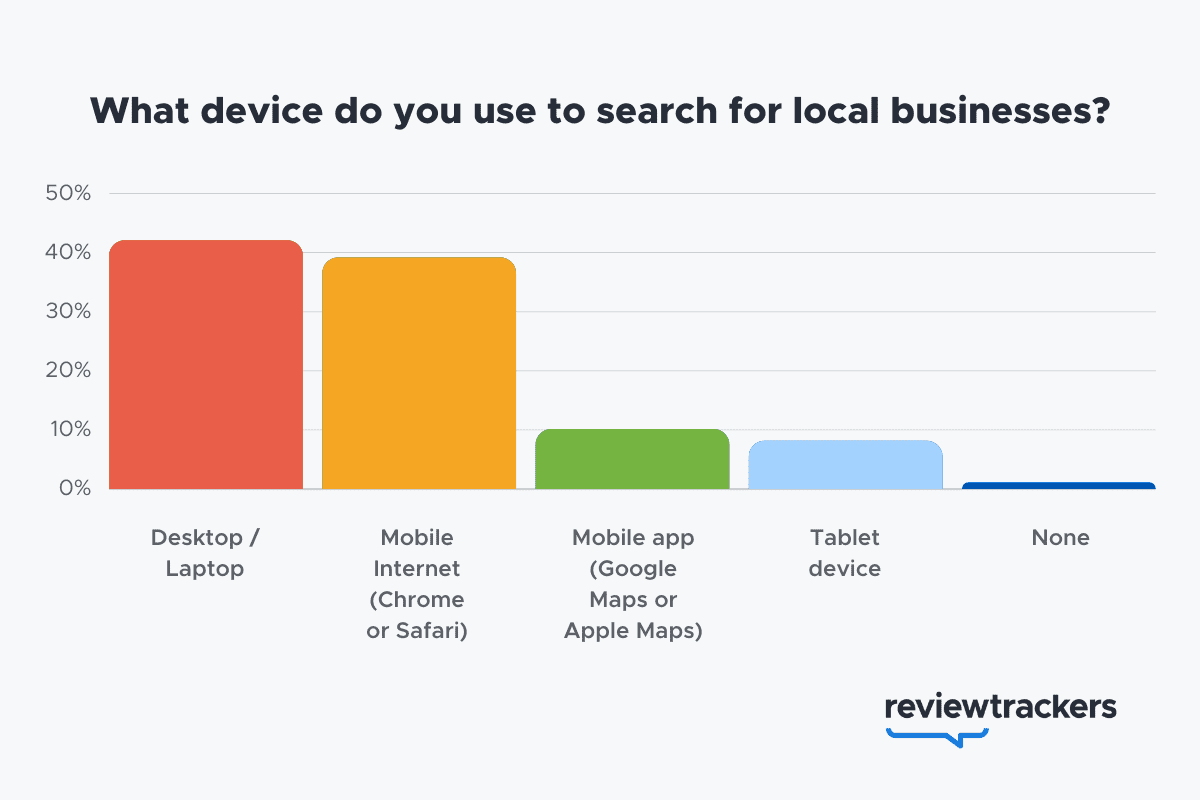
- 57% of local search queries are submitted using a mobile device or tablet. (ReviewTrackers)

- 51% of smartphone users have discovered a new company or product when conducting a search on their smartphones. (Think With Google)
- 54% of smartphone users search for business hours, and 53% search for directions to local stores. (Think With Google)
- 18% of local searches on smartphones lead to a purchase within a day vs. 7% of non-local searches. (Think With Google)
- 56% of in-store shoppers used their smartphones to shop or research items while they were in-store. (Think With Google)
- 60% of smartphone users have contacted a business directly using the search results (e.g., “click to call” option). (Think With Google)
- 63.6% of consumers say they are likely to check reviews on Google before visiting a business location. (ReviewTrackers)
- 88% of consumers would use a business that replies to all of its reviews. (BrightLocal)
- Customers are 2.7 times more likely to consider a business reputable if they find a complete Business Profile on Google Search and Maps. (Google)
- Customers are 70% more likely to visit and 50% more likely to consider purchasing from businesses with a complete Business Profile. (Google)
- 76% of people who search on their smartphones for something nearby visit a business within a day. (Think With Google)
- 28% of searches for something nearby result in a purchase. (Think With Google)
- Mobile searches for “store open near me” (such as, “grocery store open near me” have grown by over 250% in the last two years. (Think With Google)
- People use Google Lens for 12 billion visual searches a month. (Google)
- 50% of online shoppers say images helped them decide what to buy. (Think With Google)
- There are an estimated 136 billion indexed images on Google Image Search. (Photutorial)
- 15.8% of Google SERPs show images. (Moz)
- People click on 3D images almost 50% more than static ones. (Google)
- More than 800 million people use Google Discover monthly to stay updated on their interests. (Google)
- 46% of Google Discover URLs are news sites, 44% e-commerce, 7% entertainment, and 2% travel. (Search Engine Journal)
- Even though news sites accounted for under 50% of Google Discover URLs, they received 99% of Discover clicks. (Search Engine Journal)
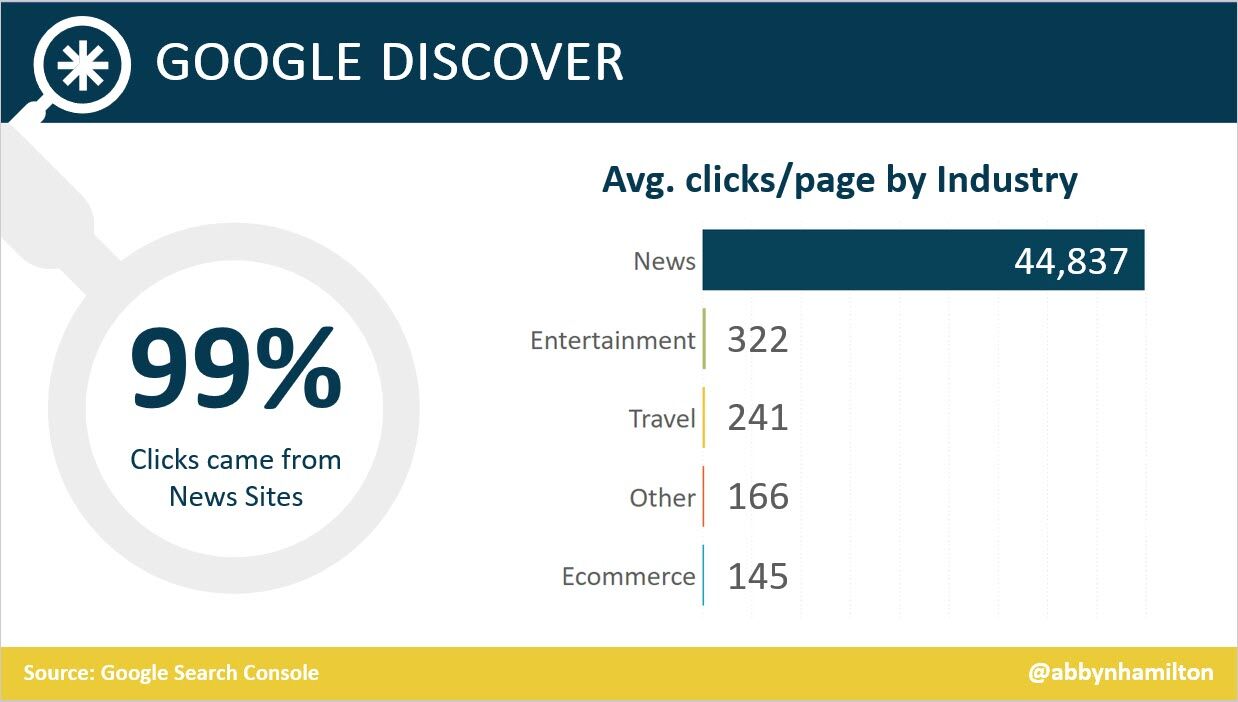

- Most Google Discover URLs only receive traffic for three to four days, with most of that traffic occurring one to two days after publishing. (Search Engine Journal)
- The clickthrough rate (CTR) for Google Discover is 11%. (Search Engine Journal)
- 91.45% of search volumes in Google Ads Keyword Planner are overestimates. (Ahrefs)
- For every $1 a business spends on Google Ads, they receive $8 in profit through Google Search and Ads. (Google)
- Google removed 5.5 billion ads, suspended 12.7 million advertiser accounts, restricted over 6.9 billion ads, and restricted ads from showing up on 2.1 billion publisher pages in 2023. (Google)
- The average shopping click-through rate (CTR) across all industries is 0.86% for Google Ads. (Wordstream)
- The average shopping cost per click (CPC) across all industries is $0.66 for Google Ads. (Wordstream)
- The average shopping conversion rate (CVR) across all industries is 1.91% for Google Ads. (Wordstream)
- 58% of consumers ages 25-34 use voice search daily. (UpCity)
- 16% of people use voice search for local “near me” searches. (UpCity)
- 67% of consumers say they’re very likely to use voice search when seeking information. (UpCity)
- Active users of the Google Assistant grew 4X over the past year, as of 2019. (Think With Google)
- Google Assistant hit 1 billion app installs. (Android Police)
- AI-generated answers from SGE were available for 91% of entertainment queries but only 17% of healthcare queries. (Statista)
- The AI-generated answers in Google’s Search Generative Experience (SGE) do not match any links from the top 10 Google organic search results 93.8% of the time. (Search Engine Journal)
- Google displays a Search Generative element for 86.8% of all search queries. (Authoritas)
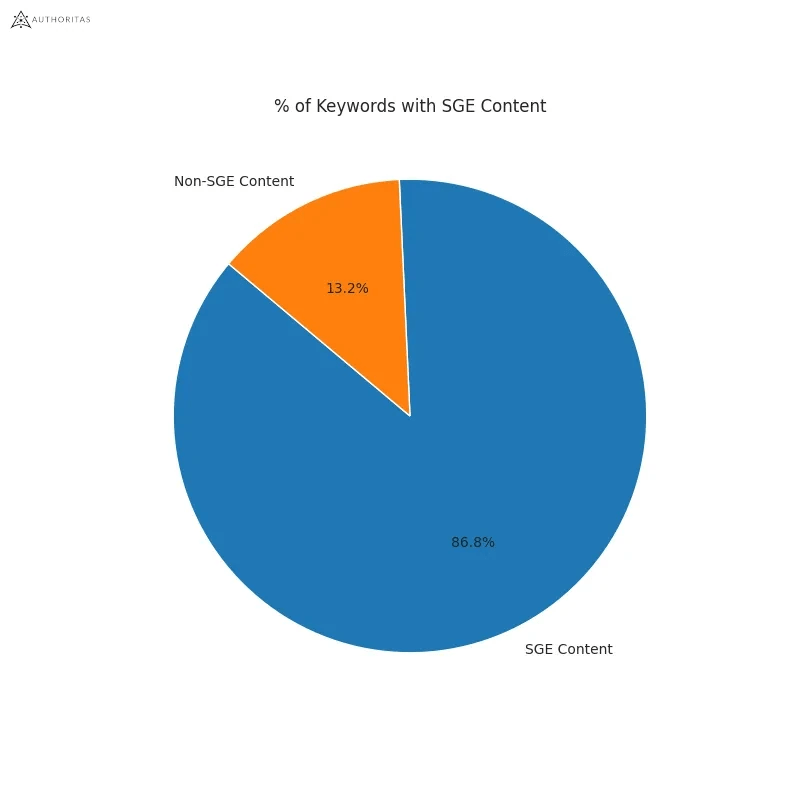

- 62% of generative links came from sources outside the top 10 ranking organic domains. Only 20.1% of generative URLs directly match an organic URL ranking on page one. (Authoritas)
- 70% of SEOs said that they were worried about the impact of SGE on organic search (Aira)
Learn more
Check out more resources on how Google works:
-

 PPC7 days ago
How the TikTok Algorithm Works in 2024 (+9 Ways to Go Viral)
-

 SEO6 days ago
How to Use Keywords for SEO: The Complete Beginner’s Guide
-

 MARKETING7 days ago
How To Protect Your People and Brand
-

 MARKETING4 days ago
Advertising on Hulu: Ad Formats, Examples & Tips
-

 MARKETING5 days ago
Updates to data build service for better developer experiences
-

 MARKETING1 day ago
18 Events and Conferences for Black Entrepreneurs in 2024
-

 WORDPRESS4 days ago
Best WordPress Plugins of All Time: Updated List for 2024
-

 MARKETING6 days ago
The Ultimate Guide to Email Marketing


