Connect with us

SEO

How To Stand Out in an Ocean of AI Content

Published

on

How To Stand Out in an Ocean of AI Content

Most content today is arbitrage, simply moving information from one place to another.

Very few blog posts create new information. Most serve to remix, curate, and copycat existing content, transferring the same core information from one website to another.

If all your content does is shuffle common knowledge around, then I have bad news: the robots will eat your lunch. Generative AI is the ultimate arbitrage machine, able to churn out thousands of copycat articles faster than you ever could.

To stand out in a sea of commodity content, you have to go beyond the rote copy/pasting of information and find other ways to add value.

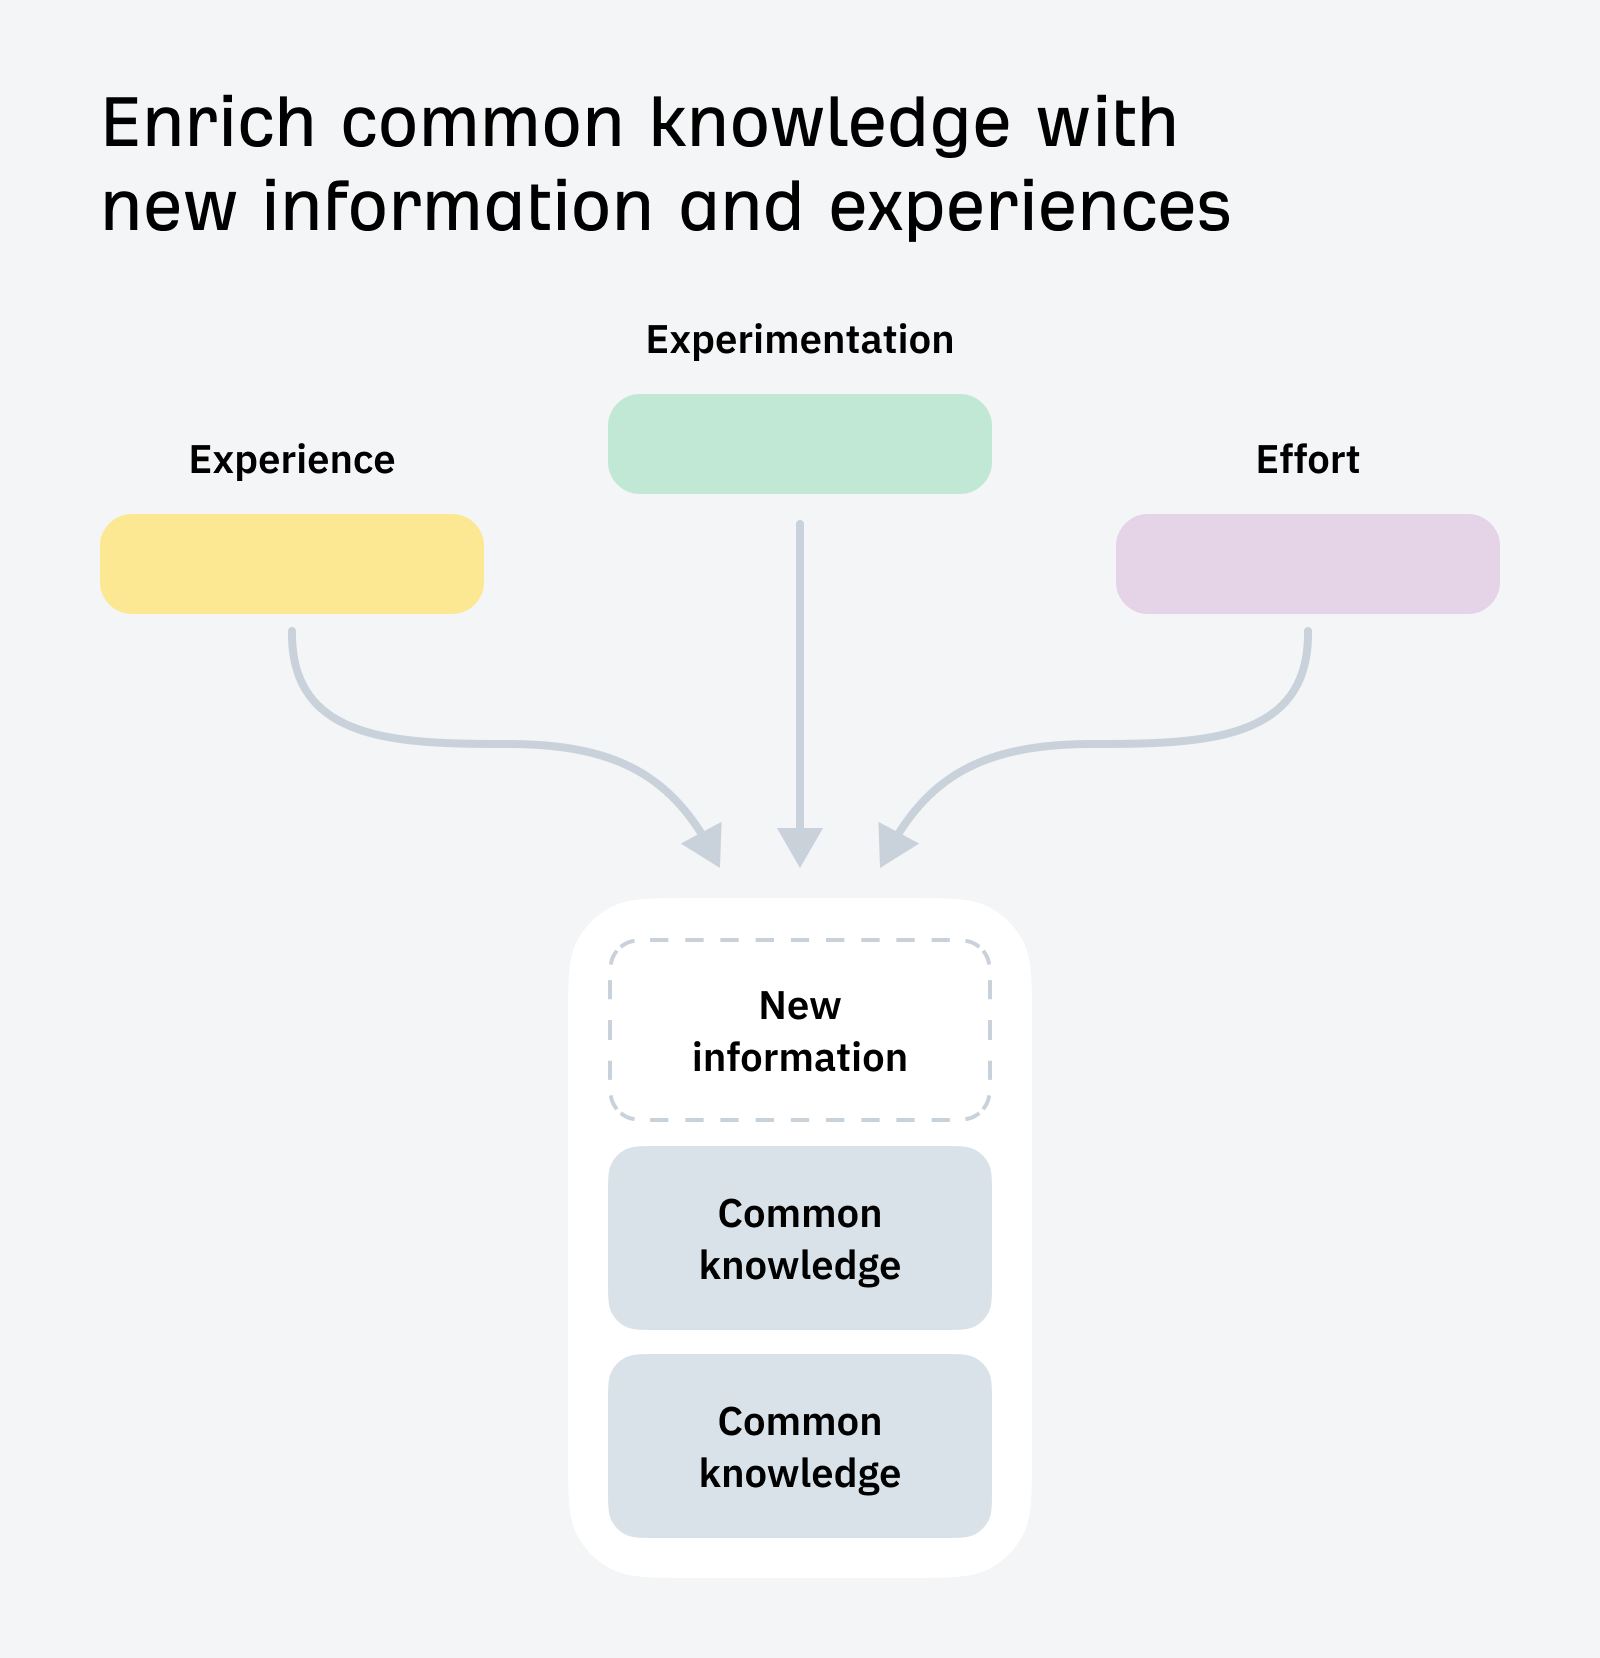
Thankfully, there are three ways you and your squishy human brain are uniquely qualified to add value beyond AI: experimentation, experience, and effort.
Advertisement
1711387566 982 How To Stand Out in an Ocean of AI Content1711387566 982 How To Stand Out in an Ocean of AI Content

The best way to add value beyond AI content is to experiment: to go into the world, test ideas, and collect new information that has never existed before.

LLMs are trained on a staggeringly vast dataset and continue to consume new information on a daily basis. But they are not omniscient. They have gaps in their knowledge: information that they haven’t been trained on, or more importantly, information that doesn’t exist yet.

When you experiment, you create something new and proprietary, unique to you and never seen before. If someone wants the information you have on offer, there’s only one place they can get it. It doesn’t exist in the data available to LLMs (at least, not yet). This is something that you, and only you, can do.

How to do it

This might sound intimidating, but experiments can be big or small, substantial projects in their own right or quick value-adds for otherwise mundane topics.

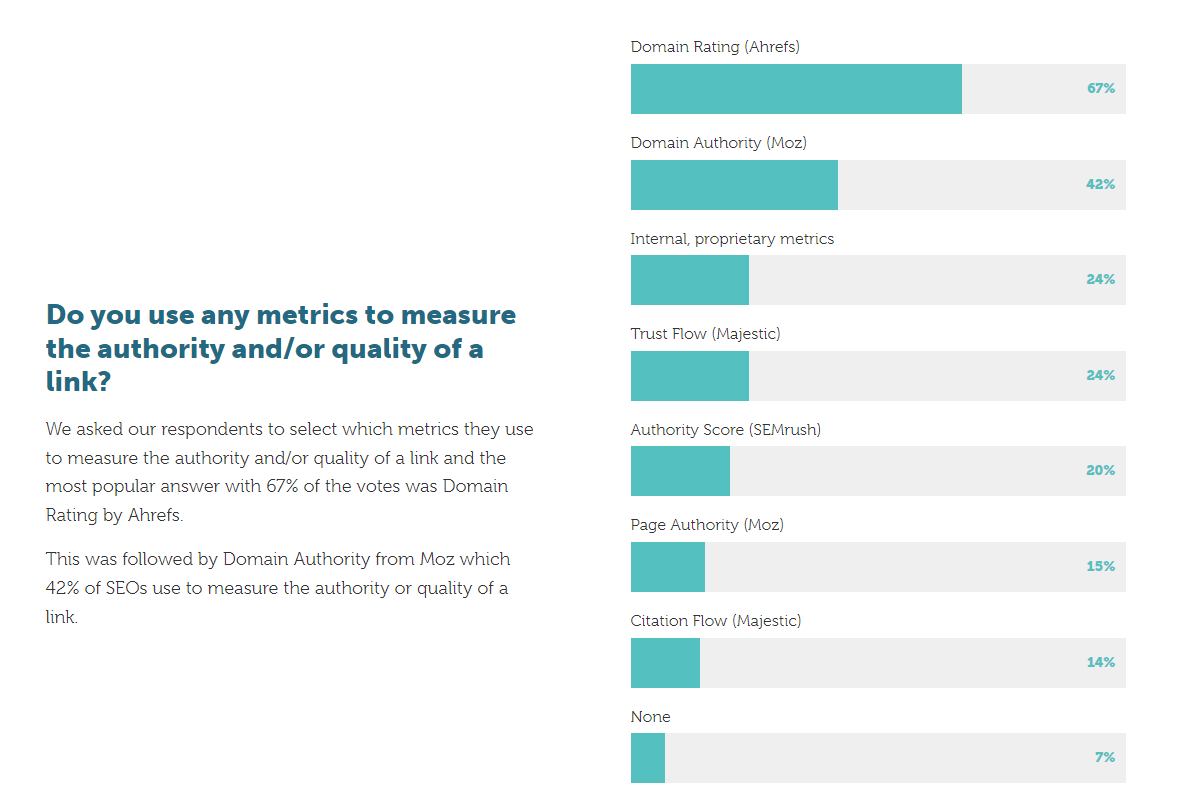
You can conduct sweeping industry surveys, like Aira’s state of linkbuilding report:
1711387566 709 How To Stand Out in an Ocean of AI Content1711387566 709 How To Stand Out in an Ocean of AI Content

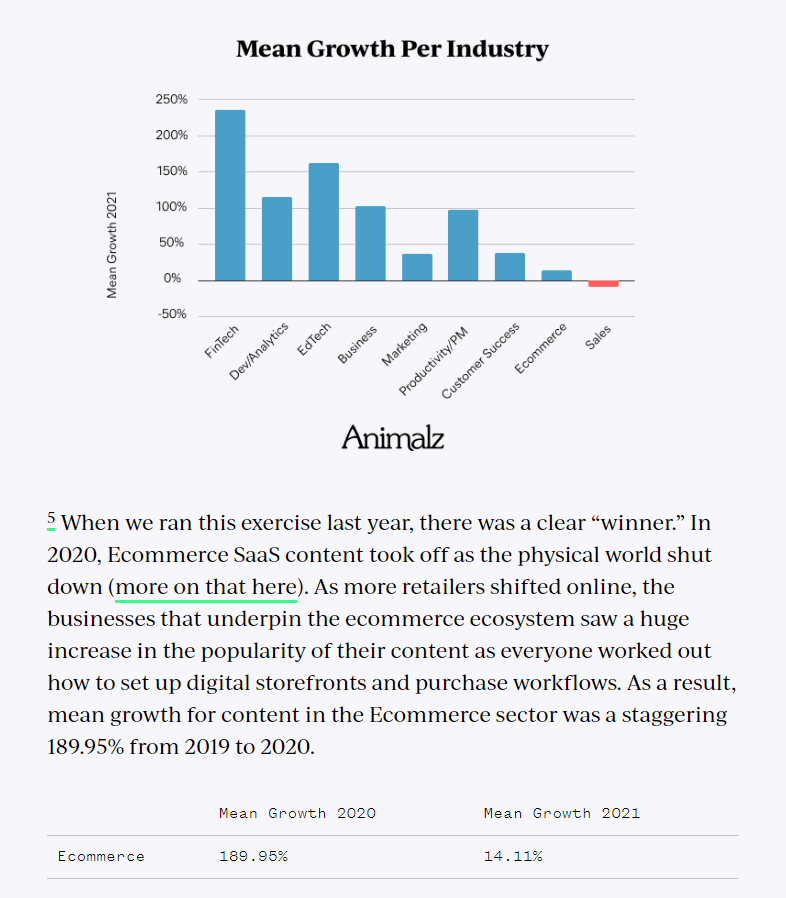
Analyze data generated by your company and its products, like the benchmark report I co-authored using 150MM pageviews of Google Analytics data:
1711387566 94 How To Stand Out in an Ocean of AI Content1711387566 94 How To Stand Out in an Ocean of AI Content

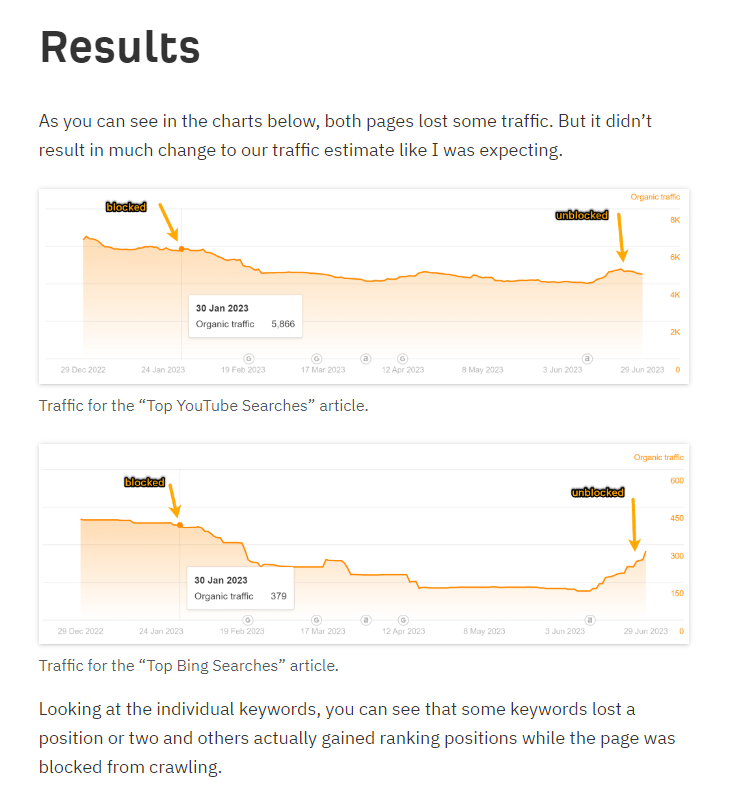
Run tests to understand how things work, like Patrick Stox did to explore the impact of blocking high-ranking pages with robots.txt:
1711387566 924 How To Stand Out in an Ocean of AI Content1711387566 924 How To Stand Out in an Ocean of AI Content

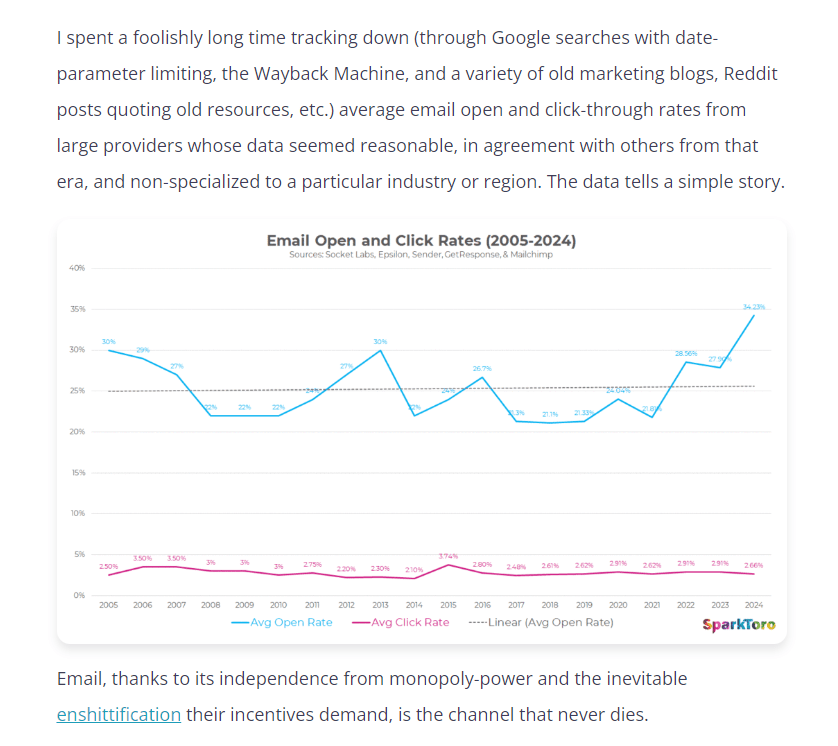
Collect data to prove (or disprove) well-known ideas, like Rand at SparkToro bringing receipts for the idea that email is the most reliable marketing channel:
1711387566 492 How To Stand Out in an Ocean of AI Content1711387566 492 How To Stand Out in an Ocean of AI Content

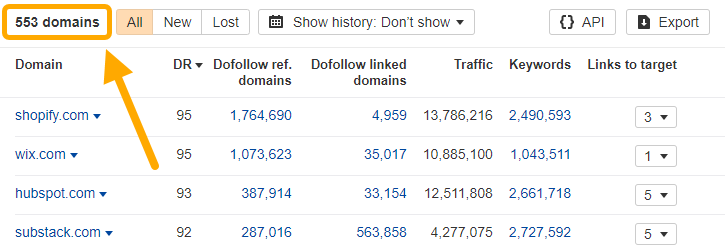
This has always been a great marketing strategy (and a great link-building tactic—everyone wants to link to original data, as the backlink data for Aira’s report shows).
1711387566 699 How To Stand Out in an Ocean of AI Content1711387566 699 How To Stand Out in an Ocean of AI Content

But it becomes more effective in an era of near-perfect information, when the marginal cost of content creation is virtually zero and the answer to any common problem can be summoned in an instant.

There is no longer lasting value in sharing basic information: the days of getting outsized results from being the first brand to share a basic “how to” or tutorial are numbered. Today, you have to create information as well as share it.

Advertisement

Anything created solely by generative AI is trapped in the realm of theory. It will always be less valuable than the same advice from an authoritative source, someone with obvious and relevant experience.

In a world where it’s easy to get answers to questions, readers will care more about the source of the answer. You can stand out from faceless AI content by proving to the reader that you have dirtied your hands, and actually experienced the thing you are writing about.

If there are fifty websites—or five hundred—offering an answer to their question, readers can afford to be discerning about the source they choose. If they want to learn about budgeting, they’ll probably pick the experienced financial advisor over the faceless CRM solution and a blog post authored by “Content Team”.

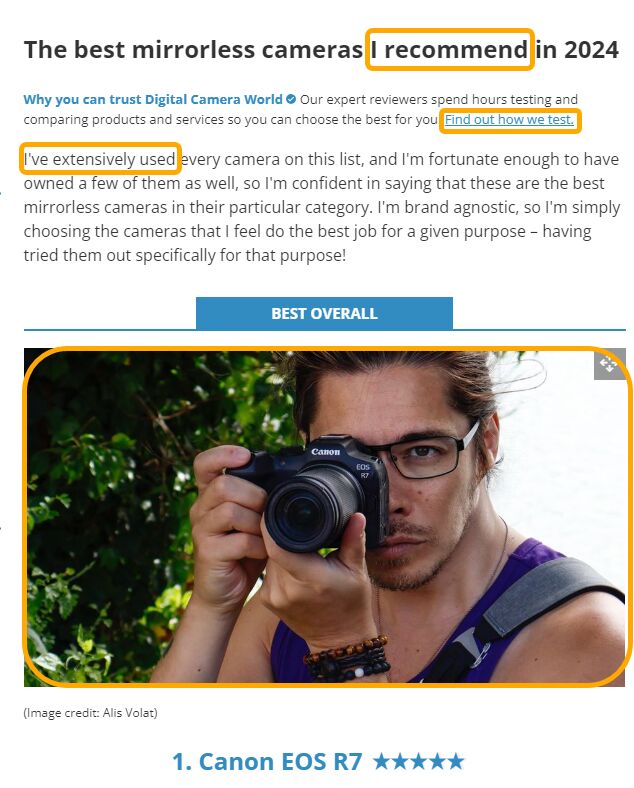
If they want to buy a new camera, they’ll prefer the reviewer that bought, used and compared actual cameras:
How To Stand Out in an Ocean of AI ContentHow To Stand Out in an Ocean of AI Content
Creating credibility through first-person anecdotes, original product photos, and a documented testing methodology.

Over any brand that scraped product descriptions from popular ecommerce stores or wrote in theoretical statements:

1711387566 523 How To Stand Out in an Ocean of AI Content1711387566 523 How To Stand Out in an Ocean of AI Content
No credibility in sight—just regurgitated product features without any firsthand experience.

The more crowded a topic becomes, the more important first-hand experience becomes as a method of differentiation. Your job is to prove the provenance of your advice.

How to do it

This is something we try to do regularly on the Ahrefs blog.

Advertisement

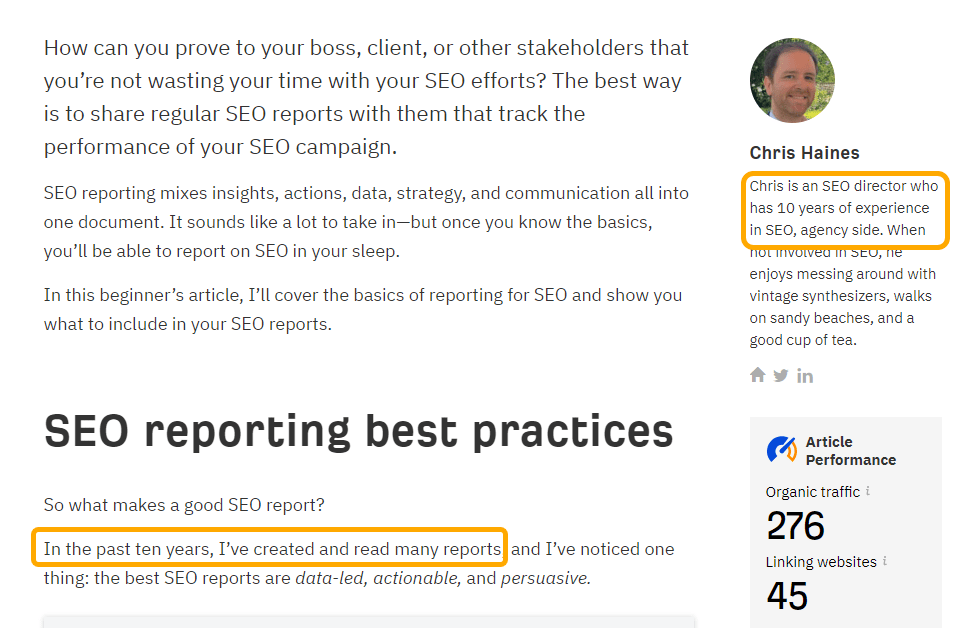
You can write about topics you have first-hand experience with, like Chris, an experienced agency SEO, writing our beginner’s guide to SEO reporting:
1711387566 537 How To Stand Out in an Ocean of AI Content1711387566 537 How To Stand Out in an Ocean of AI Content

Interview people on topics that you don’t, like Mateusz surveying real-life marketers about their favorite metrics:
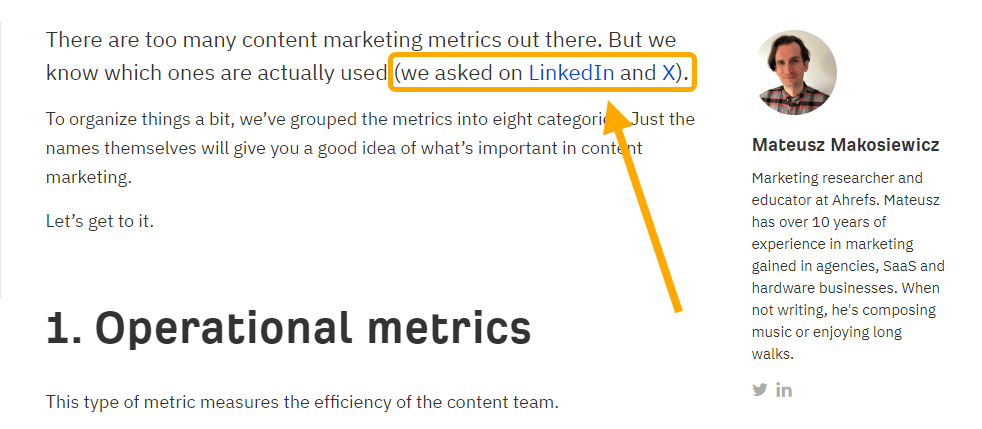
1711387566 443 How To Stand Out in an Ocean of AI Content1711387566 443 How To Stand Out in an Ocean of AI Content

Provide concrete evidence of your experience, whether that’s screenshotting the tool, filming the interview, or sharing a photo of the book you referenced:
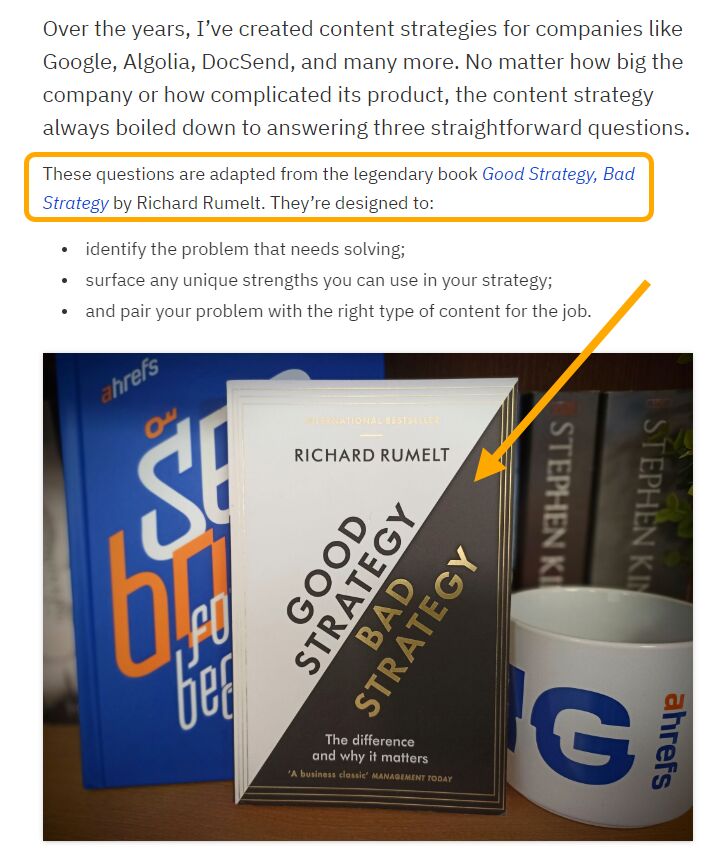
1711387567 913 How To Stand Out in an Ocean of AI Content1711387567 913 How To Stand Out in an Ocean of AI Content

Share anecdotes and stories that provide context to the information, like SQ reflecting on his experience writing over 100 articles:
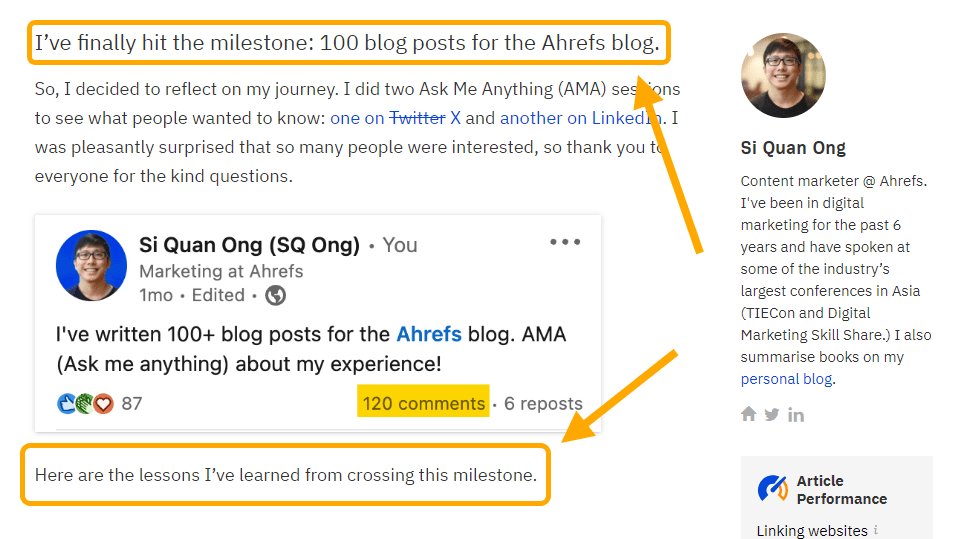
1711387567 459 How To Stand Out in an Ocean of AI Content1711387567 459 How To Stand Out in an Ocean of AI Content

Get skin in the game, like my attempt to read and rate every SEO newsletter available:
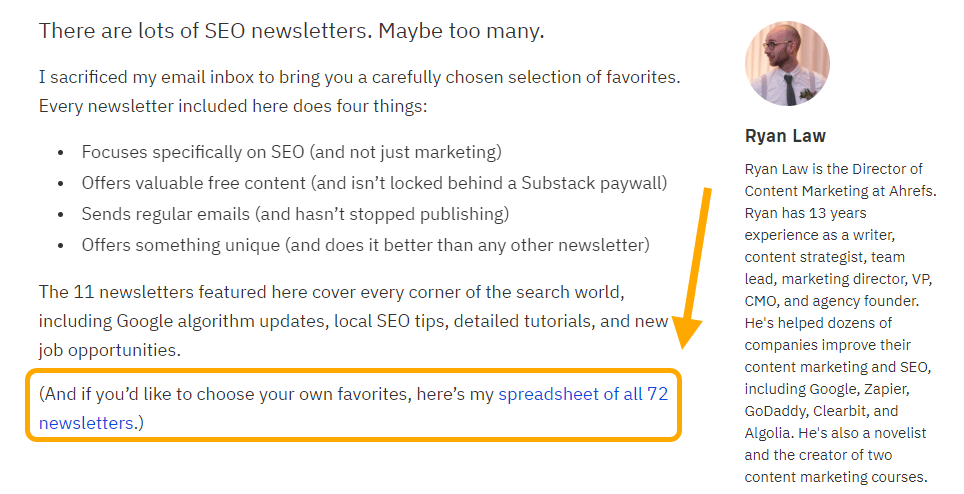
1711387567 804 How To Stand Out in an Ocean of AI Content1711387567 804 How To Stand Out in an Ocean of AI Content

The inverse is also true: you should avoid writing about topics where you lack any experience, and can’t justify acquiring it.

Most companies I see scaling AI content are cost-motivated. They are not using generative AI to create new, innovative experiences: they are trying to save money, and willing to sacrifice quality for speed of publication and reduction in headcount.

This provides a clear route of differentiation: make better things, expend more energy, and create content that is more than just words on a page.

How to do it

Many of the brands I follow (and products I pay for) earned my attention through big, effortful content campaigns.

There are webcomics, like Postmark’s email deliverability guide (featuring Dunning the super-owl):

Advertisement
1711387567 109 How To Stand Out in an Ocean of AI Content1711387567 109 How To Stand Out in an Ocean of AI Content

Video series, like Paddle’s Netflix-esque documentary series about acquiring a company:

1711387567 704 How To Stand Out in an Ocean of AI Content1711387567 704 How To Stand Out in an Ocean of AI Content

Books, like Ahrefs’ beautifully-illustrated children’s book:

We Published a Childrens Book Heres How to Get ItWe Published a Childrens Book Heres How to Get It

Free tools, like Veed’s TikTok downloader:

1711387567 480 How To Stand Out in an Ocean of AI Content1711387567 480 How To Stand Out in an Ocean of AI Content

Unique on-page experiences, like Typeform’s The Star Wars Guide to Net Promoter Score, complete with hand-drawn AT-ATs:

1711387567 513 How To Stand Out in an Ocean of AI Content1711387567 513 How To Stand Out in an Ocean of AI Content

This kind of content is rare. It is costly and difficult to create, requiring specialized skills and collaboration between different departments. But difficulty is a moat: if it’s hard to create, it can’t be instantly pumped out by any old company with any old AI tool.

Whilst it’s often hard to justify the effort and expense of these projects, it is becoming easier with every passing day. Thanks to generative AI, publishing functional, “vanilla” content—words on a page with a stock image or two—is just not a differentiator.

The more effort you expend building tools, publishing books, or creating unique experiences, the greater the likelihood that real people will remember your brand, care about your company, and eventually buy something from you.

Final thoughts

Generative AI makes it very easy to share fairly well-written, fairly accurate information, on a staggering array of topics. Humans will never beat AI at this game, and frankly, we shouldn’t try.

We need to accept the growing bifurcation of content. Let AI handle the low-end of content—basic informational content, definitions, summaries and synopses, listicles—and focus skilled human energy on the high-end.

In the era of generative AI, there is no edge to be found by simply shuffling common knowledge from place to place. We need to find new dimensions of differentiation and lean into our unique strengths: creating new information through experimentation, getting our hands dirty and sharing first-person experience, and exerting ourselves to create what others won’t.

Advertisement

Source link

Keep an eye on what we are doing
Be the first to get latest updates and exclusive content straight to your email inbox.
We promise not to spam you. You can unsubscribe at any time.
Invalid email address

SEO

Google Launches New ‘Saved Comparisons’ Feature For Analytics

Published

on

By

Businessman analyzes page data

Google announced a new tool for Analytics to streamline data comparisons.

The ‘saved comparisons’ feature allows you to save filtered user data segments for rapid side-by-side analysis.

Google states in an announcement:

“We’re launching saved comparisons to help you save time when comparing the user bases you care about.

Learn how you can do that without recreating the comparison every time!”

Google links to a help page that lists several benefits and use cases:

“Comparisons let you evaluate subsets of your data side by side. For example, you could compare data generated by Android devices to data generated by iOS devices.”

“In Google Analytics 4, comparisons take the place of segments in Universal Analytics.”

Saved Comparisons: How They Work

The new comparisons tool allows you to create customized filtered views of Google Analytics data based on dimensions like platform, country, traffic source, and custom audiences.

These dimensions can incorporate multiple conditions using logic operators.

For example, you could generate a comparison separating “Android OR iOS” traffic from web traffic. Or you could combine location data like “Country = Argentina OR Japan” with platform filters.

These customized comparison views can then be saved to the property level in Analytics.

Advertisement

Users with access can quickly apply saved comparisons to any report for efficient analysis without rebuilding filters.

Google’s documentation states:

“As an administrator or editor…you can save comparisons to your Google Analytics 4 property. Saved comparisons enable you and others with access to compare the user bases you care about without needing to recreate the comparisons each time.”

Rollout & Limitations

The saved comparisons feature is rolling out gradually. There’s a limit of 200 saved comparisons per property.

For more advanced filtering needs, such as sequences of user events, Google recommends creating a custom audience first and saving a comparison based on that audience definition.

Some reports may be incompatible if they don’t include the filtered dimensions used in a saved comparison. In that case, the documentation suggests choosing different dimensions or conditions for that report type.

Why SEJ Cares

The ability to create and apply saved comparisons addresses a time-consuming aspect of analytics work.

Advertisement

Analysts must view data through different lenses, segmenting by device, location, traffic source, etc. Manually recreating these filtered comparisons for each report can slow down production.

Any innovation streamlining common tasks is welcome in an arena where data teams are strapped for time.

How This Can Help You

Saved comparisons mean less time getting bogged down in filter recreation and more time for impactful analysis.

Here are a few key ways this could benefit your work:

  • Save time by avoiding constant recreation of filters for common comparisons (e.g. mobile vs desktop, traffic sources, geo locations).
  • Share saved comparisons with colleagues for consistent analysis views.
  • Switch between comprehensive views and isolated comparisons with a single click.
  • Break down conversions, engagement, audience origins, and more by your saved user segments.
  • Use thoughtfully combined conditions to surface targeted segments (e.g. paid traffic for a certain product/location).

The new saved comparisons in Google Analytics may seem like an incremental change. However, simplifying workflows and reducing time spent on mundane tasks can boost productivity in a big way.


Featured Image: wan wei/Shutterstock


Source link

Advertisement
Keep an eye on what we are doing
Be the first to get latest updates and exclusive content straight to your email inbox.
We promise not to spam you. You can unsubscribe at any time.
Invalid email address
Continue Reading

SEO

Automate Multi-Site Reporting With Google Sheets And GSC API

Published

on

By

Illustration of a modern workspace setup with a desktop showing Google Sheets, a mobile device with documents, a calculator, and a target with arrows on a yellow background.

Working in SEO leads to interesting challenges that I’m sure you’ve all faced at one point.

You’re a master of flexibility and managing tedious tasks. I’ve recently found myself dealing with 100+ top-tier sites.

Working with global companies, it’s quite the puzzle to:

  • Wrangle data for 100+ sites.
  • Keep tabs on every site’s performance.

And, since some of these sites compete against each other on the first page of Google, it’s quite possible that Site 1’s traffic drops but Site 2 captures the loss.

Checking one site’s Google Search Console (GSC) is easy, but it’s intense with hundreds of sites at a global scale.

What Can You Do?

I devised a Google Sheets Apps Script that connects to GSC’s API to transform global reporting from an arduous task that can take days – or weeks – into one that takes a few minutes.

Advertisement

After creating the script, I can easily put in a date range and pull each site’s:

  • Clicks and impressions.
  • Keywords.
  • Average rankings.
  • Etc.

Since we manage hundreds of sites, it’s not uncommon for users to end up on one of our sites to make their purchase, as mentioned above.

In the grand scheme of things, the bigger picture is more important than an individual site’s performance.

What I’m going to show you is my 10-step process to create a script that pulls clicks and impressions and then compares it all year over year (YoY).

10-Step Process To Create A Google Sheets Apps Script For Reporting On Hundreds Of Sites

Step 1: Creating Your Google Sheets

Screenshot from author, April 2024

Your first step is to create your original Google Sheets file. You can do this by following these steps:

  • Go to Google Drive.
  • Navigate to the folder where you want to place the files.
  • Right-click on the background
  • Select > Google Sheets > Blank Spreadsheet.

You’ll want to rename the file. I called mine “Global Search Console Reporting.”

step 1 name google sheets fileScreenshot from author, April 2024

Your file is now set up, and you’re ready for the next step.

Step 2: Setting Up Your Google Sheet

A blank sheet isn’t useful and won’t make sense to users until you add some headers in Row 1. Headers that I recommend adding, in this order and bolding, are:

  • Website.
  • Niche.
  • Clicks.
  • Impressions.
  • YoY Clicks.
  • YoY Impressions.
  • Clicks % Difference.
  • Impressions % Difference.

Your file should now look something like this:

step 2 add column headersScreenshot from author, April 2024

Your next step is to create a Google Cloud Project, which is also fairly simple and straightforward.

Step 3: Create A Google Cloud Console Data Project

Creating your project should be free because Google provides a $300 credit to try out its platform. If you haven’t used Google Cloud, you can find it at https://console.cloud.google.com/.

Advertisement

You can now follow these steps:

  • Tap Select Project > New Project.
  • Enter Project Name (example: “My GSC Data Project”).
  • Tap Create.
step 3 google console projectScreenshot from author, April 2024
  • Click Select Project.
  • Select your Project.

step 3 select project

  • Click the top Search bar.
  • Type “Google Search Console API.
  • Select “Google Search Console API.”
  • Click Enable.

step 3 search console api

Step 4: Create Apps Scripts In Google Sheets

In this step, we will work on integrating the Apps Script into the Google Sheet that you created previously. You’ll need to open the Sheet and follow these steps:

  • Tap Extensions > Apps Script.

step 4 create apps script

I’m not going to go into the details on how the script works, but you can copy this code:

function onOpen() {
  var ui = SpreadsheetApp.getUi();
  // Or DocumentApp or FormApp.
  ui.createMenu('Search Console')
    .addItem('Fetch Data', 'menuItem1')
    .addToUi();
}

function menuItem1() {
  var sheet = SpreadsheetApp.getActiveSpreadsheet().getActiveSheet();
  var lastRow = sheet.getLastRow(); // Find the last row with data in column A

  // Clear cells C2:F151 before processing data
  sheet.getRange("C2:F151").clearContent();

  for (var i = 2; i <= lastRow; i++) { var siteProperty = sheet.getRange(i, 1).getValue(); var startDateValue = sheet.getRange('M1').getValue(); var endDateValue = sheet.getRange('M2').getValue(); var timeZone = SpreadsheetApp.getActiveSpreadsheet().getSpreadsheetTimeZone(); var format = "yyyy-MM-dd"; // Calculate dates for last year var lastYearStartDate = new Date(startDateValue); lastYearStartDate.setFullYear(lastYearStartDate.getFullYear() - 1); var lastYearEndDate = new Date(endDateValue); lastYearEndDate.setFullYear(lastYearEndDate.getFullYear() - 1); var startDate = Utilities.formatDate(lastYearStartDate, timeZone, format); var endDate = Utilities.formatDate(lastYearEndDate, timeZone, format); // Fetch data for the previous year var previousYearResponse = requestSearchConsoleAPI(siteProperty, startDate, endDate); // Fetch data for the current year (unchanged) startDate = Utilities.formatDate(new Date(startDateValue), timeZone, format); endDate = Utilities.formatDate(new Date(endDateValue), timeZone, format); var currentYearResponse = requestSearchConsoleAPI(siteProperty, startDate, endDate); // Process and write data for both years processAndWriteData(sheet, i, previousYearResponse, currentYearResponse); } } function processAndWriteData(sheet, row, previousYearResponse, currentYearResponse) { // Check if response is not defined or null and has at least one row if (previousYearResponse && previousYearResponse.length > 0) {
    var previousYearClicks = 0;
    var previousYearImpressions = 0;

    previousYearResponse.forEach(function(row) {
      previousYearClicks += row.clicks;
      previousYearImpressions += row.impressions;
    });

    sheet.getRange(row, 5).setValue(previousYearClicks); // Write to column D (index 5)
    sheet.getRange(row, 6).setValue(previousYearImpressions); // Write to column E (index 6)
  } else {
    Logger.log('No data found for previous year in row: ' + row);
  }

// Process and write data for the current year
  if (currentYearResponse && currentYearResponse.length > 0) {
    var currentYearClicks = 0;
    var currentYearImpressions = 0;

    currentYearResponse.forEach(function(row) {
      currentYearClicks += row.clicks;
      currentYearImpressions += row.impressions;
    });

    sheet.getRange(row, 3).setValue(currentYearClicks); // Write to column C (index 3)
    sheet.getRange(row, 4).setValue(currentYearImpressions); // Write to column D (index 4)
  } else {
    Logger.log('No data found for current year in row: ' + row);
  }
}


function requestSearchConsoleAPI(siteProperty, startDate, endDate) {

  try {
    const oauthToken = ScriptApp.getOAuthToken(); // Correctly call the method
    const siteUrl = siteProperty;
    const url="https://www.googleapis.com/webmasters/v3/sites/" + encodeURIComponent(siteUrl) + '/searchAnalytics/query';
    const payload = {
      startDate: startDate,
      endDate: endDate,
      type: 'web'
    };

    const headers = {
      'Authorization': 'Bearer ' + oauthToken,
      'Content-Type': 'application/json'
    };
    const options = {
      'method': 'post',
      'contentType': 'application/json', // Consistent content type
      'headers': headers,
      'payload': JSON.stringify(payload),
      'muteHttpExceptions': true
    };

    const response = UrlFetchApp.fetch(url, options);
    const responseCode = response.getResponseCode();
    const contentText = response.getContentText(); // Get response text for logging

  Logger.log('Response Code: ${responseCode}'); // Use backticks
  Logger.log('Response Content: ${contentText}'); // Use backticks


  if (responseCode === 200) {
    const json = JSON.parse(contentText);
    Logger.log(json); // This will log the actual JSON response
    return json.rows; // Adjust this line based on the actual structure of your API response
  } else {
    // Correctly use backticks here for template literals
    const errorMessage="Error fetching data: ${responseCode} - ${contentText}";
    Logger.log(errorMessage);
    throw new Error(errorMessage);
  }

  } catch (e) {
    Logger.log('Error: ${e.toString()}');
    return null;
  }
}

And then go back to your Apps Script project and do the following:

  • Press CTRL + A to select all.
  • Press CTRL + V to paste in the code you copied.
  • Tap OK.
  • Click Save project.
  • Tap Run.

*Note: If you are receiving a Bad Request error from Google with too many redirects, this is because you have multiple accounts logged in. Try in a browser with only one Google account logged in.

step 4 save run apps scriptScreenshot from author, April 2024

You’ll be requested to Review permissions and will need to select the Google Account associated with your Google Search Console.

Google will give you a warning because the app isn’t verified, so simply tap on the “Advanced” setting and then “Go to Untitled project (unsafe).”

step 4 unsafe appScreenshot from author, April 2024

Finally, you can complete this step by tapping or clicking on the Allow button.

Step 5: Set Up The Access Credentials

I know there’s a lot of back-and-forth going on between Sheets and Google Cloud Console, but it’s an unfortunate necessity at this point. Now, we will be setting up Access Credentials, which will require you to go back to the Google Cloud Console.

Advertisement

Note: You must have enabled the Google Search Console API from the previous step.

Your screen should look something like this:

step-5 oauth concent screenScreenshot from author, April 2024

You’ll need to:

  • Tap Credentials > Create Credentials.
  • Tap OAuth client ID > Configure Consent Screen.

step 5 create credentials oauth

  • Click External.
  • Tap Create.
  • Enter “My GSC Data” as the App name.
  • Add your Support email (your email used for GSC).
  • Add your Developer contact information (the email you used for GSC).
  • Tap Save and continue.
  • Tap ADD OR REMOVE SCOPES.
  • Check 2 of the Google Search Console API scopes (might be on page 2).

step 5 add gsc api scope

  • Click Update.
  • Click Save and Continue.
  • Now click Add Users.

step 5 add users

  • You can add multiple users, preferably those that have access to GSC.
  • Save and Continue.

Step 6: Set Up Google Cloud Project For GSC Data

While we’re still on the Google Cloud Project, you’ll want to click the hamburger icon and go to Cloud overview > Dashboard:

step 6 cloud dashboardScreenshot from author, April 2024

You’ll notice that it says “Project number,” which you should select and Copy by pressing CTRL + C.

Switch back to your Apps Script tab and tap Project Settings:

step 6 app settingsScreenshot from author, April 2024

Go to the section titled Google Cloud Platform (GCP) Project, paste the project number (CTRL +  V) into the text box, and click Set project.

Step 7: Rename Your Google Apps Script

You’ll now want to rename your Apps Script by going to Project History like this:

step 7 project name

You’ll then:

  • Click Untitled project at the top of the screen.
  • Enter “My GSC Data Project Script.”
  • Click on Rename.

Step 8: Edit Google Apps Manifest File For Code.gs Script

You’re still staying inside of your script, and we’re going to go back to Project Settings just as we did before.

This time, you’ll want to click Show “appsscript.json” manifest file in editor to make sure there’s a checkmark next to it.

Advertisement

Next, click on Editor and navigate to the appsscript.json, which you can see below:

step 8 edit appscript jsonScreenshot from author, April 2024

You’ll want to delete everything in the appsscript.json file and paste in the following script:

{
  "timeZone": "America/New_York",
  "dependencies": {
  },
  "exceptionLogging": "STACKDRIVER",
  "oauthScopes": [
    "https://www.googleapis.com/auth/webmasters",
    "https://www.googleapis.com/auth/script.external_request",
    "https://www.googleapis.com/auth/spreadsheets",
    "https://www.googleapis.com/auth/spreadsheets.currentonly"
  ]
}

Once you’ve added the code, you can click on your Code.gs file and tap Save, and then Run. You’ll be prompted to review permissions, and you’ll need to select your appropriate account to continue using.

After a few prompts, you’ll be asked to allow your app “My GSC Data,” and execution will begin.

Step 9: Adjust The Dates For Website Data Analysis

In the Google Sheets file, you’ll want to add the following under:

  • L1: Start Date.
  • L2: End Date.

Note: The start and end dates should be specified in M1 and M2. For example, you can input:

Note: The date format may differ based on your system settings and location.

Step 10: Set Conditional Formatting For Non-Empty Cells Less Than Zero

Everything is set up, but you should add some conditional formatting to make it look better. We’re going to focus on the “Clicks % Difference” and “Impressions % Difference” columns:

Advertisement
step 10 clicks impressionsScreenshot from author, April 2024

Select the rows under the headers “Clicks % Difference” and “Impressions % Difference” and click on Format > Conditional formatting. Under Format rules, you’ll want to select Less than.

In the “Value or formula” text area, you can add 0.

What this does is that if it’s less than 0, we’ll be changing the color to red since it’s in the negative and traffic has been lost. You can do this by clicking on the paint can and changing it to red before clicking done.

If you want to change a positive increase in traffic to green, you’ll add another rule for Greater than and add the 0 value.

Here are the formulas to use in G2 and H2 (you can replicate them for each row; just click and drag down for the other rows):

=IFERROR(IF(AND(C2<>"",E2<>""), (C2-E2)/E2, ""),"")
=IFERROR(IF(AND(D2<>"",F2<>""), (D2-F2)/F2, ""),"")

Now, you have an easy way to run reports on multiple sites at once.

That’s It, You Have Your Global Report

In column A, input your Google Search Console properties; if it is a domain property, add it as sc-domain:example.com or a URL property as https://example.com

Advertisement

To run or refresh the report, use the special menu Search Console > Fetch Data:

final step run

*Note: This script supports about 150 domains, but if you need more, you can adjust the row #14 in your AppScripts file:

sheet.getRange("C2:F151").clearContent();

Using this very tutorial, you’ll have an easy time turning days of gathering data and running reports into a few minutes. You can even expand the scripts to perform other calculations or gather more data for your report.

Check out my other tutorial on Integrating ChatGPT With Google Sheets.

Automating your reports is a great way to streamline tedious tasks, and I hope it makes your job a little easier.

More resources: 


Featured Image: 200dgr /Shutterstock

Advertisement

Source link

Keep an eye on what we are doing
Be the first to get latest updates and exclusive content straight to your email inbox.
We promise not to spam you. You can unsubscribe at any time.
Invalid email address
Continue Reading

SEO

Blog Post Checklist: Check All Prior to Hitting “Publish”

Published

on

Check All Prior to Hitting “Publish” – SEO Consulting

One thing I have clearly realized while being a full-time blogger and editor is that most writers (no matter how much we love them) are terrible at formatting.

I mean, I get it.

Writing is a creative process, and things like formatting, interlinking and proofreading may keep you from letting your creativity flourish.

One workaround is hiring a VA but if you have control issues (like I do) and still want to do everything on your own, here’s a free blog checklist that’s easy to follow and help you publish a perfectly formatted article each time!

A good formatting checklist should be:

Advertisement
  • As short as possible (The longer it is, the more chances there are that none of your contributors will follow all the steps);
  • As concise as possible (Avoid explaining the reason why you want it to be formatted that way. The more you explain, the less obvious your point becomes. Just list your requirements)
  • As easy to understand as possible (Add a few screenshots, bold most important points, etc).

Feel free to make yourself a copy of this checklist, edit minor details (like the preferred width of images) and use it to edit your blog. It will be suitable and (hopefully) useful for.

  • A single-author blog for consistency
  • A (business) blog with multiple co-authors;
  • A business managing multiple paid contributors;
  • A business owner outsourcing content to ghost writers, etc.

Attention: This guide requires that your blog contributor has a wp-admin (Contributor) access to your blog. Otherwise, you may ask to send you the articles in HTML.

*Make a free copy of the checklist here. Read some explanations below*

Blog Post Checklist: Check All Prior to Hitting "Publish"

Structuring Standards

We know that breaking the article into sections is very important: blog readers tend to scan through the articles jumping from a subheading to a subheading (and probably reading the sections that seem most relevant to them).

One of the most efficient ways to capture your readers’ attention is to provide catchy subheadings that would summarize your article content nicely. Ideally, the reader of the article should understand what it is about by just scanning through the subheadings which should effectively summarize the article content while still encouraging the reader to go more indepth.

Subheadings

Other important guidelines that (may) go in this section:

  • Make your sentences and paragraphs short (that makes the whole article easier to read)
  • Introduce your article effectively in the opening paragraphs and encourage a discussion in the conclusion (by asking some questions)

Adding Links

Links are always great (unless links are brutally self-serving and anchor-text-dirty). I always encourage all my authors include links to any app, business or person they are mentioning. Links are user-friendly, so in my guidelines I always prompt contributors to:

  • Link to relevant articles on my blog;
  • Link to others relevant articles elsewhere (as well as sources of information, apps, etc)
  • Normally link words (not image files or subheadings)
  • Always make sure they are using the full URL and the original “clean” link (now a shortened version, stripping all tracking parameters, etc).

Lists

Including lists is also highly appreciated. A well-formatted list is likely to draw readers’ attention and make them stay.

Sadly, contributors tend to format lists in all possible ways using -, *, or any other inappropriate symbols instead proper <ul><li> coding. Therefore it’s a good idea to remind them of proper formatting here.

Images

Another very important element of any blog post. Images will never be added unless you clearly ask for them.

Here I specify the proper style and size of the images as well as encourage authors to include a relevant, catchy and properly attributed Creative Commons image.

Advertisement

Here are more checklists you may find useful for blogging:

FAQ: Blog Post Checklist: Check All Prior to Hitting “Publish”

What is the purpose of the blog post checklist?

The blog post checklist is designed to help bloggers and editors publish well-formatted articles consistently, without having to compromise on the creativity of the writing process.

Who can benefit from using this checklist?

The checklist can be beneficial for a range of people including single-author blogs, multi-author business blogs, business owners outsourcing content to ghost writers, and businesses managing multiple paid contributors.

What are the key components of the checklist?

Advertisement

The blog post checklist focuses on:

  • Structuring standards (including catchy subheadings and succinct paragraphs)
  • Proper linking to relevant articles and sources
  • Creating well-formatted lists
  • Adding appropriately styled and attributed images.

How should the article checklist be crafted?

The checklist should be as short, concise, and easy to understand as possible, with important points highlighted, possibly with the use of screenshots.

How can readers access the checklist?

Make a free copy of the checklist from the link and modify it according to their preferences and needs.

If you find the guidelines useful or have any improvements to suggest, please comment below!

Advertisement
The following two tabs change content below.
Blog Post Checklist Check All Prior to Hitting Publish

I am Ann Smarty, owner of SEOsmarty.com. I’ve been in the SEO industry for two decades. I am the former Editor-in-Chief of Search Engine Journal and a contributor to Mashable. These days I am running Viral Content Bee and writing for Moz, Buzzsumo, Wix and many others!

Blog Post Checklist Check All Prior to Hitting Publish
Advertisement

Source link

Keep an eye on what we are doing
Be the first to get latest updates and exclusive content straight to your email inbox.
We promise not to spam you. You can unsubscribe at any time.
Invalid email address
Continue Reading

Trending

Follow by Email
RSS