MARKETING
How to Calculate Your Lead Generation Goals [Free Calculator]
![How to Calculate Your Lead Generation Goals [Free Calculator] How to Calculate Your Lead Generation Goals [Free Calculator]](https://articles.entireweb.com/wp-content/uploads/2022/06/How-to-Calculate-Your-Lead-Generation-Goals-Free-Calculator.pngkeepProtocol.png)
To hit revenue and growth goals, your company needs customers. To get customers in an inbound world, your marketing team is responsible for generating leads and funneling them over to your sales team. The question is … how many leads?
When your boss asks you what your lead goal is, don’t just pull an answer out of thin air. Your projections need to be based on math and anchored in your company’s larger goals. That’s where our new lead goal calculator comes in.
Lead Calculator
To make it easier for marketers like you to set your lead goals for the month, we created a calculator template in Google Sheets and Excel that will calculate exactly how many leads your inbound marketing efforts need to drive each month for your sales organization to hit their numbers and your company to meet its growth goals. With just a few quick inputs, like your monthly revenue goal and average deal size, this template will do all the Math for you.
Our lead generation goal calculator is a customizable Service Level Agreement (SLA) template that can help you calculate your lead goals based on sales headcount and marketing & sales conversion rates. The template can also monitor sales close rates, assign dollar values to each of your lead sources, track monthly lead generation by channel, and help your business commit to a concrete monthly lead generation goal.
You can download the Lead Goal Calculator here.
How to Use A Lead Goal Calculator
To use the Lead Goal calculator, follow these simple steps:
- Step 1: Work with your sales leadership team to determine the overall monthly revenue target that your company needs to hit. This will ensure that marketing acts as a growth engine and your revenue team is in line with sales. Take your revenue targets per region per month and add them to the correct cells. Remember to update this spreadsheet if your goals change at any point throughout the year.
- Step 2: Determine the value of your average deal size. This will help you determine how many deals you need to close to hit your revenue numbers. Calculating your average deal size is simple. First, identify your average sale price for each of your core regions or personas. Find this data in your marketing software and sales CRM tools. Input your average sale value into the top “average sale price” row for each region. Our template will automatically calculate the value of your leads based upon the % close rates you filled in for step one. Revisit your average sale prices for your personas or regions regularly to make sure you are holding your teams to the right numbers.
- Step 3: Work with your sales leadership to determine the percentage of revenue pipeline generated by marketing and the revenue generated directly by sales. This will vary depending on how inbound versus outbound your company is. This may change throughout the year and should regularly be updated in this spreadsheet.
- Step 4: Examine your sales closing rates, and specifically tease out what percentage of your leads ultimately become customers. This analysis looks at the historical performance in your marketing and sales, In addition, this analysis fills these holes in with actual performance data. To tease out your overall closing rates, look at your last six months of sales data for each channel that you use to generate marketing leads.
- Step 5: The last section of our calculator will tally your commitments. As you fill in steps one through three, the calculator will automatically populate the total fields for each channel and persona. This worksheet will sum up your channel and persona goals and your overall monthly total. Ultimately, the total monthly goal you commit to should equal the total potential revenue each segment or region can produce per month. As you fill out your tables each month, the calculator will show how you are tracking towards your monthly goal.
It’s important to adapt this spreadsheet to meet your individual needs. It may work better to split your revenue by personas. If this is the case, just swap out the region for persona. The calculations will still work.
Take the average close rate and add it to the correct cell in the document. Remember to update this spreadsheet every month, as your channel performance will change over time.
In the Performance Against Plan tab, you’ll track your daily actual leads and track monthly volume trends and percentage performance against plan.
The Performance Against Plan Example shows a snapshot of a month’s productivity. For maximum visibility, update these leads on an ongoing basis. For example, HubSpot managers often monitor these numbers daily, and we send the marketing team a daily summary of our month-to-date performance.
You can also use this template to experiment. For example, try changing the conversion rates and see how your lead goals go down or up accordingly.
Lead Calculator Examples
With our Lead Goal Calculator template, you can easily calculate your business’s marketing and sales lead goals for different media channels, including your social media, website, and email marketing.
As shown in the examples below, our calculator will guide you through how to fill in the data for your revenue, average deal size, percentage of revenue from marketing, and lead to close rate in the Lead Target by Month tab. Once this data is entered, the calculator will determine the number of leads you need to bring in to hit your revenue goals successfully.
1. Performance Against Plan
The Performance Against Plan tab will automatically populate and calculate your total target per month for all of your segments. The Performance Against Plan tab also provides a table that you can manually fill in with your business’s actual qualified lead volume every month, so you can track your progress every month and identify volume trends. After filling in the table, the number of leads you need to bring in to hit your revenue goals will be calculated automatically.
2. Leads From Social
You can use our Lead Goal Calculator to determine how many prospects your business needs to connect with on social media in each region to generate leads and meet your sales goals each month.
The calculator can also help you keep track of the amount of monthly revenue you earn through social media posts and advertising, as well as the average size of deals that your business gains through social media each month. In addition, the calculator can help you determine the average percentage of revenue your business gains through social media each month and your average Marketing Qualified Lead to Close rate based on historical data per region.
3. Leads From Website
You can use our Lead Goal Calculator to determine how many prospects your business needs to connect with on your website in each region to generate leads and meet your sales goals. Our calculator can also help you track revenue per month on your SaaS or e-commerce website.
4. Leads From Email
You can use our Lead Goal Calculator to determine what percentage of your business’s revenue should come from email marketing month-by-month. The calculator can also determine how many prospects in each region need to opt-in to receive your business’s marketing emails to generate leads and meet your sales goals.
Start Calculating Your Sales Goals
Our Lead Goal Calculator has everything your business needs to visualize your lead target per month, and this tool calculates your lead goals and sales goals throughout the year.
Editor’s note: This post was originally published in January 2017 and has been updated for comprehensiveness.
MARKETING
Navigating the Video Marketing Maze: Short-Form vs. Long-Form


Are you torn between using long-form or short-form videos for your small business marketing campaign? Well, you are not alone. Despite 89% of consumers wanting to see more brand videos, there is no one-size-fits-all answer about the ideal video length.
However, this should not deter you from creating an effective video strategy. In 2023, people watched an average of 17 videos per day, highlighting the influence of video content in today’s digital landscape.
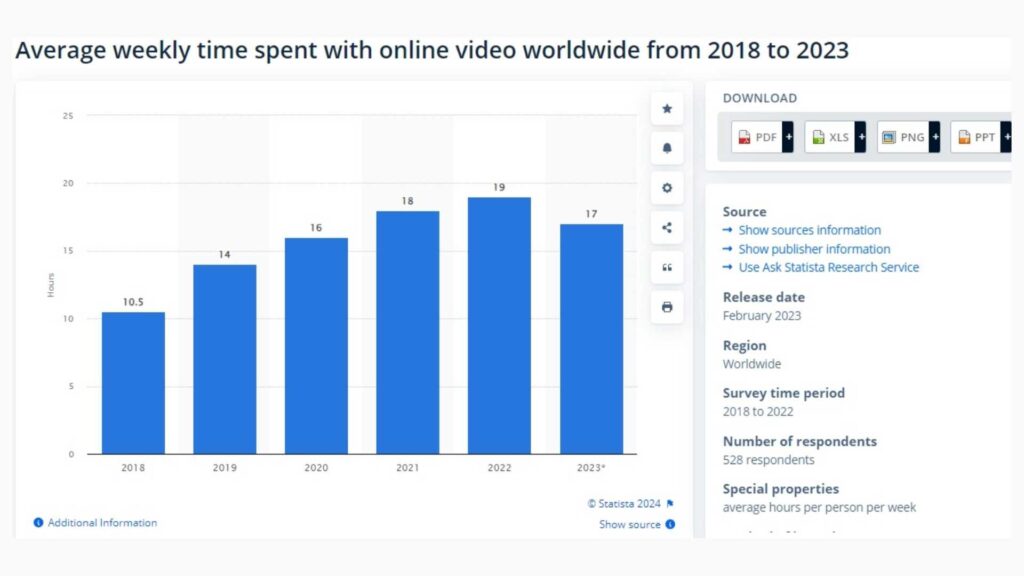

Both short-form and long-form videos offer unique advantages and come with their set of challenges. Join me as I uncover the benefits and limitations of each video format to help you make informed marketing decisions.
What are Short-Form Videos?
Short videos typically range from 30 seconds to less than 10 minutes long. They are popular on social media platforms like TikTok, Instagram, Snapchat, and YouTube.
Short-form videos deliver brief yet engaging messages that quickly capture the viewer’s attention. Here are some popular types of short-form video content.
- TikTok Challenges
- Instagram Reels
- Snapchat Stories
- YouTube Shorts
- Twitter Video Ads
Benefits of Short-Form Videos
A previously cited report shows that 39% of marketers find short-form videos, ranging from 30-60 seconds long, more successful. The same study reports that 44% of customers prefer watching a short video to learn about a brand’s offerings.
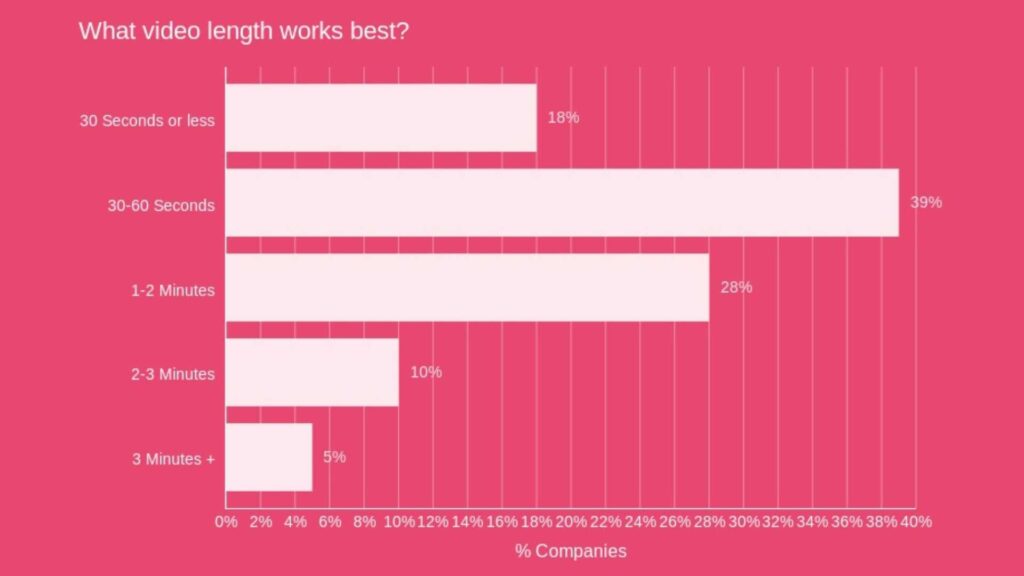

So, it is evident that short-form videos have their benefits. Let’s take a closer look at some of them.
Attention-Grabbing
Short-form videos capture attention quickly, making them ideal for the fast-scrolling nature of social media platforms. Your audience is more likely to watch them in their entirety compared to longer content.
Cost-Effective Production
Creating short-form videos requires less time and resources compared to longer videos. As a small business owner with a limited budget, using short-form videos can be cost-effective.
Increased Engagement
Short-form videos engage viewers due to their crisp and concise nature. This results in more likes, comments, and shares that boost your content’s visibility and increase brand awareness.
Integrating short-form videos into your influencer marketing campaigns can further amplify your reach to new and diverse audiences.
Highly Shareable
Short videos are highly shareable. This makes it more likely for your viewers to share them, increasing their virality.


Want to get certified in Content Marketing?
Leverage the tools and channels to predictably and profitably drive awareness, leads, sales, and referrals—EVERYTHING you need to know to become a true master of digital marketing. Click Here
There are multiple benefits of adding video to your website including increased engagement, improved SEO, and enhanced user experience.
Limitations of Short-Form Videos
While short-form videos offer many advantages in content marketing, they also present some challenges.
Limited Message Depth
Due to their brief duration, short-form videos may struggle to convey complex or detailed messages. Longer videos might be more suitable if you need to communicate intricate information.
Competition for Attention
Standing out on platforms flooded with short-form video content can be challenging. You must create content that stands out to avoid becoming lost in the sea of other videos.
Shorter Lifespan
Short videos may lose their relevance with time. They can quickly get buried in users’ feeds, leading to a shorter visibility and engagement period than longer, evergreen content.
This means you must consistently create short-form videos to maintain audience interest over time.
Limited SEO Impact
Short-form videos may be more challenging to optimize for search engines than longer, more keyword-rich content. This can affect the discoverability of your content outside the social media scene.
What are Long-Form Videos?
Long-form videos are typically longer, ranging from a few minutes to several hours. They extend beyond a few minutes to several hours, providing ample time for in-depth topic exploration and detailed content.
These videos are particularly suitable for educational content, product demonstrations, and narrative-driven storytelling. Long-form videos are common on platforms like YouTube and Vimeo. Common types of long-form video content include:
- YouTube Series
- Webinars
- Educational Tutorials and Courses:
- Behind-the-Scenes Content
- Interviews and Conversations
Advantages of Long-Form Videos
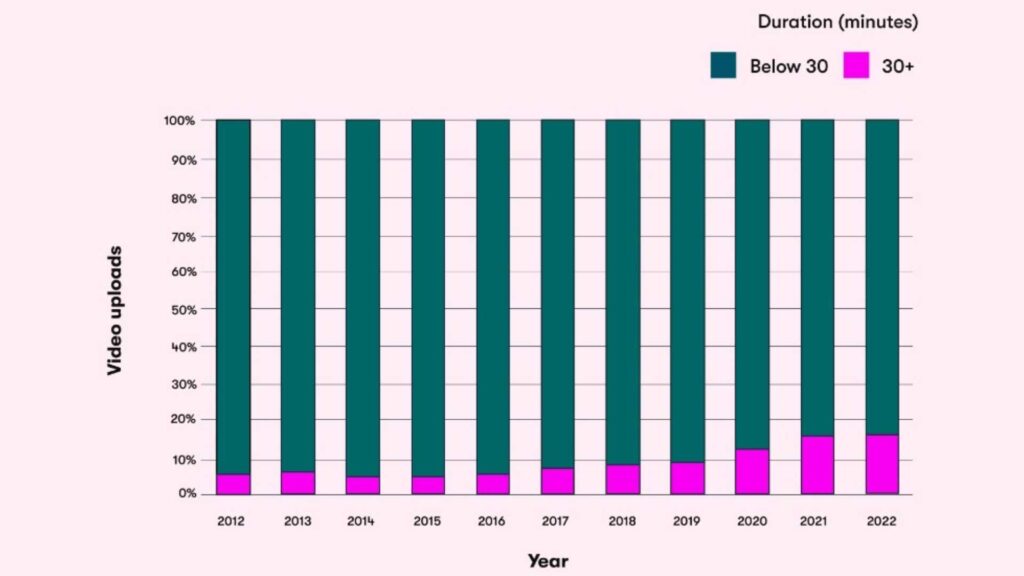
Long-form video content is the fastest-growing segment, with videos above 30 minutes experiencing tremendous growth over the years. Let’s explore some of the benefits behind this growth.

Establishes Expertise and Credibility
Long-form videos allow you to provide in-depth information about various subjects, establishing your brand as an authority. Potential customers will likely trust and rely on your insights when you consistently deliver valuable content.
Builds Strong Audience Connections
The more your audience watches your videos, the more they become familiar with your content and brand. This consistent engagement promotes trust and loyalty, helping you create deeper connections with your audience.
Provide SEO Optimization Opportunities
Long-form videos keep your audience engaged for a longer duration than short ones. This signals search engines that your content provides value, resulting in higher rankings and increased visibility.
Besides, these videos provide opportunities to optimize for relevant keywords. This Attrock guide offers more insights into the value of SEO for your small business.
They Are Sustainable
Unlike short videos, well-produced and valuable long-form videos have an extended shelf life. They can continue to attract views and engagement over an extended period, contributing to a sustainable content strategy.
Instagram reels are also a part of short videos and you can get benefits from this platform by integrating it with your website. You can learn how to embed Instagram Reels on websites and get extra benefits from your Reels.
Drawbacks of Long-Form Videos
Despite their benefits, long-form videos also have certain limitations, including:
Attention Span Challenges
Between distractions, juggling tasks, and information overload, user attention span quickly diminishes. Viewers may lose interest and disengage from your long video before its conclusion.


Are You Ready to Master Social Media?
Become a Certified Social Media Specialist and learn the newest strategies (by social platform) to draw organic traffic to your social media sites.
Complex Production Process
Creating high-quality long-form videos requires more resources, including time, equipment, and skilled personnel. This can be disadvantageous, especially for small businesses with limited budgets.
Platform Limitations
Some social media platforms and video hosting sites may limit video length, making it challenging to distribute long-form video content. You may then be forced to repurpose your content to suit various platforms.
Short-Form or Long-Form Videos: Which Are Better?
Now that you know the benefits and limitations of each format, which one should you choose? Short-form or long-form videos?
Well, it all boils down to considering several factors, such as:
Content Objectives
What do you want to achieve from your video marketing campaign? Short-form videos are highly effective for quick brand exposure and generating buzz. Long-form videos, on the other hand, contribute to a more in-depth understanding of the brand.
Target Audience Preferences
Audiences with short attention spans likely prefer short-form videos, while long-form videos appeal to those seeking a more immersive experience.
Similarly, short-form videos may appeal more to younger audiences, while older demographics may prefer the depth of long-form content.
Platform Dynamics
Various platforms support different content formats. Short-form videos are well-suited for platforms like TikTok, Instagram, and Snapchat. On the other hand, platforms like YouTube and Vimeo are better for hosting longer videos.
Industry Type
Short-form videos would be ideal if your industry thrives on trends, entertainment, and quick messages. However, long-form videos are effective for industries requiring in-depth explanations or educational content.
Bottom Line
Ultimately, choosing short-form or long-form videos depends on your business’s specific needs and goals. Since both formats have advantages and limitations, making a choice may prove difficult.
However, it doesn’t have to be an uphill task. The key lies in recognizing when to incorporate each video format into your marketing strategy. Understanding your audience and its needs allows you to combine both formats strategically, maximizing the benefits of each.
Continuously analyze performance metrics and adapt your video marketing strategy accordingly to ensure optimal engagement and conversion rates.
MARKETING
The Current State of Google’s Search Generative Experience [What It Means for SEO in 2024]
![The Current State of Google’s Search Generative Experience [What It Means for SEO in 2024] person typing on laptop with](https://articles.entireweb.com/wp-content/uploads/2024/04/The-Current-State-of-Googles-Search-Generative-Experience-What-It.webp.webp)
SEO enthusiasts, known for naming algorithm updates after animals and embracing melodrama, find themselves in a landscape where the “adapt or die” mantra prevails. So when Google announced the launch of its Search Generative Experience (SGE) in May of 2023 at Google/IO, you can imagine the reaction was immense.
Although SGE has the potential to be a truly transformative force in the landscape, we’re still waiting for SGE to move out of the Google Labs Sandbox and integrate into standard search results.
Curious about our current take on SGE and its potential impact on SEO in the future? Read on for more.
Decoding Google’s Defensive Move
In response to potential threats from competitors like ChatGPT, Bing, TikTok, Reddit, and Amazon, Google introduced SGE as a defensive maneuver. However, its initial beta release raised questions about its readiness and global deployment.
ChatGPT provided an existential threat that had the potential to eat into Google’s market share. When Bing started incorporating it into its search results, it was one of the most significant wins for Bing in a decade. In combination with threats from TikTok, Reddit, and Amazon, we see a more fractured search landscape less dominated by Google. Upon its launch, the expectation was that Google would push its SGE solution globally, impact most queries, and massively shake up organic search results and strategies to improve organic visibility.
Now, industry leaders are starting to question if Google is better off leaving SGE in the testing ground in Google labs. According to Google’s recent update, it appears that SGE will remain an opt-in experience in Google Labs (for at least the short term). If SGE was released, there could be a fundamental reset in understanding SEO. Everything from organic traffic to optimization tactics to tracking tools would need adjustments for the new experience. Therefore, the prospect of SGE staying in Google Labs is comforting if not entirely reliable.
The ever-present option is that Google can change its mind at any point and push SGE out broadly as part of its standard search experience. For this reason, we see value in learning from our observations with SGE and continuing to stay on top of the experience.
SGE User Experience and Operational Challenges
If you’ve signed up for search labs and have been experimenting with SGE for a while, you know firsthand there are various issues that Google should address before rolling it out broadly to the public.
At a high level, these issues fall into two broad categories including user experience issues and operational issues.
Below are some significant issues we’ve come across, with Google making notable progress in addressing certain ones, while others still require improvement:
- Load time – Too many AI-generated answers take longer to load than a user is willing to wait. Google recommends less than a 3-second load time to meet expectations. They’ll need to figure out how to consistently return results quickly if they want to see a higher adoption rate.
- Layout – The SGE layout is massive. We believe any major rollout will be more streamlined to make it a less intrusive experience for users and allow more visibility for ads, and if we’re lucky, organic results. Unfortunately, there is still a decent chance that organic results will move below the fold, especially on mobile devices. Recently, Google has incorporated more results where users are prompted to generate the AI result if they’d like to see it. The hope is Google makes this the default in the event of a broad rollout where users can generate an AI result if they want one instead of assuming that’s what a user would like to see.
- Redundancy – The AI result duplicates features from the map pack and quick answer results.
- Attribution – Due to user feedback, Google includes sources on several of their AI-powered overviews where you can see relevant web pages if there is an arrow next to the result. Currently, the best way to appear as one of these relevant pages is to be one of the top-ranked results, which is convenient from an optimization standpoint. Changes to how attribution and sourcing are handled could heavily impact organic strategies.
On the operational side, Google also faces significant hurdles to making SGE a viable product for its traditional search product. The biggest obstacle appears to be making the cost associated with the technology worth the business outcomes it provides. If this was a necessary investment to maintain market share, Google might be willing to eat the cost, but if their current position is relatively stable, Google doesn’t have much of an incentive to take on the additional cost burden of heavily leveraging generative AI while also presumably taking a hit to their ad revenue. Especially since slow user adoption doesn’t indicate this is something users are demanding at the moment.
While the current experience of SGE is including ads above the generative results now, the earliest iterations didn’t heavily feature sponsored ads. While they are now included, the current SGE layout would still significantly disrupt the ad experience we’re used to. During the Google I/O announcement, they made a statement to reassure advertisers they would be mindful of maintaining a distinct ad experience in search.
“In this new generative experience, Search ads will continue to appear in dedicated ad slots throughout the page. And we’ll continue to uphold our commitment to ads transparency and making sure ads are distinguishable from organic search results” – Elizabeth Reid, VP, Search at Google
Google is trying to thread a delicate needle here of staying on the cutting edge with their search features, while trying not to upset their advertisers and needlessly hinder their own revenue stream. Roger Montti details more of the operational issues in a recent article digging into the surprising reasons SGE is stuck in Google Labs.
He lists three big problems that need to be solved before SGE will be integrated into the foreground of search:
- Large Language Models being inadequate as an information retrieval system
- The inefficiency and cost of transformer architecture
- Hallucinating (providing inaccurate answers)
Until SGE provides more user value and checks more boxes on the business sense side, the traditional search experience is here to stay. Unfortunately, we don’t know when or if Google will ever feel confident they’ve addressed all of these concerns, so we’ll need to stay prepared for change.
Experts Chime in on Search Generative Experience
Our team has been actively engaging with SGE, here’s a closer look at their thoughts and opinions on the experience so far:
“With SGE still in its early stages, I’ve noticed consistent changes in how the generative results are produced and weaved naturally into the SERPs. Because of this, I feel it is imperative to stay on top of these on-going changes to ensure we can continue to educate our clients on what to expect when SGE is officially incorporated into our everyday lives. Although an official launch date is currently unknown, I believe proactively testing various prompt types and recording our learnings is important to prepare our clients for this next evolution of Google search.”
– Jon Pagano, SEO Sr. Specialist at Tinuiti
“It’s been exciting to watch SGE grow through different variations over the last year, but like other AI solutions its potential still outweighs its functionality and usefulness. What’s interesting to see is that SGE doesn’t just cite its sources of information, but also provides an enhanced preview of each webpage referenced. This presents a unique organic opportunity where previously untouchable top 10 rankings are far more accessible to the average website. Time will tell what the top ranking factors for SGE are, but verifiable content with strong E-E-A-T signals will be imperative.”
–Kate Fischer, SEO Specialist at Tinuiti
“Traditionally, AI tools were very good at analytical tasks. With the rise of ChatGPT, users can have long-form, multi-question conversations not yet available in search results. When, not if, released, Google’s Generative Experience will transform how we view AI and search. Because there are so many unknowns, some of the most impactful ways we prepare our clients are to discover and develop SEO strategies that AI tools can’t directly disrupt, like mid to low funnel content.”
– Brandon Miller, SEO Specialist at Tinuiti
“SGE is going to make a huge impact on the ecommerce industry by changing the way users interact with the search results. Improved shopping experience will allow users to compare products, price match, and read reviews in order to make it quicker and easier for a user to find the best deals and purchase. Although this leads to more competitive results, it also improves organic visibility and expands our product reach. It is more important than ever to ensure all elements of a page are uniquely and specifically optimized for search. With the SGE updates expected to continue to impact search results, the best way to stay ahead is by focusing on strong user focused content and detailed product page optimizations.”
– Kellie Daley, SEO Sr. Specialist at Tinuiti
Navigating the Clash of Trends
One of the most interesting aspects of the generative AI trend in search is that it appears to be in direct opposition to other recent trends.
One of the ways Google has historically evaluated the efficacy of its search ranking systems is through the manual review of quality raters. In their quality rater guidelines, raters were instructed to review for things like expertise, authority, and trustworthiness (EAT) in results to determine if Google results are providing users the information they deserve.
In 2022, Google updated their search guidelines to include another ‘e’ in the form of experience (EEAT). In their words, Google wanted to better assess if the content a user was consuming was created by someone with, “a degree of experience, such as with actual use of a product, having actually visited a place or communicating what a person has experienced. There are some situations where really what you value most is content produced by someone who has firsthand, life experience on the topic at hand.”
Generative AI results, while cutting-edge technology and wildly impressive in some cases, stand in direct opposition to the principles of E-E-A-T. That’s not to say that there’s no room for both in search, but Google will have to determine what it thinks users value more between these competing trends. The slow adoption of SGE could be an indication that a preference for human experience, expertise, authority, and trust is winning round one in this fight.
Along these lines, Google is also diversifying its search results to cater to the format in which users get their information. This takes the form of their Perspectives Filter. Also announced at Google I/O 2023, the perspectives filter incorporates more video, image, and discussion board posts from places like TikTok, YouTube, Reddit, and Quora. Once again, this trend shows the emphasis and value searchers place on experience and perspective. Users value individual experience over the impersonal conveyance of information. AI will never have these two things, even if it can provide a convincing imitation.
The current iteration of SGE seems to go too far in dismissing these trends in favor of generative AI. It’s an interesting challenge Google faces. If they don’t determine the prevailing trend correctly, veering too far in one direction can push more market share to ChatGPT or platforms like YouTube and TikTok.
Final Thoughts
The range of outcomes remains broad and fascinating for SGE. We can see this developing in different ways, and prognostication offers little value, but it’s invaluable to know the potential outcomes and prepare for as many of them as possible.
It’s critical that you or your search agency be interacting and experimenting with SGE because:
- The format and results will most likely continue to see significant changes
- This space moves quickly and it’s easy to fall behind
- Google may fix all of the issues with SGE and decide to push it live, changing the landscape of search overnight
- SGE experiments could inform other AI elements incorporated into the search experience
Ultimately, optimizing for the specific SGE experience we see now is less important because we know it will inevitably continue changing. We see more value in recognizing the trends and problems Google is trying to solve with this technology. With how quickly this space moves, any specifics mentioned in this article could be outdated in a week. That’s why focusing on intention and process is important at this stage of the game.
By understanding the future needs and wants SGE is attempting to address, we can help you future-proof your search strategies as much as possible. To some extent we’re always at the whims of the algorithm, but by maintaining a user-centric approach, you can make your customers happy, regardless of how they find you.
MARKETING
How to create editorial guidelines that are useful + template

Before diving in to all things editorial guidelines, a quick introduction. I head up the content team here at Optimizely. I’m responsible for developing our content strategy and ensuring this aligns to our key business goals.
Here I’ll take you through the process we used to create new editorial guidelines; things that worked well and tackle some of the challenges that come with any good multi – stakeholder project, share some examples and leave you with a template you can use to set your own content standards.
What are editorial guidelines?
Editorial guidelines are a set of standards for any/all content contributors, etc. etc. This most often includes guidance on brand, tone of voice, grammar and style, your core content principles and the types of content you want to produce.
Editorial guidelines are a core component of any good content strategy and can help marketers achieve the following in their content creation process:
- Consistency: All content produced, regardless of who is creating it, maintains a consistent tone of voice and style, helping strengthen brand image and making it easier for your audience to recognize your company’s content
- Quality Control: Serves as a ‘North Star’ for content quality, drawing a line in the sand to communicate the standard of content we want to produce
- Boosts SEO efforts: Ensures content creation aligns with SEO efforts, improving company visibility and increasing traffic
- Efficiency: With clear guidelines in place, content creators – external and internal – can work more efficiently as they have a clear understanding of what is expected of them
Examples of editorial guidelines
There are some great examples of editorial guidelines out there to help you get started.
Here are a few I used:
1. Editorial Values and Standards, the BBC
Ah, the Beeb. This really helped me channel my inner journalist and learn from the folks that built the foundation for free quality journalism.
How to create editorial guidelines, Pepperland Marketing
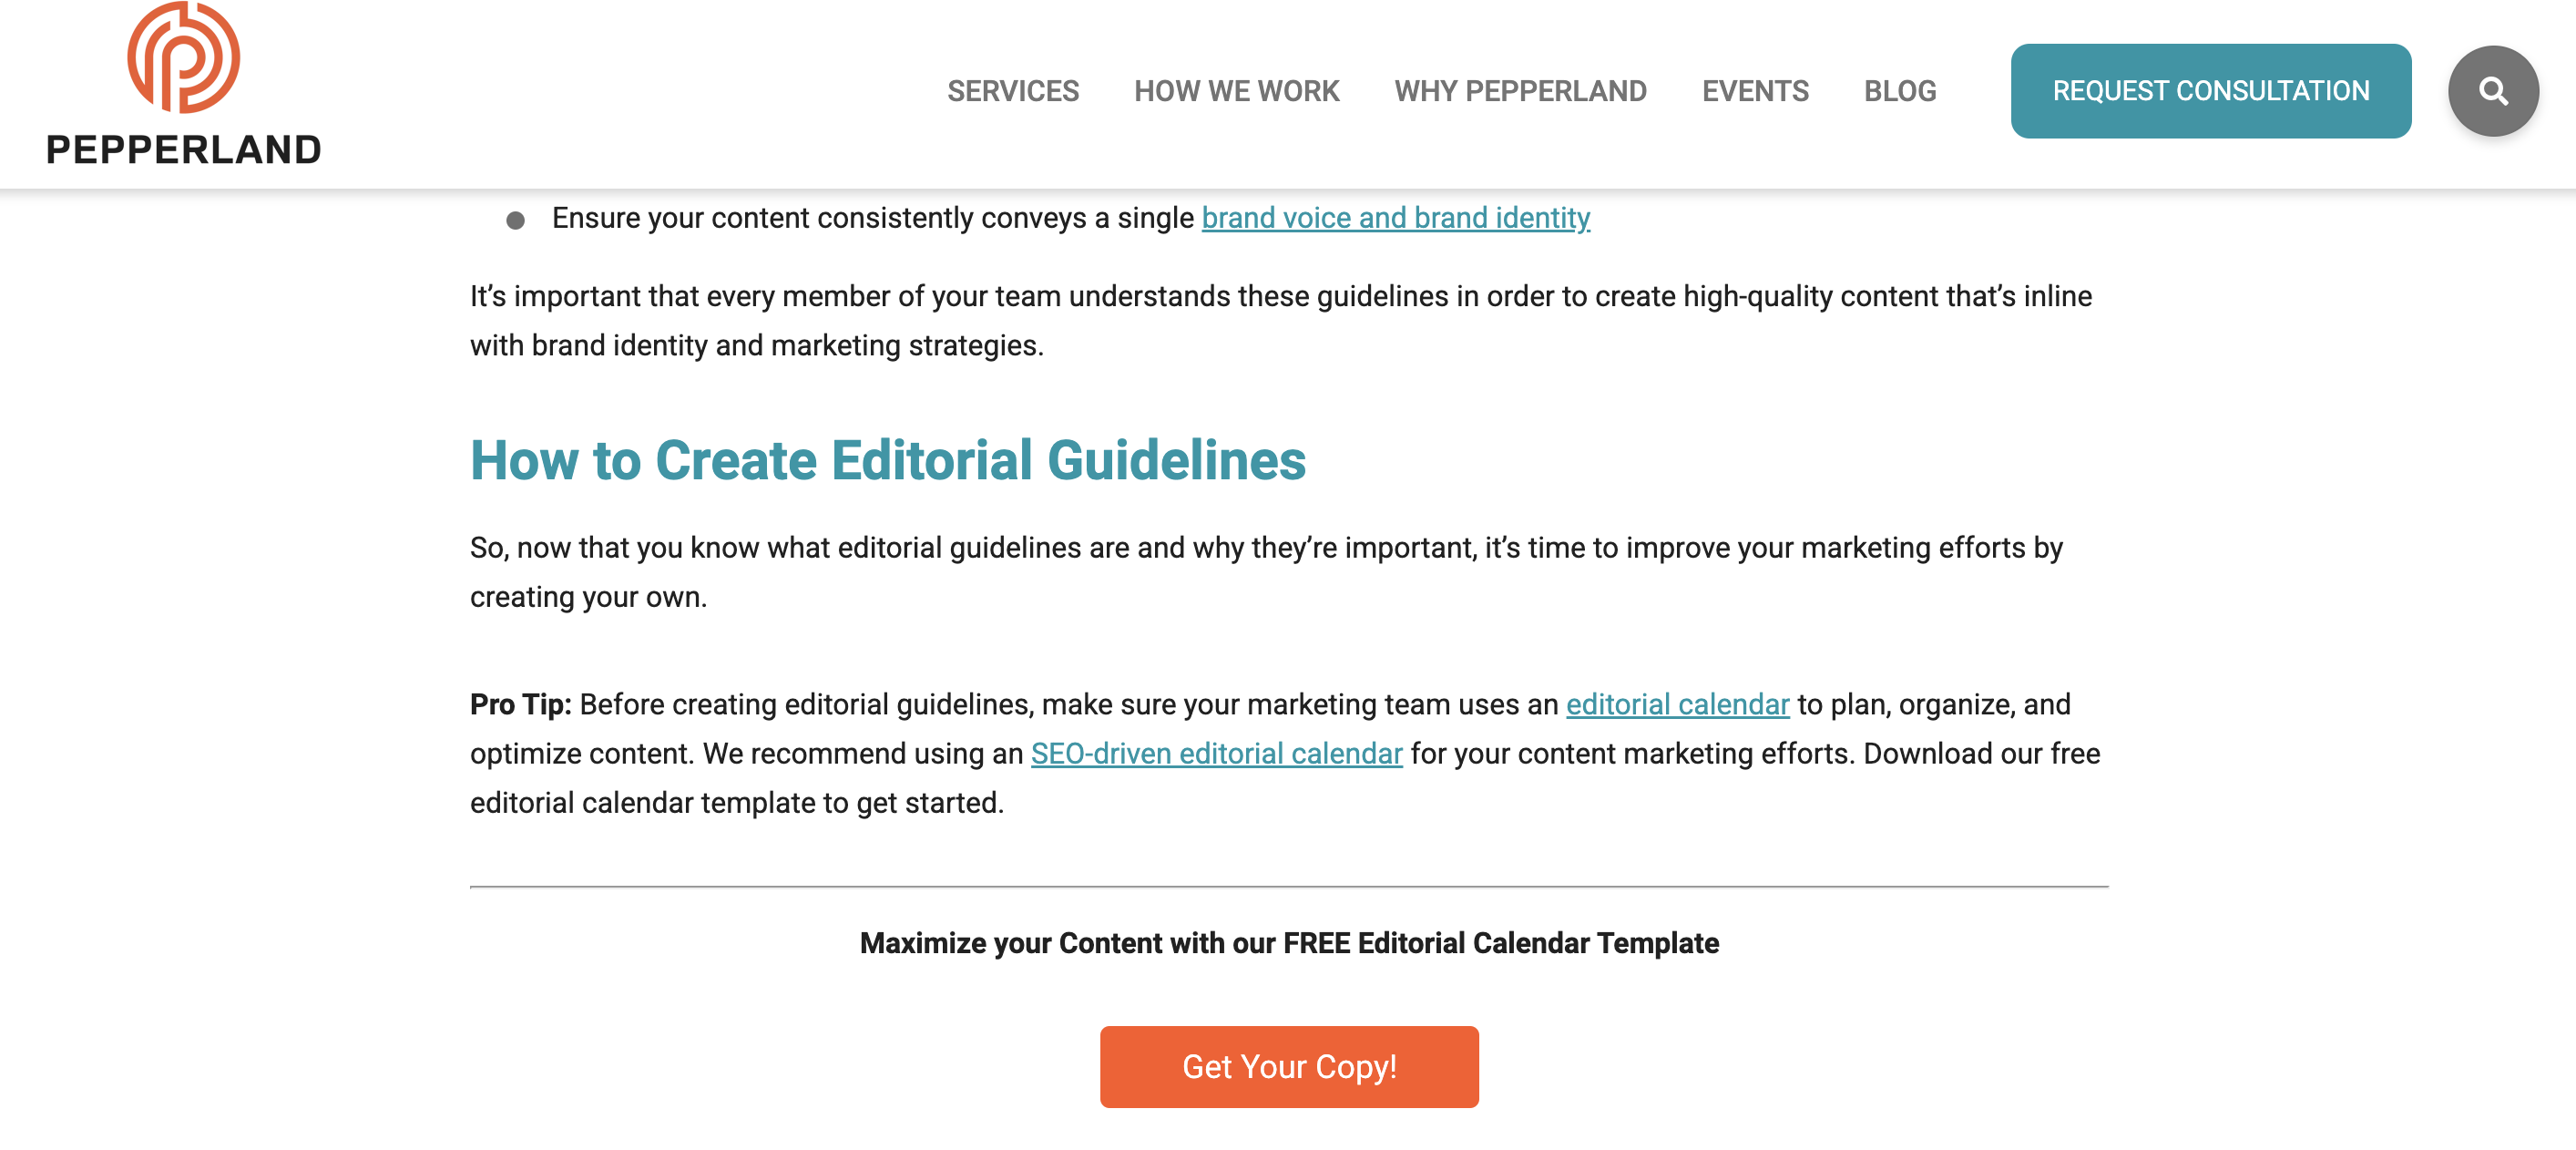
After taking a more big picture view I recognized needed more focused guidance on the step by step of creating editorial guidelines.
I really liked the content the good folks at Pepperland Marketing have created, including a free template – thanks guys! – and in part what inspired me to create our own free template as a way of sharing learnings and helping others quickstart the process of creating their own guidelines.
3. Writing guidelines for the role of AI in your newsroom?… Nieman Lab

As well as provide guidance on content quality and the content creation process, I wanted to tackle the thorny topic of AI in our editorial guidelines. Specifically, to give content creators a steer on ‘fair’ use of AI when creating content, to ensure creators get to benefit from the amazing power of these tools, but also that content is not created 100% by AI and help them understand why we feel that contravenes our core content principles of content quality.
So, to learn more I devoured this fascinating article, sourcing guidance from major media outlets around the world. I know things change very quickly when it comes to AI, but I highly encourage reading this and taking inspiration from how these media outlets are tackling this topic.
Learn more: The Marketer’s Guide to AI-generated content
Why did we decide to create editorial guidelines?
1. Aligning content creators to a clear vision and process
Optimizely as a business has undergone a huge transformation over the last 3 years, going through rapid acquisition and all the joys and frustrations that can bring. As a content team, we quickly recognized the need to create a set of clear and engaging guidelines that helps content creators understand how and where they can contribute, and gave a clear process to follow when submitting a content idea for consideration.
2. Reinvigorated approach to brand and content
As a brand Optimizely is also going through a brand evolution – moving from a more formal, considered tone of voice to one that’s much more approachable, down to earth and not afraid to use humor, different in content and execution.
See, our latest CMS campaign creative:
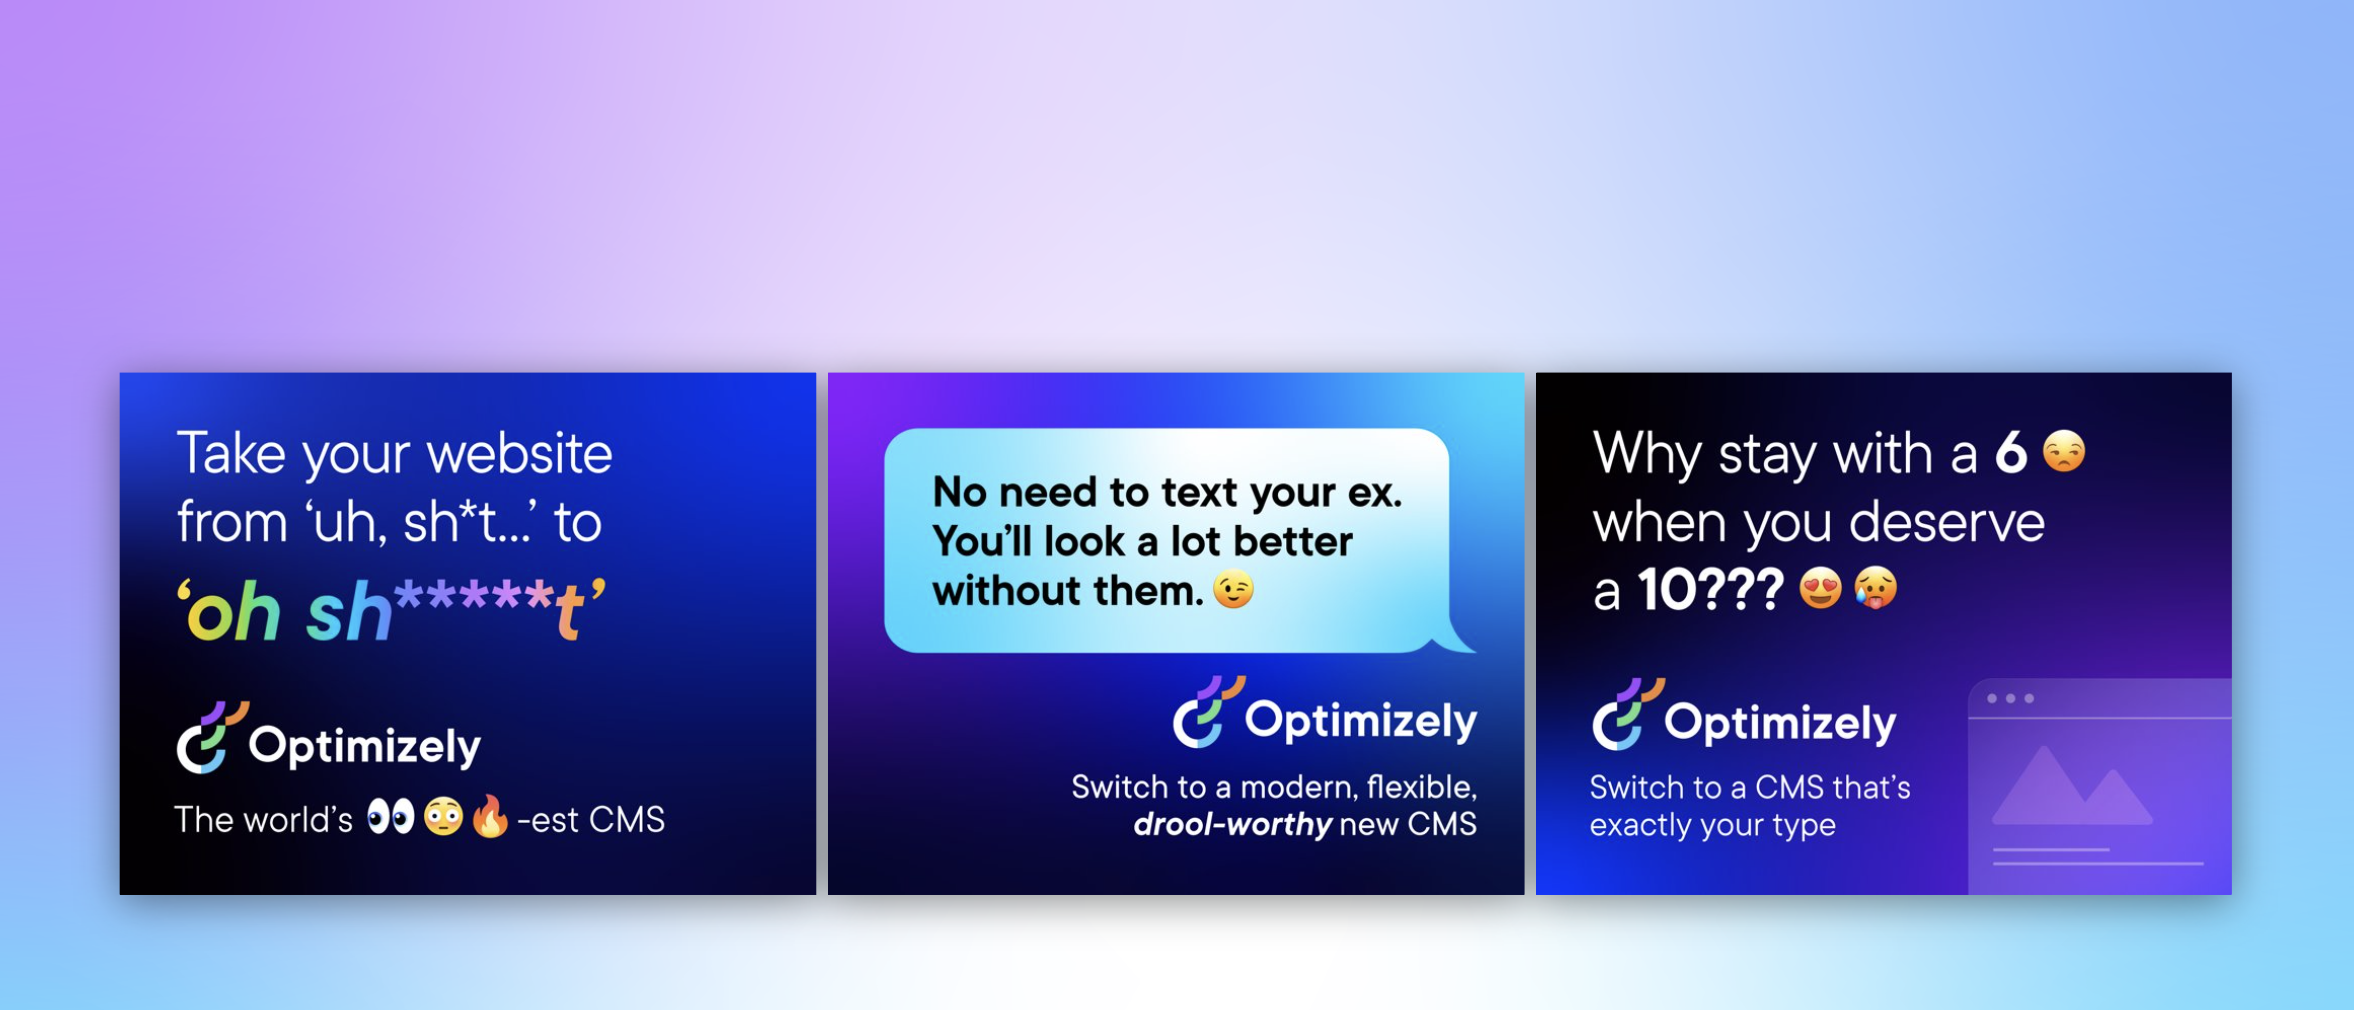
It’s pretty out there in terms of creative and messaging. It’s an ad campaign that’s designed to capture attention yes, but also – to demonstrate our abilities as a marketing team to create this type of campaign that is normally reserved for other more quote unquote creative industries.
We wanted to give guidance to fellow content creators outside the team on how they can also create content that embraces this evolved tone of voice, while at the same time ensuring content adheres to our brand guidelines.
3. Streamline content creation process
Like many global enterprises we have many different content creators, working across different time zones and locations. Documenting a set of guidelines and making them easily available helps content creators quickly understand our content goals, the types of content we want to create and why. It would free up content team time spent with individual contributors reviewing and editing submissions, and would ensure creation and optimization aligns to broader content & business goals.
It was also clear that we needed to document a process for submitting content ideas, so we made sure to include this in the guidelines themselves to make it easy and accessible for all contributors.
4. 2023 retrospective priority
As a content team we regularly review our content strategy and processes to ensure we’re operating as efficiently as possible.
In our last retrospective. I asked my team ‘what was the one thing I could do as a manager to help them be more impactful in their role?’
Editorial guidelines was the number 1 item on their list.
So off we went…
What we did
- Defined a discrete scope of work for the first version of the editorial guidelines, focusing on the Blog and Resources section of the website. This is where the content team spends most of its time and so has most involvement in the content creation process. Also where the most challenging bottlenecks have been in the past
- Research. Reviewed what was out there, got my hands on a few free templates and assembled a framework to create a first version for inputs and feedback
- Asked content community – I put a few questions out to my network on LinkedIn on the topic of content guidelines and content strategy, seeking to get input and guidance from smart marketers.

- Invited feedback: Over the course of a few weekswe invited collaborators to comment in a shared doc as a way of taking iterative feedback, getting ideas for the next scope of work, and also – bringing people on the journey of creating the guidelines. Look at all those reviewers! Doing this within our Content Marketing Platform (CMP) ensured that all that feedback was captured in one place, and that we could manage the process clearly, step by step:
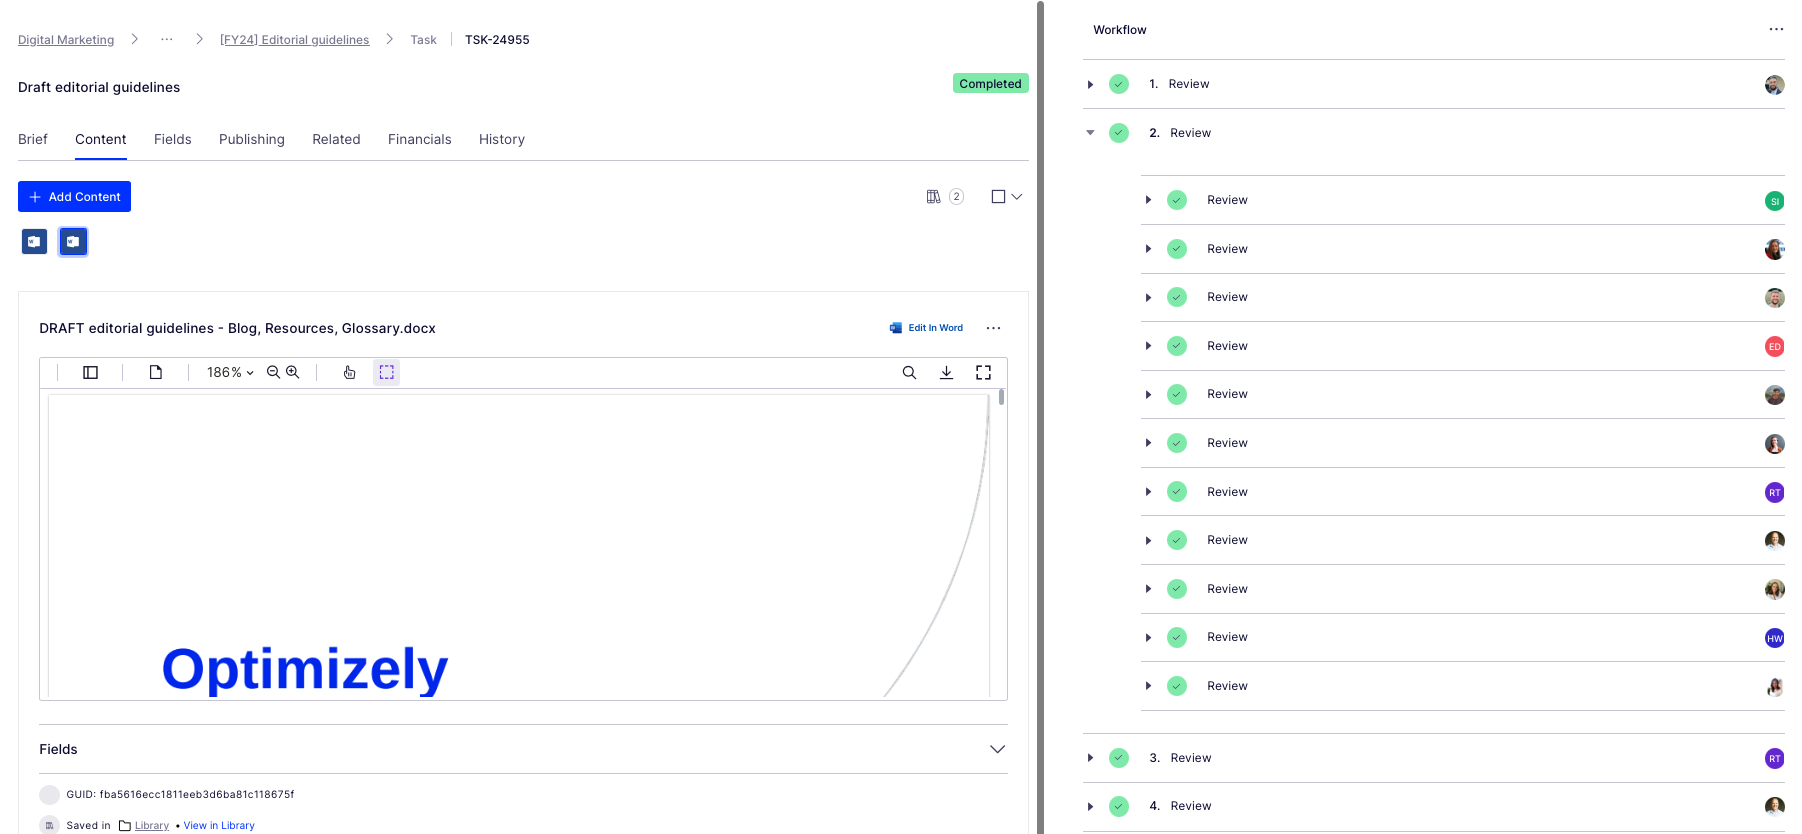
Look at all those collaborators! Thanks guys! And all of those beautiful ticks, so satisfying. So glad I could crop out the total outstanding tasks for this screen grab too (Source – Optimizely CMP)
- Updated content workflow: Now we have clear, documented guidance in place, we’ve included this as a step – the first step – in the workflow used for blog post creation:

Source: Optimizely CMP
Results
It’s early days but we’re already seeing more engagement with the content creation process, especially amongst the teams involved in building the guidelines (which was part of the rationale in the first place :))

Source: My Teams chat
It’s inspired teams to think differently about the types of content we want to produce going forwards – for the blog and beyond.
I’d also say it’s boosted team morale and collaboration, helping different teams work together on shared goals to produce better quality work.
What’s next?
We’re busy planning wider communication of the editorial guidelines beyond marketing. We’ve kept the original draft and regularly share this with existing and potential collaborators for ongoing commentary, ideas and feedback.
Creating guidelines has also sparked discussion about the types of briefs and templates we want and need to create in CMP to support creating different assets. Finding the right balance between creative approach and using templates to scale content production is key.
We’ll review these guidelines on a quarterly basis and evolve as needed, adding new formats and channels as we go.
Key takeaways
- Editorial guidelines are a useful way to guide content creators as part of your overall content strategy
- Taking the time to do research upfront can help accelerate seemingly complex projects. Don’t be afraid to ask your community for inputs and advice as you create
- Keep the scope small at first rather than trying to align everything all at once. Test and learn as you go
- Work with stakeholders to build guidelines from the ground up to ensure you create a framework that is useful, relevant and used
And lastly, here’s that free template we created to help you build or evolve your own editorial guidelines!
-

 WORDPRESS7 days ago
13 Best HubSpot Alternatives for 2024 (Free + Paid)
-

 MARKETING7 days ago
Advertising in local markets: A playbook for success
-

 SEARCHENGINES7 days ago
Google Core Update Flux, AdSense Ad Intent, California Link Tax & More
-

 SEO5 days ago
How to Become an SEO Lead (10 Tips That Advanced My Career)
-

 SEARCHENGINES5 days ago
Google Needs Very Few Links To Rank Pages; Links Are Less Important
-

 MARKETING6 days ago
How to Use AI For a More Effective Social Media Strategy, According to Ross Simmonds
-

 PPC4 days ago
10 Most Effective Franchise Marketing Strategies
-

 PPC5 days ago
Biggest Trends, Challenges, & Strategies for Success


![How to Calculate Your Lead Generation Goals [Free Calculator] HubSpot's Lead Goal Calculator](https://articles.entireweb.com/wp-content/uploads/2022/06/1655491903_799_How-to-Calculate-Your-Lead-Generation-Goals-Free-Calculator.png)
![How to Calculate Your Lead Generation Goals [Free Calculator] Lead Goal Calculator Example: Leads from Social](https://articles.entireweb.com/wp-content/uploads/2022/06/1655491903_151_How-to-Calculate-Your-Lead-Generation-Goals-Free-Calculator.png)
![How to Calculate Your Lead Generation Goals [Free Calculator] Lead Goal Calculator Example: Leads from Website](https://articles.entireweb.com/wp-content/uploads/2022/06/1655491904_686_How-to-Calculate-Your-Lead-Generation-Goals-Free-Calculator.png)
![How to Calculate Your Lead Generation Goals [Free Calculator] Lead Goal Calculator Example: Leads from Email](https://articles.entireweb.com/wp-content/uploads/2022/06/1655491904_662_How-to-Calculate-Your-Lead-Generation-Goals-Free-Calculator.png)
![How to Calculate Your Lead Generation Goals [Free Calculator] Improve your website with effective technical SEO. Start by conducting this audit.](https://articles.entireweb.com/wp-content/uploads/2022/06/1655491904_326_How-to-Calculate-Your-Lead-Generation-Goals-Free-Calculator.png)


You must be logged in to post a comment Login