SEO
Marketing Analytics: The Simple Guide

Marketing analytics is the measurement and analysis of marketing data to seek patterns and insights that can improve marketing performance.
If you’re doing digital marketing, you’re swimming in a vast pool of actionable data. But if you’re not using tools and techniques to discover, analyze, and interpret this data, then you’re swimming with your eyes closed.
To help you learn what marketing analytics can do, we’ll cover the following:
First, marketing analytics can answer questions vital to any business, no matter the size. Here are a few common questions: How are our campaigns performing? Are we spending money on the right marketing channels? How do we compare to our competitors?
Knowing those things is great, but it gets even better. Measuring marketing performance opens the door to improving it. For instance, if you notice your PPC campaigns on Facebook are starting to bring less traffic, you can do something about it. You can try improving the ads or even moving your marketing budget elsewhere and then comparing results.
Or maybe you’re in a situation where you need to set goals for yourself, your team, or your contractors. You can base those goals on an analysis of past performance and get a quantifiable reference point. How else will you know if, let’s say, increasing website traffic by 15% in one month is enough or even doable?
Finally, data can help you get your point across because numbers are persuasive. You can use real numbers from your past marketing efforts to prove that you’re positively impacting the business. Marketing analytics can also help make well-grounded predictions that you can use to fuel your marketing strategy, e.g., securing a higher budget for the next quarter.
Let’s take a look at some of the ways you can use marketing analytics for business growth.
Report on the past
The past is super important to marketers. It’s because the story with marketing usually goes like this: First, you use some marketing tactic. Then you give it some time to generate results. Finally, you check on those results.
On that note, marketing analytics will help you answer questions such as:
- How much organic traffic did our content generate last quarter?
- How many new leads did Campaign A generate compared to Campaign B?
- What was the conversion rate from trial sign-ups to paid subscriptions?
- What was the average cart abandonment rate last year?
The good news is that more often than not, marketing analytics software does the tracking and measuring of the most popular metrics automatically. But the important thing is to set up those tools as soon as possible to avoid data gaps.
Analyze the present
Marketing analytics can answer some more “timely” questions too, such as things related to patterns in customer behaviors, trends, current budget spending, etc. For example:
- Why is organic traffic to our blog decreasing?
- What percentage of our customers use the [feature] of our product?
- What is the lifetime value of our customers?
- What is our current ranking for [query] in Google?
And when you’ve got insights into your past performance and present state of affairs, you’re all set to take on a task that marketers are asked to do (but few can deliver) all the time: predict the future.
Predict the future
Enter predictive analytics or, in other words, making data-driven assumptions about what can happen in the future. Predicting the future is why marketers are not simply reporting for reporting’s sake.
For example, if a marketer is able to prove a positive return on investment of a given marketing tactic based on past performance, they can forecast the future performance quite accurately. Often, this is enough to get the marketing budget they need.
Here, we also enter the realm of prescriptive analytics, the type of analytics that answers the question, “What should be done?” For example:
- Which type of page layout should we use? You can use an A/B testing software to test your options.
- What type of message should we send to a prospect to increase our chances of converting them? Marketers can build models of optimal conversion paths and then test them by setting up automated email workflows.
- What keywords should we target in our content? SEOs and content marketers do keyword research for that.
Compare with competitors
Marketing analytics can help you turn your competitors into allies (almost). Thanks to data from various competitive analysis methods, it’s possible to learn from someone’s mistakes or emulate someone’s success.
For example, to identify gaps in your content, you can run a content gap analysis using Ahrefs in just a few clicks and see what keywords your competitors rank for that you don’t.

Whether you want to perform ad hoc analytics or develop a set of metrics that will appear in recurring reports, this simple four-step process will help you focus on what’s most important.
1. Identify what you want to measure
As you can see in the paragraphs above, there are a lot of different things that marketing analytics software can track and measure for you. But this creates a temptation to just dive in and look for any kind of insight.
While you may find some this way, it’s more effective to determine what you’ll be looking for first and leave less to chance. In other words, if your analytics tool were a person, what questions would you like them to answer?
For example, let’s say you’re investing heavily in creating content designed to rank on Google Search. Since your competitors are doing the same thing, you’ll want to know this: How visible is my content on the SERPs compared to them? This is a metric known as the share of voice (SOV).
So now that we have our sample research question in place, we can move on to the next step.
2. Assess your capabilities
There are two questions to ask here:
- Do you have access to quality data?
- Do you have the skill to extract and process the data?
And there is no other way to answer these than to learn more about your research question.
This step may sound trivial, but it’s actually a critical one. Because if you dive headfirst into an analytics problem that is best left to someone else (e.g., a data scientist or an external consultant), chances are you will just waste time instead of better spending it on something else.
And this is a common problem among marketing teams. A study revealed that only 1.9% of marketing leaders reported their companies have the right talent to leverage marketing analytics.
Whatever your research question may be, just try Googling it first. It’s likely someone has already created a product or service to solve your problem. For instance, a basic query like “share of voice” could lead you to our how-to article.

3. Gather data using marketing analytics tools
Continuing our example of calculating SOV, we learn (after doing some quick research online) that you can solve this problem without any special skills by using an SEO tool like Ahrefs. To illustrate, one of the methods consists of three steps:
- Set keywords you want to track and paste them into Ahrefs’ Rank Tracker
- Set competitors’ domains you want to match against
- Go to the Competitors report and see your data automatically calculated and visualized in the “Visibility” tab

The Visibility report shows what percentage of all clicks for the tracked keywords land on the target websites.
4. Draw conclusions
Rank Tracker’s Visibility report allows you to analyze the present by making comparisons to your competitors, and it even lets you report on the past SOV. You can do even more if you try to find the reasons behind those numbers and come up with some solutions for future improvements. This is even if you’re generally outperforming your competitors at the moment.
Right below the Visibility report, you can see a report of keyword positions in comparison to your competitors’. And if you sort the results by one of your competitors, you will see keywords for which they perform better than you.

That knowledge is a great starting point for pinpointing underperforming content and then using SEO tactics to improve rankings. Examples:
- Getting more backlinks
- Updating content
- Optimizing page speed
- Boosting pages with internal links
Basically, in our four-step process, we went from an idea on what to measure to finding exact areas of improvement in our marketing efforts. And that’s the heart of marketing analytics.
Data is at the core of Ahrefs’ marketing activities. And as with most SaaS companies, our martech stack consists of many different tools. Here are some that we use for marketing analytics.
1. Ahrefs
Ahrefs is our all-in-one SEO toolset that helps millions of marketers to optimize their content to rank higher and get more traffic from search engines. And since our core marketing tactic is content marketing, Ahrefs is a tool we can’t live without. We use it mainly for:
- Finding topics to write about.
- Studying how to structure our blog posts.
- Choosing which articles to update.
- Finding outreach prospects.
- Studying competitors.
- Monitoring our performance on search engines.
- Finding technical SEO issues.
To illustrate, let’s take a closer look at the first point from the above list.
We want to help people get better at SEO and marketing, so we create educational content. We study what people want to learn, the traffic potential of those topics, and how hard it would be to rank our content on Google to get that traffic.
Let’s look at an example. Here, we can see that if we write an article about B2B marketing, we will be looking at an estimated monthly organic traffic of 2K in the U.S. alone. We will also likely need links from about 81 websites to rank in the top 10 in that country. And just like that, we have found a data-driven premise to decide whether to target that keyword or not.

If you’re curious about the details of the keyword research process, check out the video below:
https://www.youtube.com/watch?v=OMJQPqG2Uas
2. Google Search Console
Google Search Console (GSC) is a free SEO tool designed for monitoring and troubleshooting websites’ appearances in search results.
Among many features, GSC shows the exact number of visits from Google’s SERPs to a website. Since only Google can do that with this accuracy (other tools use estimates), we use GSC to mainly monitor the exact amount of organic traffic coming from Google Search to our pages.
With this knowledge, we can improve pages that are decreasing in traffic or try to improve the CTRs of pages that are ranking high but don’t get clicked on as often as they should (in our opinion).

Thanks to data from GSC, we can easily identify pages with high keyword rankings but low CTRs. For example, an article targeting the keyword “diy seo” could probably do better based on its position.
3. Matomo
Matomo is a web analytics tool that is often regarded as the “ethical alternative” to Google Analytics, as it takes a more progressive stance toward data ownership and privacy. This is also one of the reasons we chose this tool.
Matomo has all the standard features you’ll expect to help you understand where users come from and how they interact with your website. Things like traffic sources, channel attributions, user flows, goal conversions, cohorts, etc. What’s more, it hosts some tools that you can’t find in other popular alternatives.
For example, we found Matomo to be helpful in an experiment where we compared different banner placements on our website. Instead of guessing the best placement, we appended tracking parameters to some links to see the click performance and decide where would make the most sense to keep the banner.

Is this a good spot to place this banner? We let our users decide.

Results of our quick experiment. Conclusion: turn off the banner on the worst-performing page.
Final thoughts
In this article, I aimed for a quick, digestible introduction to the world of marketing analytics. And I hope it is enough to get you interested in learning more about this topic. After all, digital marketing is virtually impossible to do without it.
As you dive deeper into marketing analytics, it will get more complicated than what we’ve discussed here. But on the other hand, it gets more interesting too. For example, there are methods where you can use machine learning for prescriptive analytics to uncover areas of improvement.
Also, if you’re interested in data analysis and want to make it one of the pillars of your marketing career, here’s some good news for you: Data-driven marketing is an important trend in the industry; in my opinion, it’s most likely here to stay. So getting some kind of data analytics certification relevant to your specialization is probably a good idea.
On a final note, to implement marketing analytics effectively (especially the more advanced type) in your organization, you will need the buy-in of other stakeholders. In other words, you will need a favorable company culture, aka data culture. Obviously, it’s not the data that matters the most, but what you do with it.
Got questions or comments? Ping me on Twitter.
SEO
Automate Multi-Site Reporting With Google Sheets And GSC API

Working in SEO leads to interesting challenges that I’m sure you’ve all faced at one point.
You’re a master of flexibility and managing tedious tasks. I’ve recently found myself dealing with 100+ top-tier sites.
Working with global companies, it’s quite the puzzle to:
- Wrangle data for 100+ sites.
- Keep tabs on every site’s performance.
And, since some of these sites compete against each other on the first page of Google, it’s quite possible that Site 1’s traffic drops but Site 2 captures the loss.
Checking one site’s Google Search Console (GSC) is easy, but it’s intense with hundreds of sites at a global scale.
What Can You Do?
I devised a Google Sheets Apps Script that connects to GSC’s API to transform global reporting from an arduous task that can take days – or weeks – into one that takes a few minutes.
After creating the script, I can easily put in a date range and pull each site’s:
- Clicks and impressions.
- Keywords.
- Average rankings.
- Etc.
Since we manage hundreds of sites, it’s not uncommon for users to end up on one of our sites to make their purchase, as mentioned above.
In the grand scheme of things, the bigger picture is more important than an individual site’s performance.
What I’m going to show you is my 10-step process to create a script that pulls clicks and impressions and then compares it all year over year (YoY).
10-Step Process To Create A Google Sheets Apps Script For Reporting On Hundreds Of Sites
Step 1: Creating Your Google Sheets
Your first step is to create your original Google Sheets file. You can do this by following these steps:
- Go to Google Drive.
- Navigate to the folder where you want to place the files.
- Right-click on the background
- Select > Google Sheets > Blank Spreadsheet.
You’ll want to rename the file. I called mine “Global Search Console Reporting.”
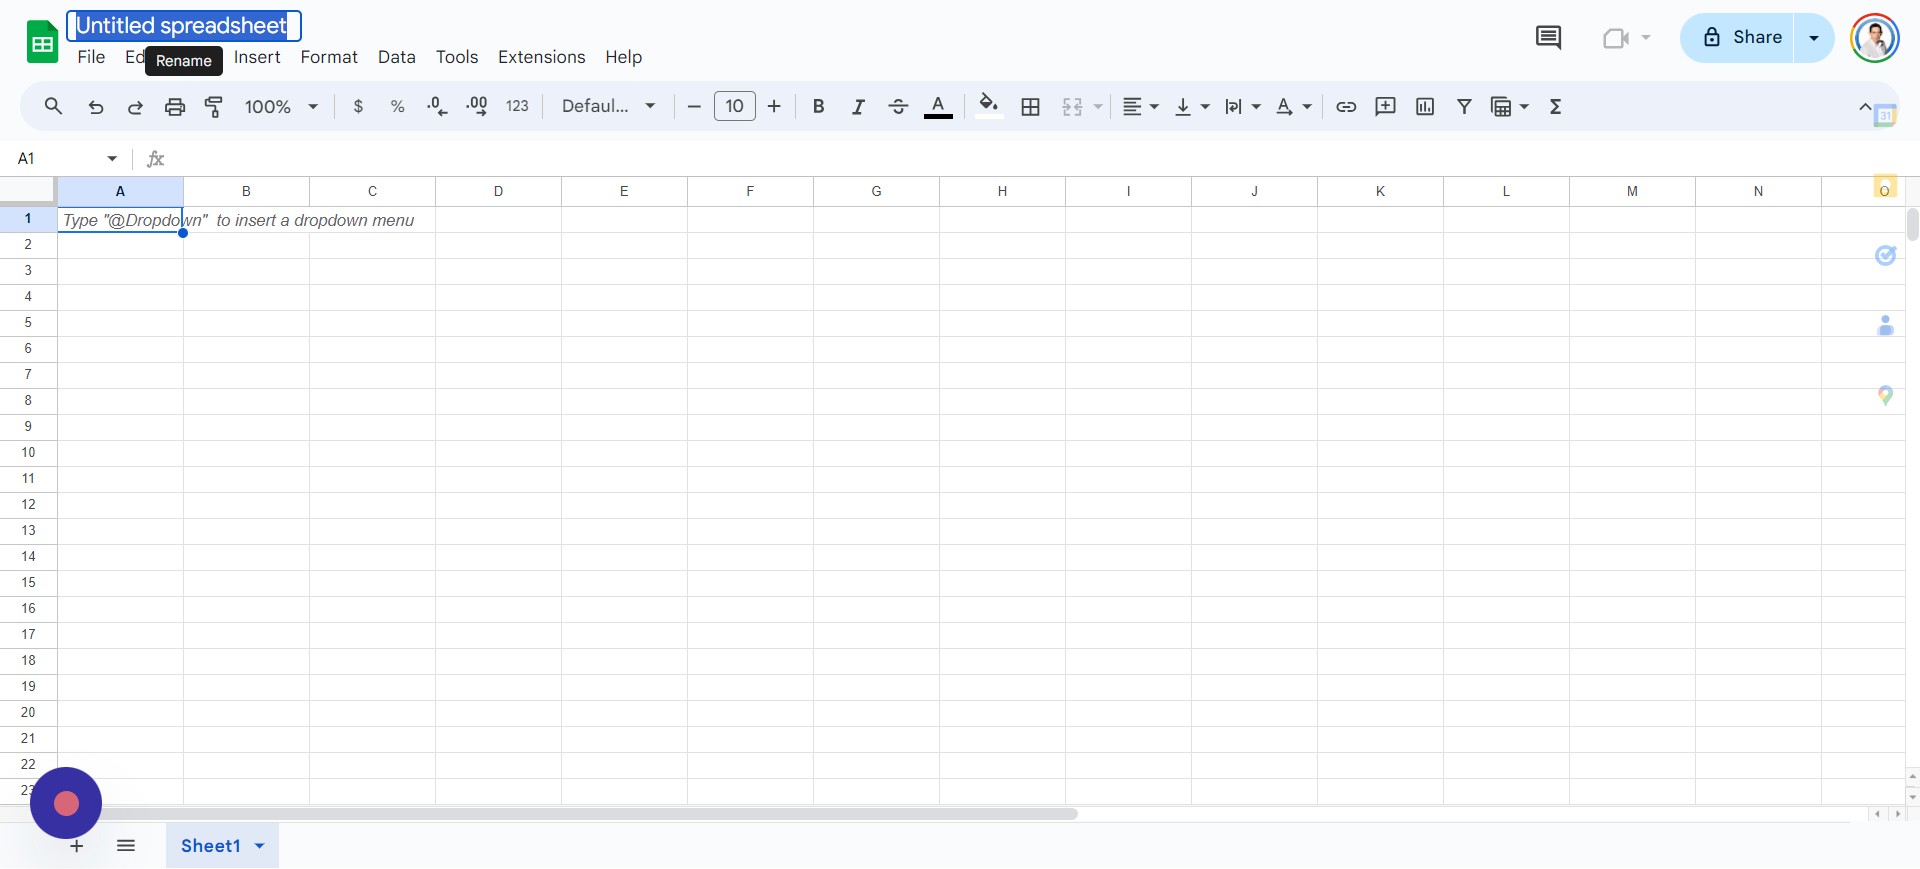 Screenshot from author, April 2024
Your file is now set up, and you’re ready for the next step.
Step 2: Setting Up Your Google Sheet
A blank sheet isn’t useful and won’t make sense to users until you add some headers in Row 1. Headers that I recommend adding, in this order and bolding, are:
- Website.
- Niche.
- Clicks.
- Impressions.
- YoY Clicks.
- YoY Impressions.
- Clicks % Difference.
- Impressions % Difference.
Your file should now look something like this:
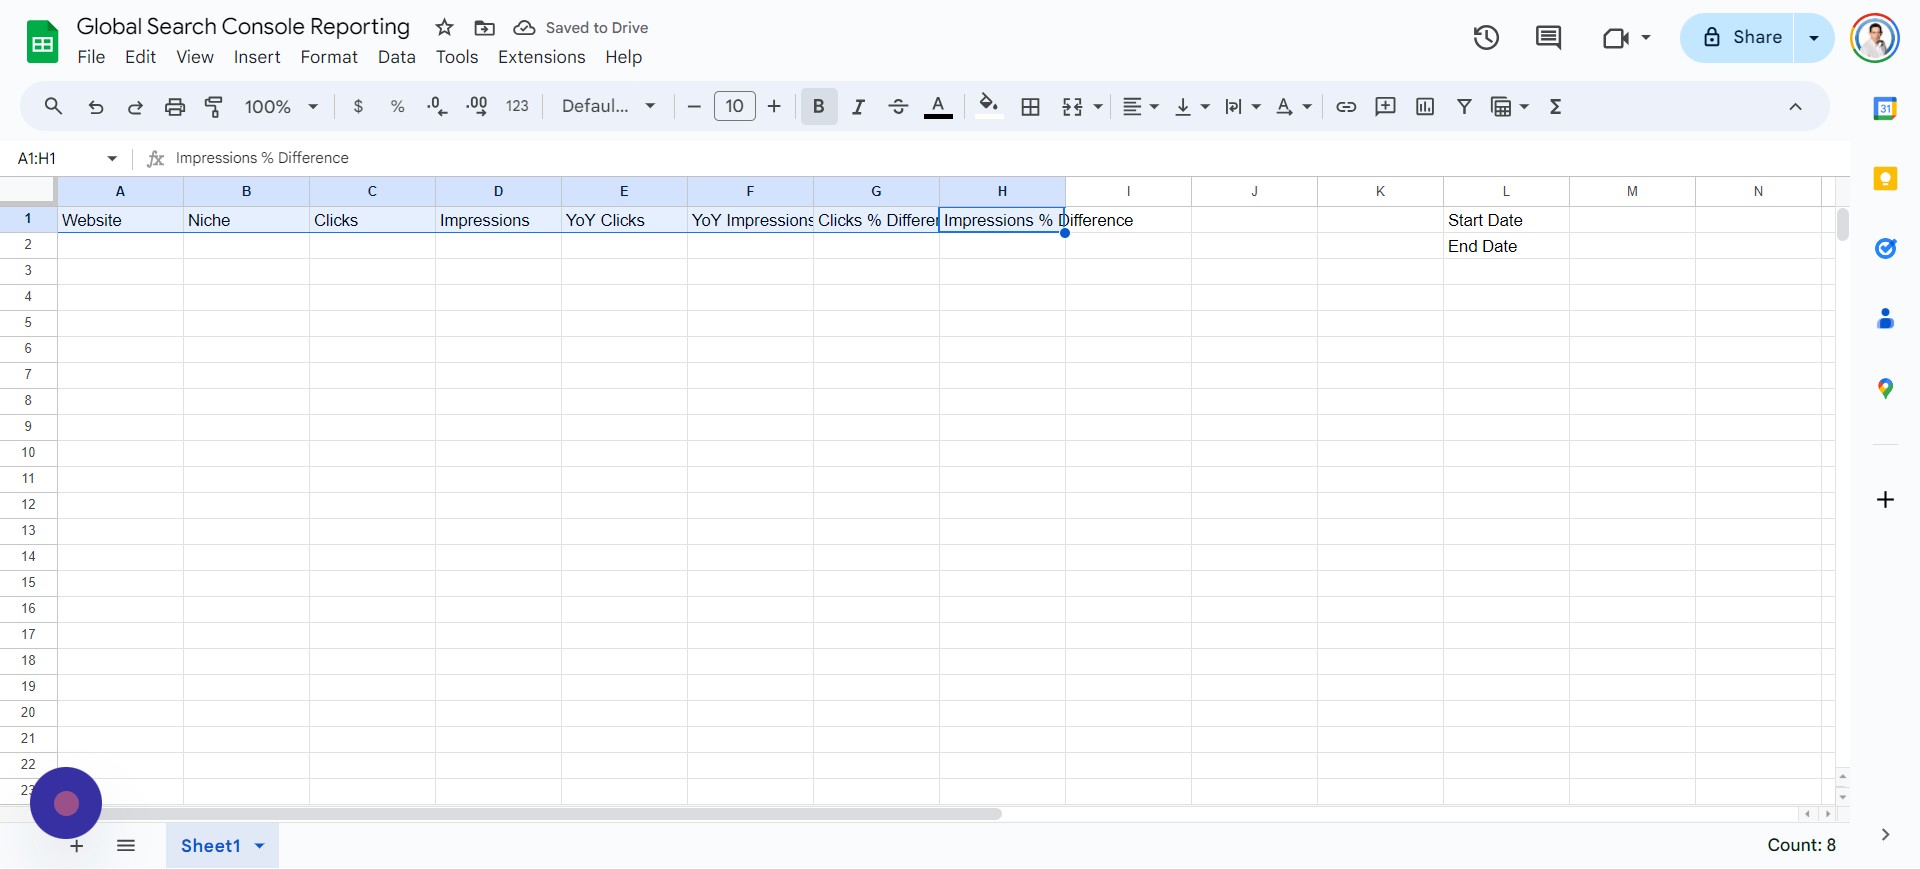 Screenshot from author, April 2024
Your next step is to create a Google Cloud Project, which is also fairly simple and straightforward.
Step 3: Create A Google Cloud Console Data Project
Creating your project should be free because Google provides a $300 credit to try out its platform. If you haven’t used Google Cloud, you can find it at https://console.cloud.google.com/.
You can now follow these steps:
- Tap Select Project > New Project.
- Enter Project Name (example: “My GSC Data Project”).
- Tap Create.
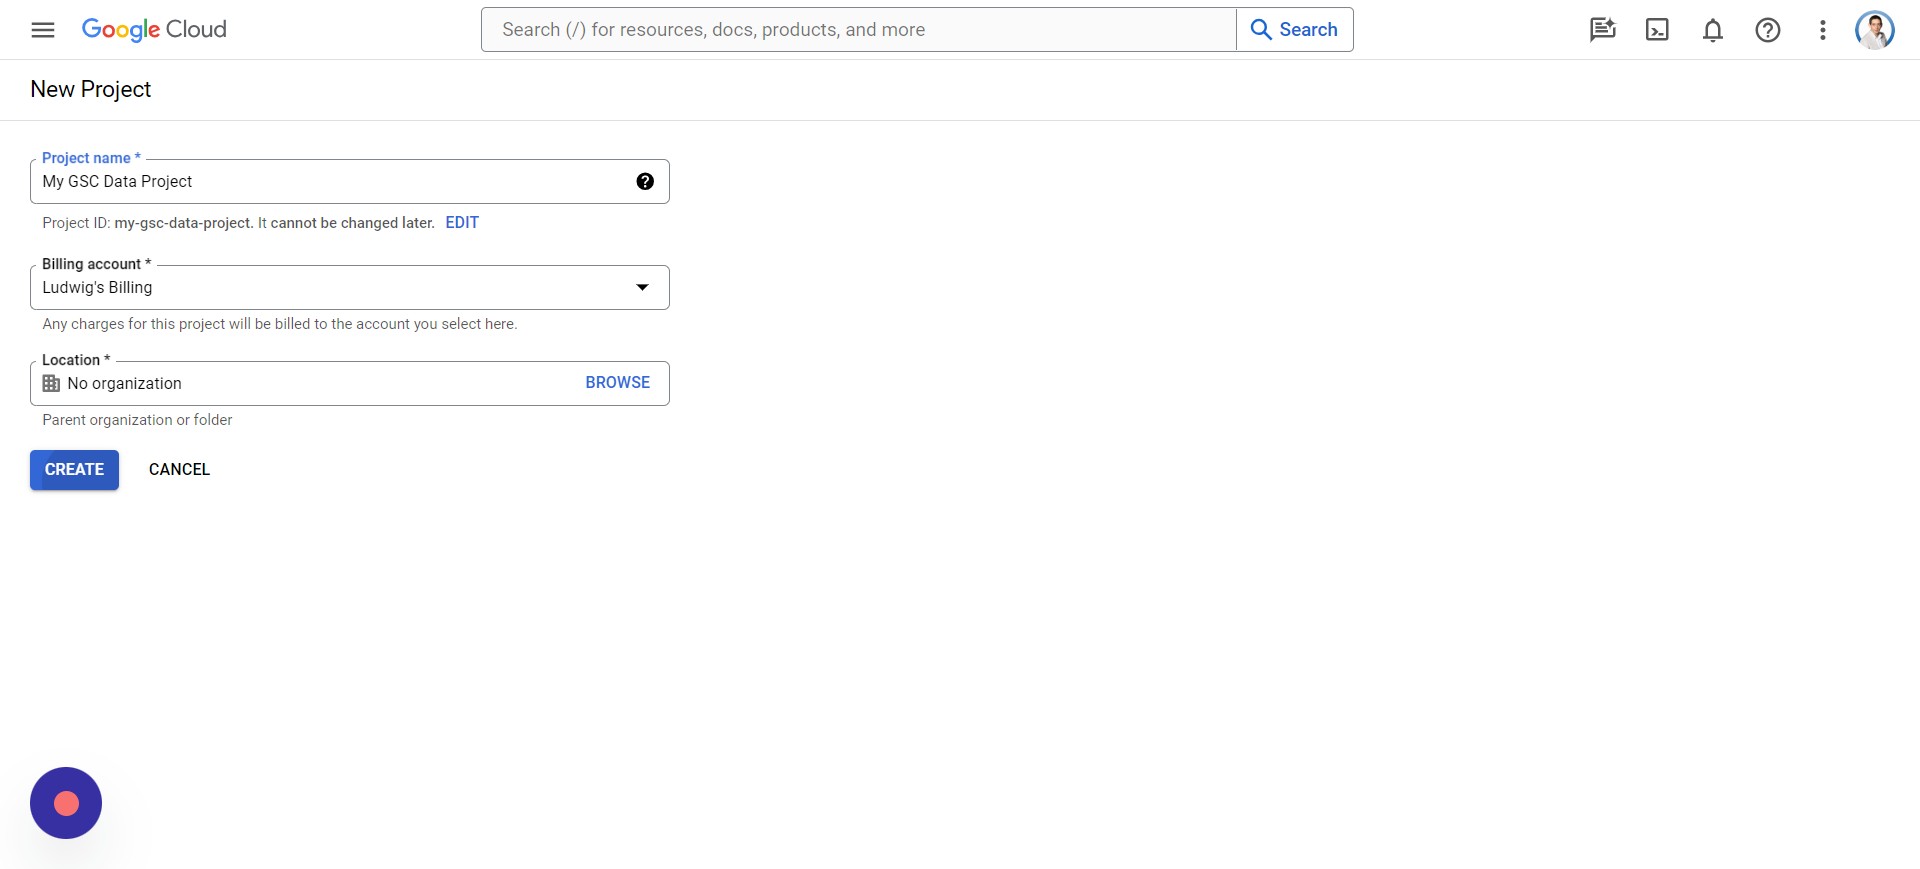 Screenshot from author, April 2024
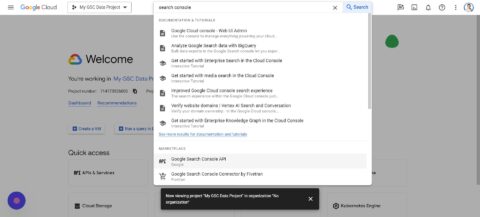
- Click Select Project.
- Select your Project.
- Click the top Search bar.
- Type “Google Search Console API.”
- Select “Google Search Console API.”
- Click Enable.
Step 4: Create Apps Scripts In Google Sheets
In this step, we will work on integrating the Apps Script into the Google Sheet that you created previously. You’ll need to open the Sheet and follow these steps:
- Tap Extensions > Apps Script.

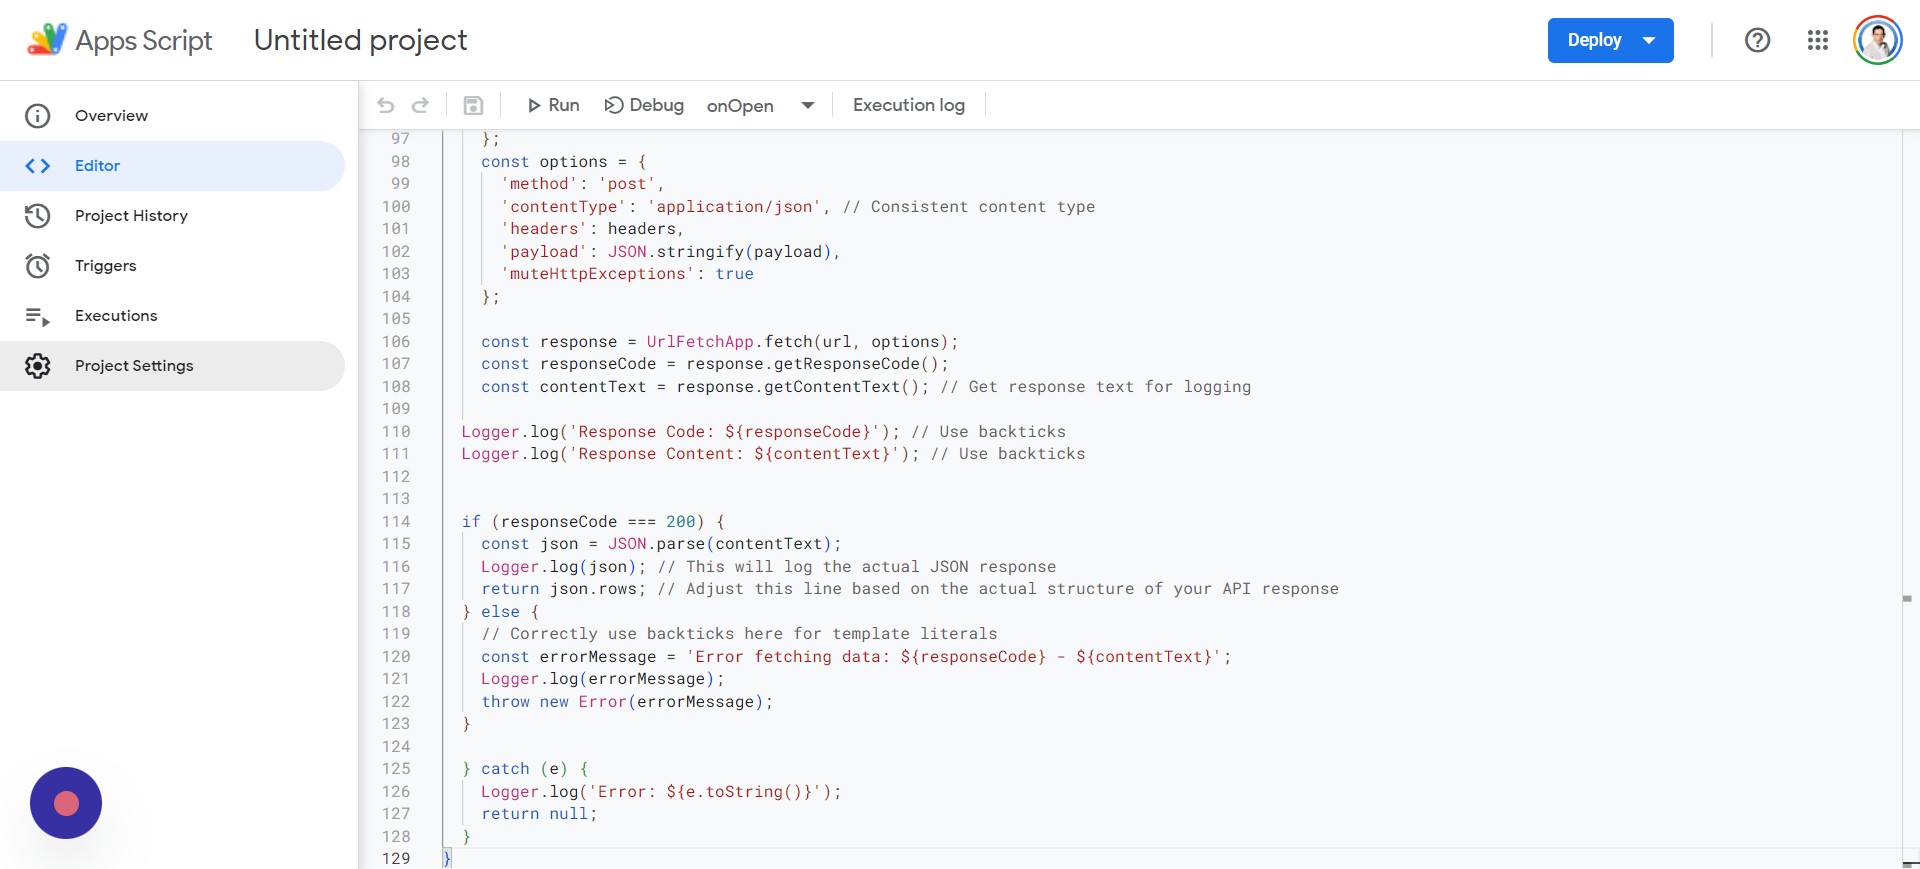
I’m not going to go into the details on how the script works, but you can copy this code:
function onOpen() {
  var ui = SpreadsheetApp.getUi();
  // Or DocumentApp or FormApp.
  ui.createMenu('Search Console')
    .addItem('Fetch Data', 'menuItem1')
    .addToUi();
}

function menuItem1() {
  var sheet = SpreadsheetApp.getActiveSpreadsheet().getActiveSheet();
  var lastRow = sheet.getLastRow(); // Find the last row with data in column A

  // Clear cells C2:F151 before processing data
  sheet.getRange("C2:F151").clearContent();

  for (var i = 2; i <= lastRow; i++) { var siteProperty = sheet.getRange(i, 1).getValue(); var startDateValue = sheet.getRange('M1').getValue(); var endDateValue = sheet.getRange('M2').getValue(); var timeZone = SpreadsheetApp.getActiveSpreadsheet().getSpreadsheetTimeZone(); var format = "yyyy-MM-dd"; // Calculate dates for last year var lastYearStartDate = new Date(startDateValue); lastYearStartDate.setFullYear(lastYearStartDate.getFullYear() - 1); var lastYearEndDate = new Date(endDateValue); lastYearEndDate.setFullYear(lastYearEndDate.getFullYear() - 1); var startDate = Utilities.formatDate(lastYearStartDate, timeZone, format); var endDate = Utilities.formatDate(lastYearEndDate, timeZone, format); // Fetch data for the previous year var previousYearResponse = requestSearchConsoleAPI(siteProperty, startDate, endDate); // Fetch data for the current year (unchanged) startDate = Utilities.formatDate(new Date(startDateValue), timeZone, format); endDate = Utilities.formatDate(new Date(endDateValue), timeZone, format); var currentYearResponse = requestSearchConsoleAPI(siteProperty, startDate, endDate); // Process and write data for both years processAndWriteData(sheet, i, previousYearResponse, currentYearResponse); } } function processAndWriteData(sheet, row, previousYearResponse, currentYearResponse) { // Check if response is not defined or null and has at least one row if (previousYearResponse && previousYearResponse.length > 0) {
    var previousYearClicks = 0;
    var previousYearImpressions = 0;

    previousYearResponse.forEach(function(row) {
      previousYearClicks += row.clicks;
      previousYearImpressions += row.impressions;
    });

    sheet.getRange(row, 5).setValue(previousYearClicks); // Write to column D (index 5)
    sheet.getRange(row, 6).setValue(previousYearImpressions); // Write to column E (index 6)
  } else {
    Logger.log('No data found for previous year in row: ' + row);
  }

// Process and write data for the current year
  if (currentYearResponse && currentYearResponse.length > 0) {
    var currentYearClicks = 0;
    var currentYearImpressions = 0;

    currentYearResponse.forEach(function(row) {
      currentYearClicks += row.clicks;
      currentYearImpressions += row.impressions;
    });

    sheet.getRange(row, 3).setValue(currentYearClicks); // Write to column C (index 3)
    sheet.getRange(row, 4).setValue(currentYearImpressions); // Write to column D (index 4)
  } else {
    Logger.log('No data found for current year in row: ' + row);
  }
}


function requestSearchConsoleAPI(siteProperty, startDate, endDate) {

  try {
    const oauthToken = ScriptApp.getOAuthToken(); // Correctly call the method
    const siteUrl = siteProperty;
    const url="https://www.googleapis.com/webmasters/v3/sites/" + encodeURIComponent(siteUrl) + '/searchAnalytics/query';
    const payload = {
      startDate: startDate,
      endDate: endDate,
      type: 'web'
    };

    const headers = {
      'Authorization': 'Bearer ' + oauthToken,
      'Content-Type': 'application/json'
    };
    const options = {
      'method': 'post',
      'contentType': 'application/json', // Consistent content type
      'headers': headers,
      'payload': JSON.stringify(payload),
      'muteHttpExceptions': true
    };

    const response = UrlFetchApp.fetch(url, options);
    const responseCode = response.getResponseCode();
    const contentText = response.getContentText(); // Get response text for logging

  Logger.log('Response Code: ${responseCode}'); // Use backticks
  Logger.log('Response Content: ${contentText}'); // Use backticks


  if (responseCode === 200) {
    const json = JSON.parse(contentText);
    Logger.log(json); // This will log the actual JSON response
    return json.rows; // Adjust this line based on the actual structure of your API response
  } else {
    // Correctly use backticks here for template literals
    const errorMessage="Error fetching data: ${responseCode} - ${contentText}";
    Logger.log(errorMessage);
    throw new Error(errorMessage);
  }

  } catch (e) {
    Logger.log('Error: ${e.toString()}');
    return null;
  }
}
And then go back to your Apps Script project and do the following:
- Press CTRL + A to select all.
- Press CTRL + V to paste in the code you copied.
- Tap OK.
- Click Save project.
- Tap Run.
*Note: If you are receiving a Bad Request error from Google with too many redirects, this is because you have multiple accounts logged in. Try in a browser with only one Google account logged in.
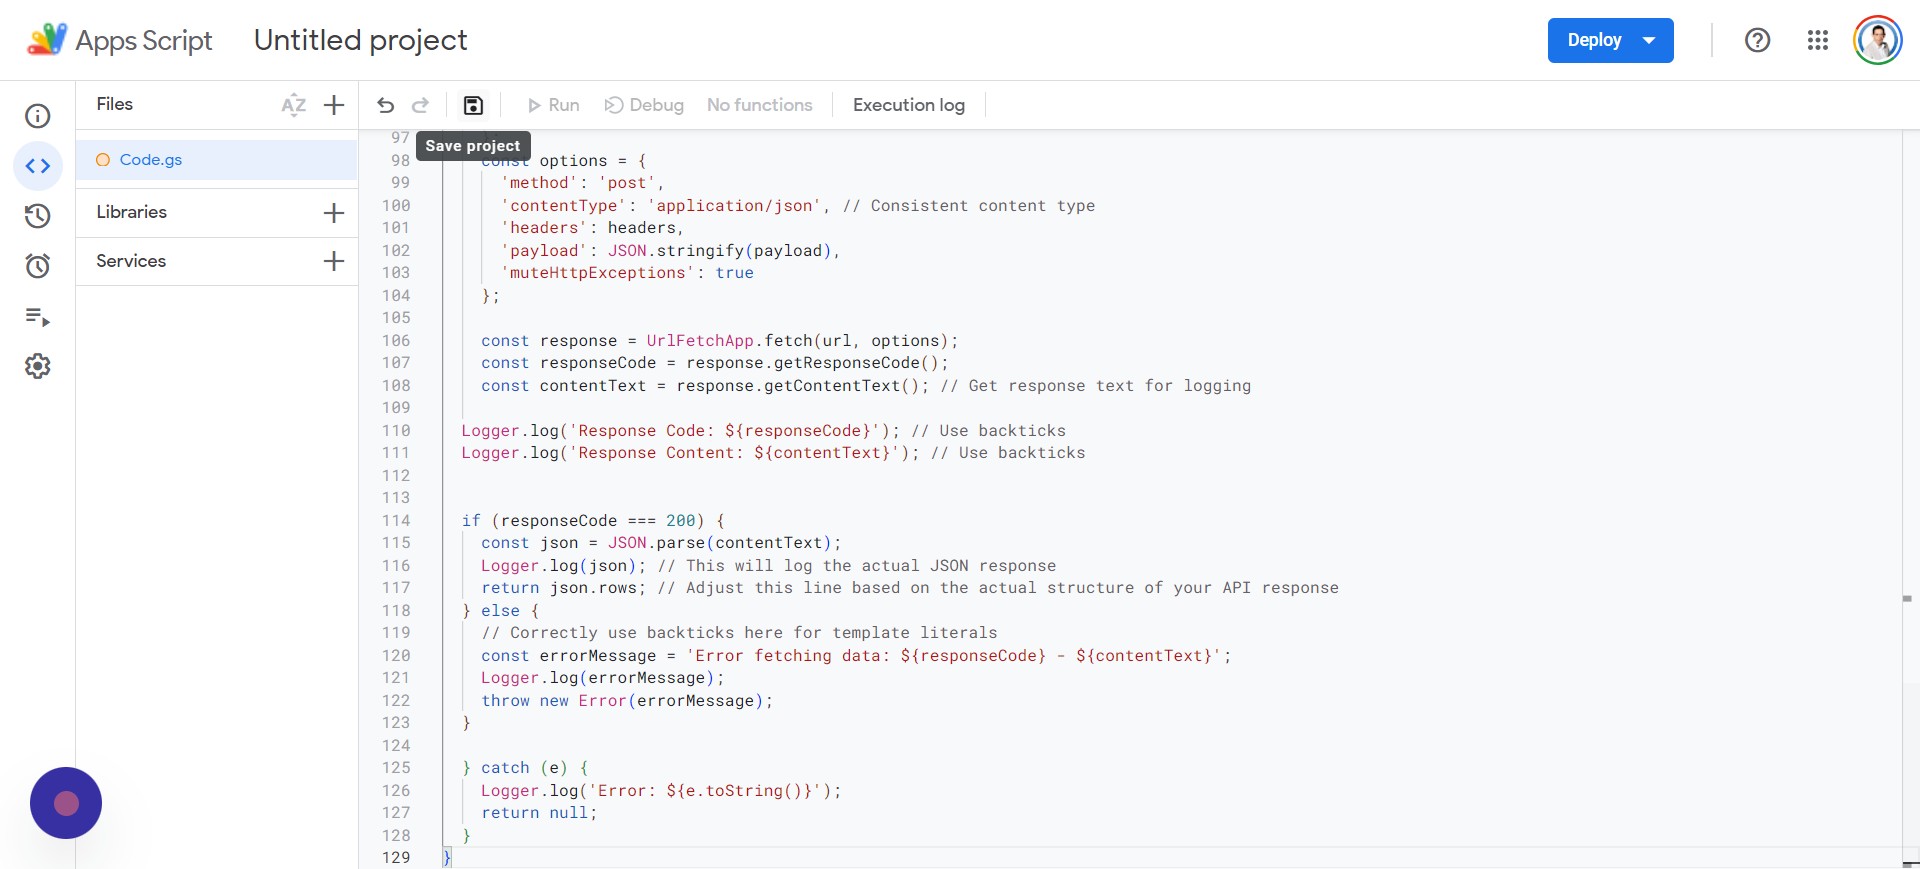 Screenshot from author, April 2024
You’ll be requested to Review permissions and will need to select the Google Account associated with your Google Search Console.
Google will give you a warning because the app isn’t verified, so simply tap on the “Advanced” setting and then “Go to Untitled project (unsafe).”
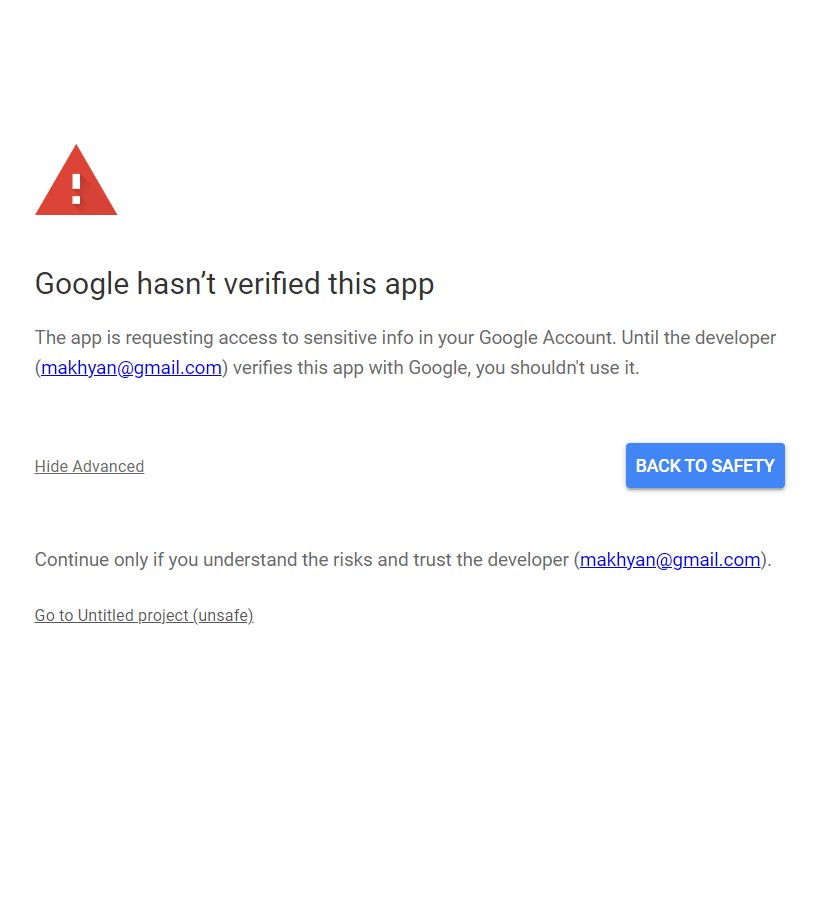 Screenshot from author, April 2024
Finally, you can complete this step by tapping or clicking on the Allow button.
Step 5: Set Up The Access Credentials
I know there’s a lot of back-and-forth going on between Sheets and Google Cloud Console, but it’s an unfortunate necessity at this point. Now, we will be setting up Access Credentials, which will require you to go back to the Google Cloud Console.
Note: You must have enabled the Google Search Console API from the previous step.
Your screen should look something like this:
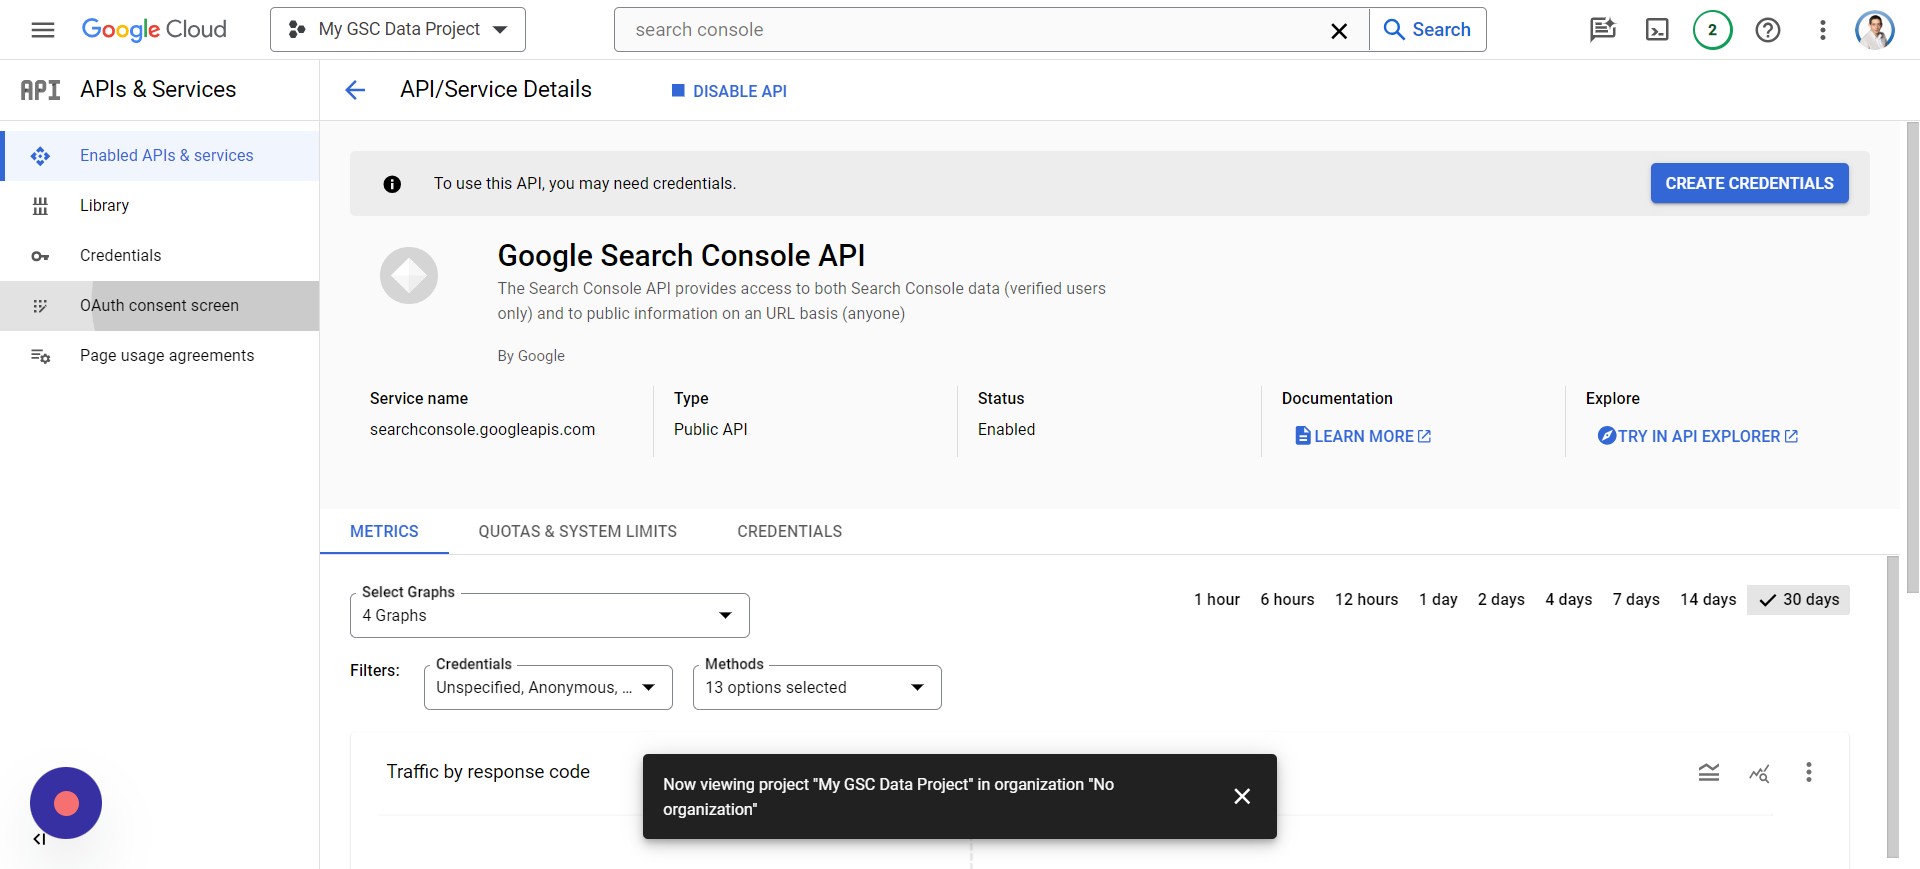 Screenshot from author, April 2024
You’ll need to:
- Tap Credentials > Create Credentials.
- Tap OAuth client ID > Configure Consent Screen.
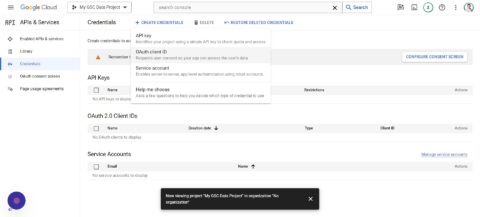
- Click External.
- Tap Create.
- Enter “My GSC Data” as the App name.
- Add your Support email (your email used for GSC).
- Add your Developer contact information (the email you used for GSC).
- Tap Save and continue.
- Tap ADD OR REMOVE SCOPES.
- Check 2 of the Google Search Console API scopes (might be on page 2).
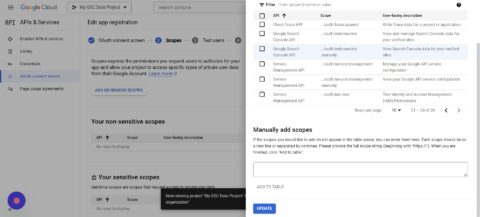
- Click Update.
- Click Save and Continue.
- Now click Add Users.
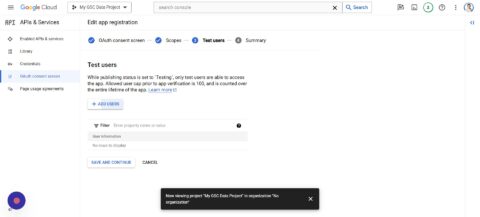
- You can add multiple users, preferably those that have access to GSC.
- Save and Continue.
Step 6: Set Up Google Cloud Project For GSC Data
While we’re still on the Google Cloud Project, you’ll want to click the hamburger icon and go to Cloud overview > Dashboard:
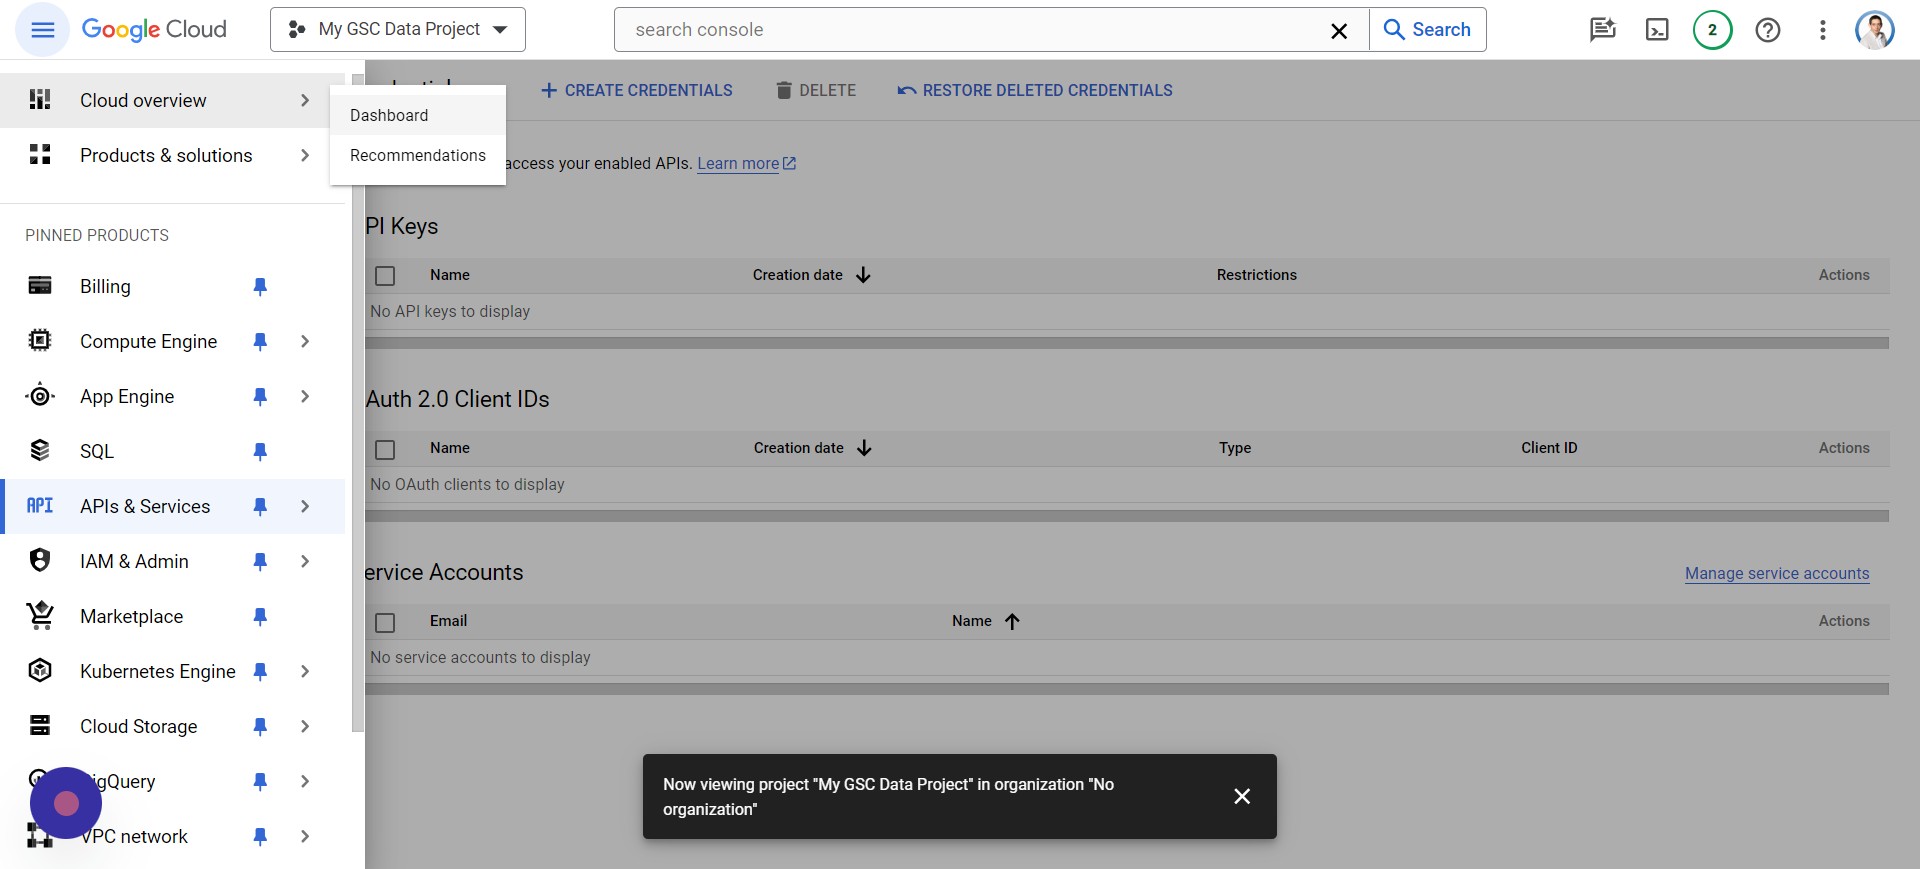 Screenshot from author, April 2024
You’ll notice that it says “Project number,” which you should select and Copy by pressing CTRL + C.
Switch back to your Apps Script tab and tap Project Settings:
 Screenshot from author, April 2024
Go to the section titled Google Cloud Platform (GCP) Project, paste the project number (CTRL + V) into the text box, and click Set project.
Step 7: Rename Your Google Apps Script
You’ll now want to rename your Apps Script by going to Project History like this:

You’ll then:
- Click Untitled project at the top of the screen.
- Enter “My GSC Data Project Script.”
- Click on Rename.
Step 8: Edit Google Apps Manifest File For Code.gs Script
You’re still staying inside of your script, and we’re going to go back to Project Settings just as we did before.
This time, you’ll want to click Show “appsscript.json” manifest file in editor to make sure there’s a checkmark next to it.
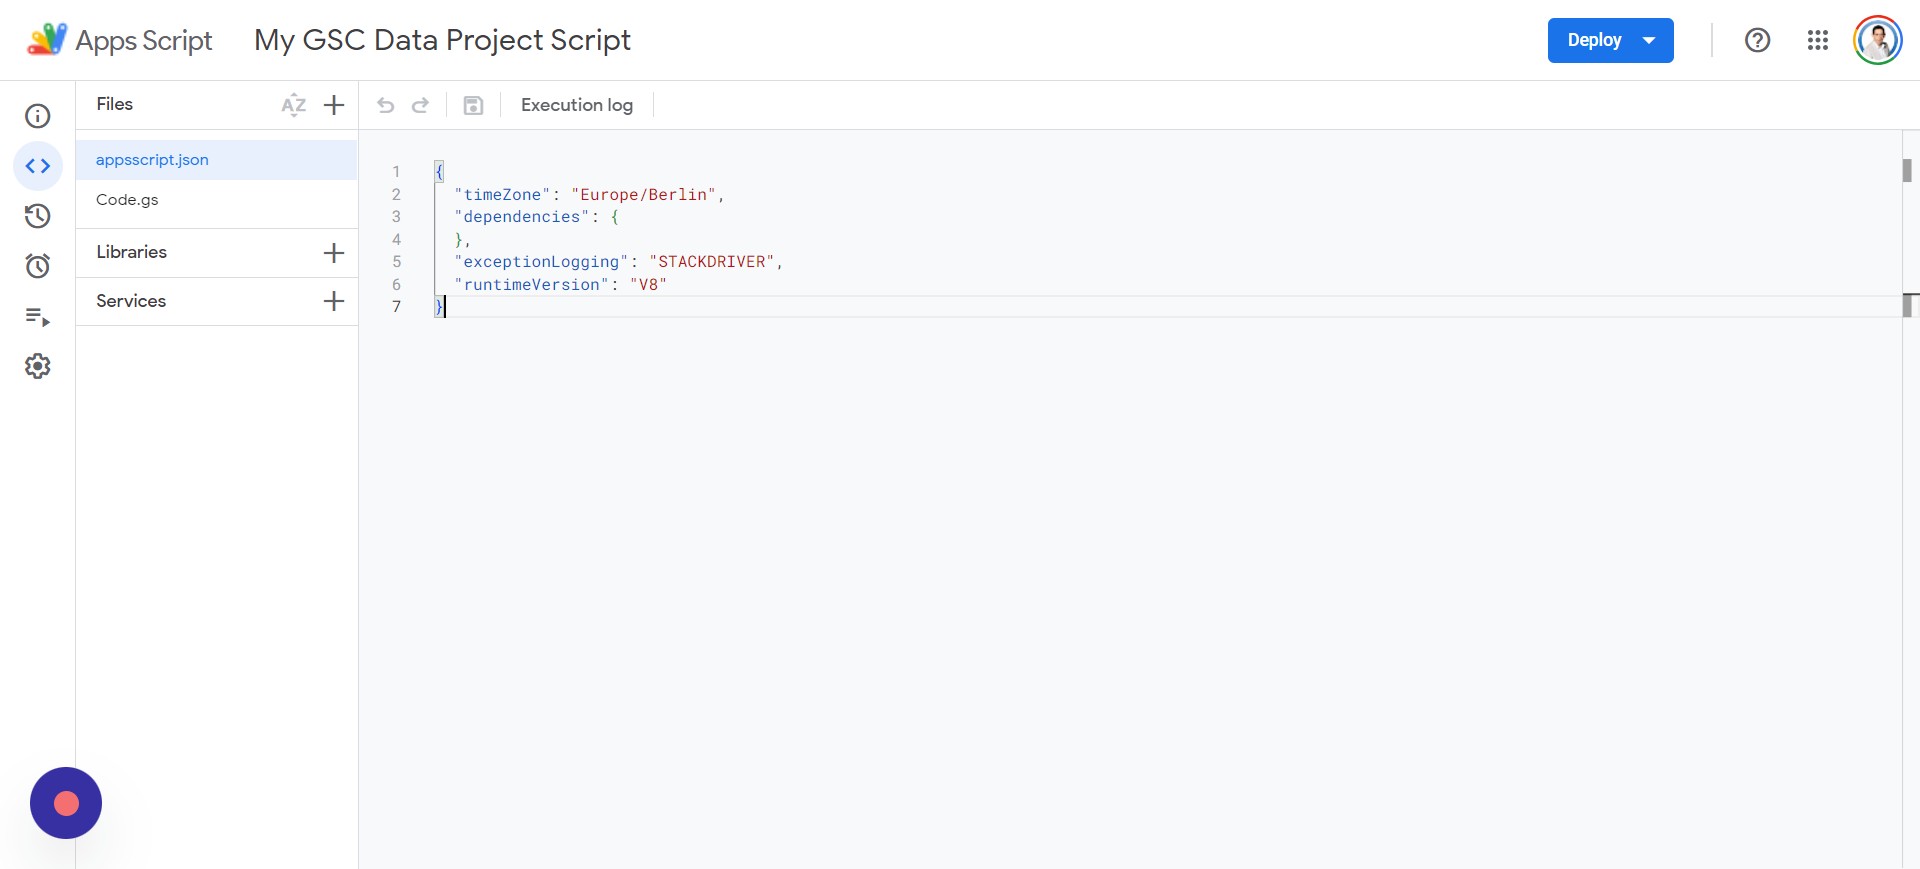
Next, click on Editor and navigate to the appsscript.json, which you can see below:
 Screenshot from author, April 2024
You’ll want to delete everything in the appsscript.json file and paste in the following script:
{
  "timeZone": "America/New_York",
  "dependencies": {
  },
  "exceptionLogging": "STACKDRIVER",
  "oauthScopes": [
    "https://www.googleapis.com/auth/webmasters",
    "https://www.googleapis.com/auth/script.external_request",
    "https://www.googleapis.com/auth/spreadsheets",
    "https://www.googleapis.com/auth/spreadsheets.currentonly"
  ]
}
Once you’ve added the code, you can click on your Code.gs file and tap Save, and then Run. You’ll be prompted to review permissions, and you’ll need to select your appropriate account to continue using.
After a few prompts, you’ll be asked to allow your app “My GSC Data,” and execution will begin.
Step 9: Adjust The Dates For Website Data Analysis
In the Google Sheets file, you’ll want to add the following under:
- L1: Start Date.
- L2: End Date.
Note: The start and end dates should be specified in M1 and M2. For example, you can input:
Note: The date format may differ based on your system settings and location.
Step 10: Set Conditional Formatting For Non-Empty Cells Less Than Zero
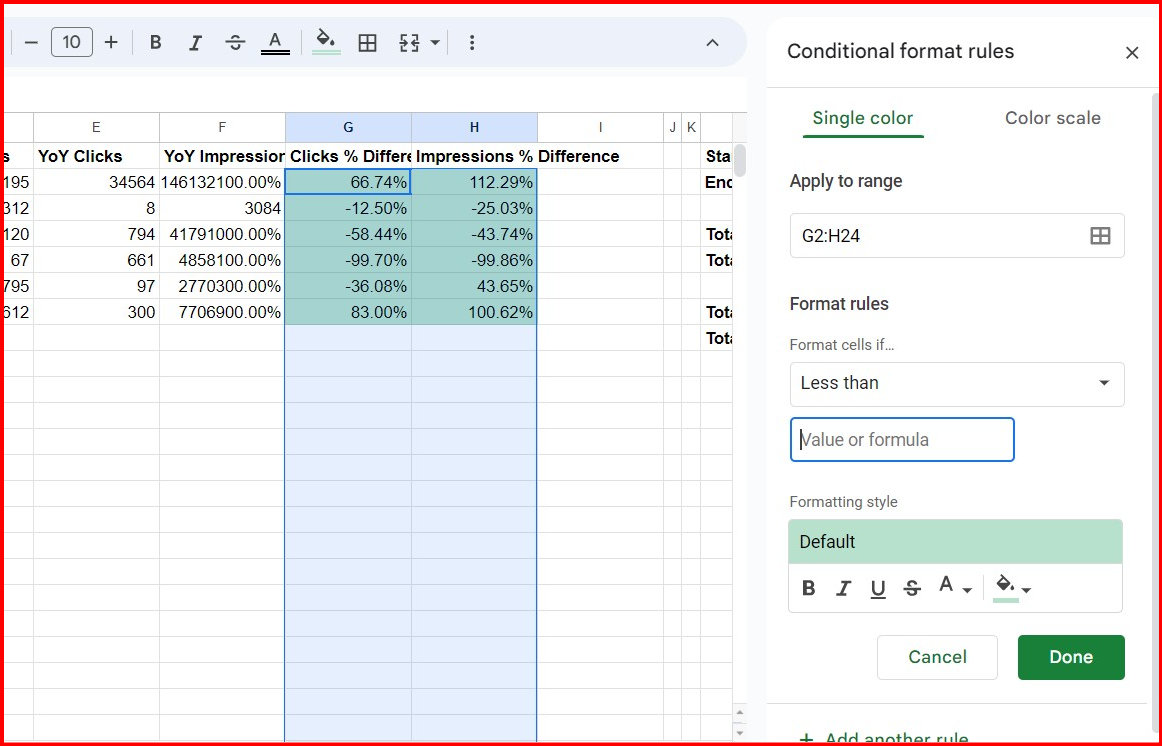
Everything is set up, but you should add some conditional formatting to make it look better. We’re going to focus on the “Clicks % Difference” and “Impressions % Difference” columns:
 Screenshot from author, April 2024
Select the rows under the headers “Clicks % Difference” and “Impressions % Difference” and click on Format > Conditional formatting. Under Format rules, you’ll want to select Less than.
In the “Value or formula” text area, you can add 0.
What this does is that if it’s less than 0, we’ll be changing the color to red since it’s in the negative and traffic has been lost. You can do this by clicking on the paint can and changing it to red before clicking done.
If you want to change a positive increase in traffic to green, you’ll add another rule for Greater than and add the 0 value.
Here are the formulas to use in G2 and H2 (you can replicate them for each row; just click and drag down for the other rows):
=IFERROR(IF(AND(C2<>"",E2<>""), (C2-E2)/E2, ""),"")=IFERROR(IF(AND(D2<>"",F2<>""), (D2-F2)/F2, ""),"")Now, you have an easy way to run reports on multiple sites at once.
That’s It, You Have Your Global Report
In column A, input your Google Search Console properties; if it is a domain property, add it as sc-domain:example.com or a URL property as https://example.com
To run or refresh the report, use the special menu Search Console > Fetch Data:
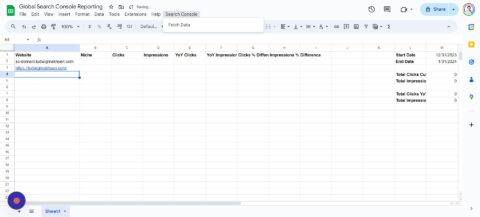
*Note: This script supports about 150 domains, but if you need more, you can adjust the row #14 in your AppScripts file:
sheet.getRange("C2:F151").clearContent();
Using this very tutorial, you’ll have an easy time turning days of gathering data and running reports into a few minutes. You can even expand the scripts to perform other calculations or gather more data for your report.
Check out my other tutorial on Integrating ChatGPT With Google Sheets.
Automating your reports is a great way to streamline tedious tasks, and I hope it makes your job a little easier.
More resources:
Featured Image: 200dgr /Shutterstock
SEO
Blog Post Checklist: Check All Prior to Hitting “Publish”

One thing I have clearly realized while being a full-time blogger and editor is that most writers (no matter how much we love them) are terrible at formatting.
I mean, I get it.
Writing is a creative process, and things like formatting, interlinking and proofreading may keep you from letting your creativity flourish.
One workaround is hiring a VA but if you have control issues (like I do) and still want to do everything on your own, here’s a free blog checklist that’s easy to follow and help you publish a perfectly formatted article each time!
A good formatting checklist should be:
- As short as possible (The longer it is, the more chances there are that none of your contributors will follow all the steps);
- As concise as possible (Avoid explaining the reason why you want it to be formatted that way. The more you explain, the less obvious your point becomes. Just list your requirements)
- As easy to understand as possible (Add a few screenshots, bold most important points, etc).
Feel free to make yourself a copy of this checklist, edit minor details (like the preferred width of images) and use it to edit your blog. It will be suitable and (hopefully) useful for.
- A single-author blog for consistency
- A (business) blog with multiple co-authors;
- A business managing multiple paid contributors;
- A business owner outsourcing content to ghost writers, etc.
Attention: This guide requires that your blog contributor has a wp-admin (Contributor) access to your blog. Otherwise, you may ask to send you the articles in HTML.
*Make a free copy of the checklist here. Read some explanations below*

Structuring Standards
We know that breaking the article into sections is very important: blog readers tend to scan through the articles jumping from a subheading to a subheading (and probably reading the sections that seem most relevant to them).
One of the most efficient ways to capture your readers’ attention is to provide catchy subheadings that would summarize your article content nicely. Ideally, the reader of the article should understand what it is about by just scanning through the subheadings which should effectively summarize the article content while still encouraging the reader to go more indepth.

Other important guidelines that (may) go in this section:
- Make your sentences and paragraphs short (that makes the whole article easier to read)
- Introduce your article effectively in the opening paragraphs and encourage a discussion in the conclusion (by asking some questions)
Adding Links
Links are always great (unless links are brutally self-serving and anchor-text-dirty). I always encourage all my authors include links to any app, business or person they are mentioning. Links are user-friendly, so in my guidelines I always prompt contributors to:
- Link to relevant articles on my blog;
- Link to others relevant articles elsewhere (as well as sources of information, apps, etc)
- Normally link words (not image files or subheadings)
- Always make sure they are using the full URL and the original “clean” link (now a shortened version, stripping all tracking parameters, etc).
Lists
Including lists is also highly appreciated. A well-formatted list is likely to draw readers’ attention and make them stay.
Sadly, contributors tend to format lists in all possible ways using -, *, or any other inappropriate symbols instead proper <ul><li> coding. Therefore it’s a good idea to remind them of proper formatting here.
Images
Another very important element of any blog post. Images will never be added unless you clearly ask for them.
Here I specify the proper style and size of the images as well as encourage authors to include a relevant, catchy and properly attributed Creative Commons image.
Here are more checklists you may find useful for blogging:
FAQ: Blog Post Checklist: Check All Prior to Hitting “Publish”
What is the purpose of the blog post checklist?
The blog post checklist is designed to help bloggers and editors publish well-formatted articles consistently, without having to compromise on the creativity of the writing process.
Who can benefit from using this checklist?
The checklist can be beneficial for a range of people including single-author blogs, multi-author business blogs, business owners outsourcing content to ghost writers, and businesses managing multiple paid contributors.
What are the key components of the checklist?
The blog post checklist focuses on:
- Structuring standards (including catchy subheadings and succinct paragraphs)
- Proper linking to relevant articles and sources
- Creating well-formatted lists
- Adding appropriately styled and attributed images.
How should the article checklist be crafted?
The checklist should be as short, concise, and easy to understand as possible, with important points highlighted, possibly with the use of screenshots.
How can readers access the checklist?
Make a free copy of the checklist from the link and modify it according to their preferences and needs.
If you find the guidelines useful or have any improvements to suggest, please comment below!
I am Ann Smarty, owner of SEOsmarty.com. I’ve been in the SEO industry for two decades. I am the former Editor-in-Chief of Search Engine Journal and a contributor to Mashable. These days I am running Viral Content Bee and writing for Moz, Buzzsumo, Wix and many others!
SEO
How To Cultivate Focus And Execute Better

Focus is mission-critical, but most companies don’t lower the gravitational forces pulling on attention.
As a result, large companies with too much mass have a hard time navigating and adapting to the quickly changing organic growth landscape:
- Google’s algorithm updates have struck hard and left casualties.
- Even small rank changes in top positions have an outsized impact.
- Consumer behavior on the internet is messy and hard to track
- Teams are shrinking: 80,000 tech workers have been laid off in 2024 so far.
- Marketing budgets were slashed on average by 10 to 20% over the last two years and only slowly started to recover.
- Tech workers spend two out of five days per week on meetings and email. Only 43% of the time is spent on actual tasks.
No platform has as many changes of requirements. Over the last 3 years, Google launched 8 Core, 19 major and 75-150 minor updates. The company mentions thousands of improvements every year.
As individuals, we live in a distracted world, where one of the most important skills is managing attention. How did we think teams are any different?
Boost your skills with Growth Memo’s weekly expert insights. Subscribe for free!
No Win Without Focus
Sir Isaac Newton realized that the sun’s gravity causes planets to orbit it in an elliptical path. Gravity in the workplace is a distraction from the focus of individuals and teams:
- Meetings.
- Fire drills.
- Red tape.
- Strategy pivots.
- Too many goals.
- Alignment overhead.
- Too many cooks in the kitchen.
- Procurement and legal rabbit holes.
- Non-critical emails and Slack messages.
The larger a company gets, the stronger its gravity.
Taken to an extreme, it takes companies forever to launch even a single feature, and they fall behind the competition.
For individuals, gravity is even more consequential: Scattered attention means getting nothing done, having no impact, and likely being fired. Worse, people get exhausted and burned out in the process.
“Tranquility comes from doing less,” (Ryan Holiday), but a lot of teams execute scatter-brained like a teenager multitasking between Netflix, TikTok, and texting.
Individual and team focus are connected at the hip. When a team is distracted, it transfers to individuals. Two-thirds of people struggle to find the energy to do their job.
Whenever I get overwhelmed, my brain tells me to open my email inbox and look for a quick dopamine hit. But finding quick tasks and busy work is no achievement.
Real impact comes from working through tedious, complex problems.
We cannot erase gravity, but we can do five things better:
- Communication.
- Prioritization.
- Strategy.
- Red Tape.
- Meetings.
Better Communication
Unclear communication is one of the biggest attention drainers. We waste a lot of time deciphering what other people mean.
At Shopify, we had a very high bar for what internal communications went out to the Growth org and how they would be framed.
It’s easy to @ your whole team on Slack, but what people really need is key information:
- What’s going on?
- How is it relevant to me?
- What do I need to know/do?
Lazy communication has massive speed cost. In the book “Smart Brevity,” the authors provide a simple framework for writing clear statements:
- Start with a muscular tease that grabs attention with six or fewer strong words.
- Explain what recipients need to know in the first sentence.
- Explain why it matters.
- Offer a choice to go deeper by providing more optional context.
Most important: Think about one thing you want people to remember – not more. Nobody has time to read a Slack novel.
Better Prioritization
At PayPal, Peter Thiel established a culture of hardcore focus. He would only discuss their No. 1 priority with managers and hold them accountable for just their one main contribution to the company.
Focus is a forcing function to separate the wheat from the chaff when it comes to what to spend time on.
No one could be a better example of hardcore prioritization than engineers. If you want to get something on the ENG roadmap, something else has to give.
An effective roadmap operating system has only a few lines of code:
- What’s the goal?
- What are the top 3 things that get us there?
- For those three things, what do we need in terms of people, assets, time, support from other teams, and tools?
- For those three things, who does what, by when?
- Defend yourself and your team as much as possible from anything else.
You never look back at your time at a company and say, “Man, my fourth, fifth, and sixth priority back then really hit home,” but you might remember the impact of priorities one, two, and three.
Cal Newport’s new book, “Slow Productivity,” mentions doing less as one of the top ways to do better work.
But the advice I like the most is doubling the time you think a project takes.
Doubling automatically trims your roadmap by probably 50% but makes it more likely that you deliver on time and deliver well.
A big part of moving ourselves into an overcommitment corner is underestimating how long projects take (I think I wrote the last sentence at least as much for myself as for you).
Better Strategies
Poor strategies are hard to follow and confuse the team.
In my experience, managers want to get fancy, but they miss the most important point: A good strategy means doing something different from the competition.
Instead of outworking contenders, you want to do something that’s unique and leans to your competitive advantage.
Pairing differentiation with prioritization, your three most important projects should underline how you achieve the same goal in a different way as your competitors.
For example, instead of writing 100 blog articles, can you build a programmatic play or a list of tools? Or can you leverage contributors who write the content instead of a large in-house team?
I also found that most strategies simply aren’t clear. A simple test for clarity is to up or downsize the surface you have to explain it: Can you express your strategy in one paragraph (TL;DR), one page (high-level), and one doc (in-depth)?
Less Red Tape
Red tape in the form of excessive bureaucracy kills execution. I’ve seen many companies that take many weeks and endless alignment meetings before being able to sign up for a simple SaaS tool.
Procurement and legal teams can slow companies down and frustrate teams beyond means.
The key to having speed and a good evaluation process is clear guidelines when legal or procurement steps in.
With one of my former clients, the fastest-growing fintech startup in history, we sat down with the legal team and got a full download on guardrails. What can we say and what not? When do we have to get legal approval, and when can we move forward without it?
This is a task for the team manager or org leader. While tedious, the good news is that once the borders have been established, teams can move forward faster and focus on execution.
Fewer Meetings
Tobi Lütke, founder and CEO of Shopify, called meetings a “bug.” The leadership team regularly deployed the “Chaos Monkey,” a script that deletes all recurring meetings with more than two participants. Other companies set guardrails around time. Calendly restricts meetings to noon until 5 p.m.
Most meetings are poorly run, unnecessary, or simply a way for people to socialize.
Besides an agenda, every meeting should have a clear purpose. There really are only three types of meetings: socializing, information sharing, and decision-making.
Building relationships in the workplace is important, and there is nothing wrong with socializing. It’s important to be explicit and avoid meeting to “talk about Project X” while really wanting to socialize.
Information-sharing meetings are best done async. Instead of getting a large group of people together, record your message in a video or write a memo.
Decision-making meetings should be led by the decision maker and come with a pre-read.
The problem with many large organizations is that decisions are poorly framed; it’s unclear who makes the decision, and the decision-maker doesn’t have explicit criteria for how to make the decision.
Outlook: Can AI Help Us Regain Focus?
Show me how focused your team is, and I’ll show you a team that will win.
High gravity in large organizations, on the other hand, is an ask to be disrupted by a smaller, more agile player. The good news is that technology is working against gravity – at least in the workplace.
AI has the potential to help us find fragmented information, force clarity, and take over bland admin tasks that drain time so we can focus on things that matter.
Microsoft’s Future of Work report concludes:
“Organizational knowledge is fragmented across documents, conversations, apps and devices, but LLMs hold the potential to gather and synthesize this information in ways that were previously impossible”.
In the future, we’ll be able to ask LLMs questions about any internal process, like “What are our top goals?” or “Does this need legal review?” The freed-up time allows us to refine our strategies and get work done.
That future still seems a few years away. Until then, we can do a lot to improve our attention.
Marketing spending shows signs of growth, but AI adoption is slow: report; Beyond belt-tightening: How marketing can drive resiliency during uncertain times
Workers Now Spend Two Full Days a Week on Email and in Meetings
Microsoft New Future of Work Report 2023
Featured Image: Paulo Bobita/Search Engine Journal
-

 SEO7 days ago
Why Big Companies Make Bad Content
-

 SEO7 days ago
How To Drive Pipeline With A Silo-Free Strategy
-

 PPC7 days ago
26 Ready-to-Go AI Prompts for Social Media
-

 MARKETING6 days ago
Generative Engine Optimization Framework Introduced in New Research
-
SEARCHENGINES4 days ago
Daily Search Forum Recap: May 3, 2024
-

 MARKETING5 days ago
Let’s Start Treating Content More Like We Treat Code
-

 MARKETING4 days ago
Tinuiti Recognized in Forrester Report for Media Management Excellence
-

 MARKETING3 days ago
How Tagging Strategies Transform Marketing Campaigns


You must be logged in to post a comment Login