Connect with us

SEO

6 Ways To Optimize Your PPC Performance

Published

on

6 Ways To Optimize Your PPC Performance

PPC optimizations are critical to improve your paid search advertising campaigns’ performance.

Before we get into our top tips, what exactly is PPC optimization?

After paid search campaigns are launched, running, and collecting data, optimizations begin.

Pay-per-click (PPC) optimization is the process of reviewing, analyzing, and editing campaign elements to improve performance based on business goals.

Now for the second big question: where should you start?

Let’s dig into some ideas to optimize your PPC performance to get you started or spark new ideas.

1. Keywords

Keywords drive ads in the search results and help match searchers with the most relevant ads.

Experts know that frequently, the search queries don’t match exactly with the keywords in the account.

This is where the keyword match type comes in.

While exact match is the most relevant to serving ads, it is also the most restrictive and can leave some opportunities behind.

On the other end of the spectrum, broad match is the most flexible in keyword matching but can lead to irrelevant searches triggering ads.

Regardless of which match type you decide on to get started, you should continually review to ensure you’re reaching the right audience.

Here are a few metrics that serve as indicators of performance for keywords:

  • CTR: The click-through rate (CTR) for search for more general keywords describing the product or service should be over 1% at a minimum. The CTR for brand terms is usually much higher at 3% or more. If the CTRs are less than that, it means the ad does not seem relevant to the user, who doesn’t click. Check search terms and ad relevancy.
  • Conversions: Compare historical conversion data to the new keywords to see how they compare and whether the keywords are not relevant enough, or match-typed too broadly.
  • Interactions, time on site, website metrics: If the traffic is not interacting with the website as you would expect, this may also be an indicator the keywords need optimizations.

2. Search Terms And Negative Keywords

Digging more into the keyword topic, oftentimes irrelevant searches or navigation searches will trigger your ads and cause poor performance.

PPC optimization needs to employ a solid negative keyword strategy.

I divide my negative keyword efforts into two categories.

Proactive Negative Keywords/Lists

Create themed keyword lists themes around parts/accessories, job hunting, products/services you don’t offer, and competitors’ names you don’t want to show up for.

For example, say your company has an employee login for your main website. You notice employees searching for the employee login are clicking on ads to reach it.

You will want to use that “login” theme to create negatives on possible searches that may occur to avoid spending PPC budget on employee searches.

Reactive Negative Keywords

Review the search terms triggering ads for the match type and keyword. Click the box next to the search term to edit, add, and exclude as appropriate.

Screenshot from Google Ads, August 2023

Use the new negative keyword lists to apply to similar campaigns as a proactive measure. The shared lists can easily be updated in the future, with all campaigns sharing the list automatically updated with changes.

Below is a basic example of a shared negative keyword list designed to exclude searches related to job hunting that may trigger ads and waste click costs.
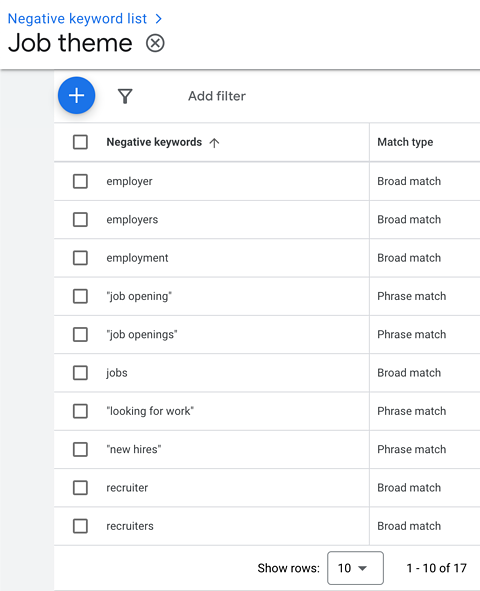
Google Ads negative keyword listScreenshot from Google Ads, August 2023

3. Budgets

I get asked about PPC budget strategy nearly every day, and for good reason! Managing a budget is an art; finding the perfect overall investment and campaign allocation for PPC ads takes skill.

While most advertisers set a monthly budget not to exceed, technically, the budgets are set at the campaign level for a daily budget.

Google will serve the ads to get the best results, so the actual spend may be under or over the daily budget, but will not exceed the daily budget x 30.4 days in a month.

Therefore, while keeping an eye on the spend is important, checks are in place to ensure the automation is working for you.

With that said, Google doesn’t optimize between campaigns, so it is up to you to optimize this on a regular basis. Better-performing campaigns should receive a higher percentage of the budget.

While this is a good basic rule of thumb, it isn’t always the case.

This may not apply in cases where branding and awareness or certain display campaigns don’t show many conversions. Also, company brand names may convert higher but don’t need more budget.

You can also set an account budget if you are using monthly invoicing for payments. This enables a set budget amount across campaigns with a start and end date, which is handy if you need more structured billing.

Be sure to check out 15 Tips on How to Rock a Small PPC Budget, which can help with ideas for budget challenges.

4. Responsive Search Ads (RSAs)

Responsive Search Ads (RSAs) are the standard ad type in Google Ads. Some advertisers may still have previous versions running, so those should immediately be transitioned to the most current version.

RSAs contain up to 15 headlines and 4 descriptions that automatically mix and match and test via Google Ads AI. As data is collected, Google’s learnings result in ad strength feedback ratings: poor, average, good, or excellent.

In addition to the overall ad rating, individual asset performance ratings are provided: learning, low, good, or best.

Once an asset has 500 impressions and the ad has over 2,000 impressions, it’s time to replace low-performing assets.

These ratings can serve as a guide to know which assets need optimization attention.

Using automated asset suggestions can be helpful, but use common sense and marketing writing best practices to showcase features, benefits, calls-to-action, etc.

Google Ad strengthScreenshot from Google Ads, August 2023

5. Location Targeting

It’s a good practice to optimize location targeting by business goals and performance results.

Some advertisers will use the handy set-up in the PPC platforms, which may auto-select large target areas such as an entire country, when geo-targeting is available in a number of more granular settings: state, cities, zip codes, radius around an address, and more.

Consider the following strategies to optimize the locations where your ads are served:

  • Bid adjustments – Set bids by location so that your bids increase for searchers in the area you want to reach more.
  • Layering a city over the state and adjusting the bid higher in that city to favor it over the rest of the state.
  • Excluding locations you don’t serve or where you are not likely to find quality leads or customers.

Below, in the location view, advertisers can see performance by the segment they select and then analyze performance.

Increase bids for high-producing locations, and consider reducing bids for areas that don’t convert as well or remove altogether.
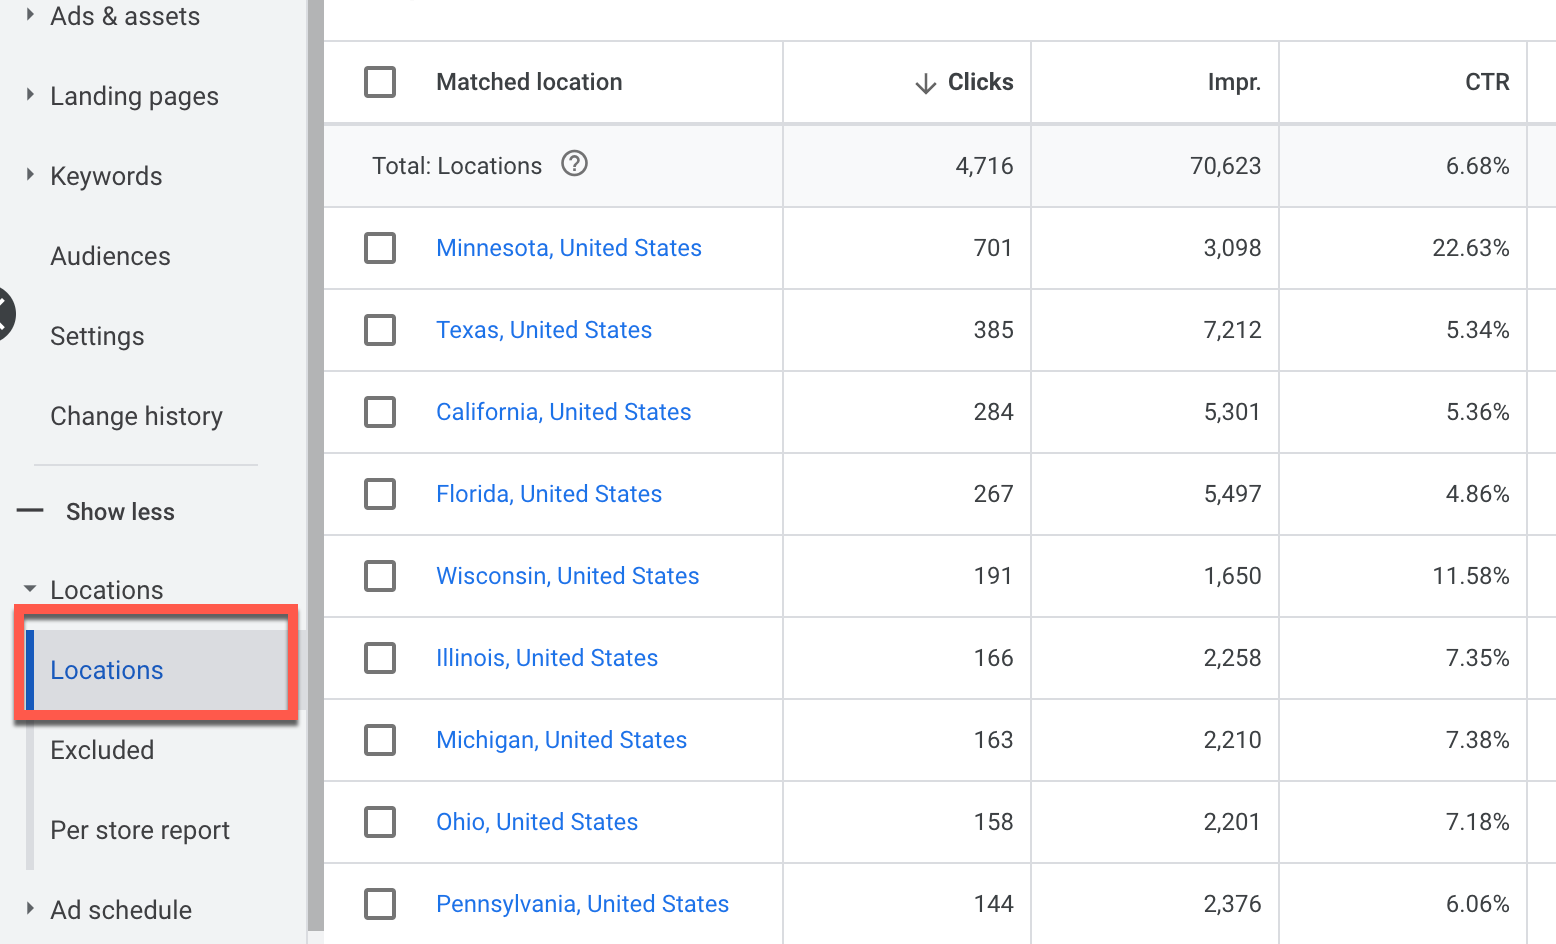
Google Ads location performanceScreenshot from Google Ads, August 2023

Remember, the more granular location targeting reduces reach but can be more efficient.

That’s why it’s important to see the reports to view results for the various geo segments and optimize.

6. Conversion Actions

With the recent launch of GA4, be sure to audit your conversion actions. Some things to look for:

  • Migrate goals in Universal Analytics to GA4 right away.
  • Confirm the conversion tracking is working.
  • Confirm that the primary conversion is your business’s key performance indicator (KPI).
  • Can you add new conversion actions to get richer information on PPC results?

Consider a variety of conversion actions.

For example: tracking purchases, email signups, whitepaper downloads, or chat interactions to get a full picture of the user’s engagement and actions with the website from ads.

Bonus Tip: How Often To Optimize?

When a campaign first launches, it will need to be monitored every day (or every few days) to identify red flags and fix those issues in real-time.

An example of this is errors in set-up or disapproved assets. You want the campaign to get to a stable place where the impressions, clicks, etc., look consistent with no red flags.

The campaign needs to acquire data, so don’t make any big changes until there is enough data to analyze.

This could mean thousands of impressions or clicks, or letting three to four weeks go by, depending on the volume allowed by the budget.

Final Thoughts

Because people never stop searching, there are always opportunities to improve an account through frequent and consistent PPC optimizations.

As always, if this post generated some new optimization ideas for you, add them to your strategy and test them out today.

More resources: 


Featured Image: The KonG/Shutterstock

Source link

Keep an eye on what we are doing
Be the first to get latest updates and exclusive content straight to your email inbox.
We promise not to spam you. You can unsubscribe at any time.
Invalid email address

SEO

WordPress Gives WP Engine Users A Reprieve

Published

on

By

WordPress WP Engine Repreieve

Matt Mullenweg posted on WordPress.org that WP Engine users have been granted a reprieve from the block on the WordPress plugin and theme repository until October 1st, allowing them to access updates as usual.

WordPress Versus WP Engine

Matt Mullenweg and popular web host WP Engine have been locked in a conflict for the past week over a commercial licensing fee that other web hosts pay but WP Engine does not. The issue between them stems from the frustrations on Mullenweg’s side with the perception that WP Engine is not giving back enough to WordPress in the way that they should. Prominent figures in the WordPress industry like Joost de Valk agree with Mullenweg that companies, including WP Engine, should give back more to WordPress.

WP Engine has offered their side of the story have gone as far as to send a formal cease and desist letter for what they perceive as an unfair attack on their business.

Regardless of who is right or wrong, WordPress users on WP Engine are caught in the middle of this conflict, with their businesses disrupted by Mullenweg’s decision to block WP Engine from accessing the WordPress.org plugin and theme repository, preventing them from updating plugins and themes.

Temporary Reprieve

Mullenweg posted on WordPress.org that he has heard from WordPress users and has decided to give the WordPress users a chance for WP Engine to set up a solution so that they won’t be inconvenienced. WP Engine has until October 1st to engineer a workaround.

He wrote:

“I’ve heard from WP Engine customers that they are frustrated that WP Engine hasn’t been able to make updates, plugin directory, theme directory, and Openverse work on their sites. It saddens me that they’ve been negatively impacted by Silver Lake‘s commercial decisions.

WP Engine was well aware that we could remove access when they chose to ignore our efforts to resolve our differences and enter into a commercial licensing agreement. Heather Brunner, Lee Wittlinger, and their Board chose to take this risk.

…We have lifted the blocks of their servers from accessing ours, until October 1, UTC 00:00. Hopefully this helps them spin up their mirrors of all of WordPress.org’s resources that they were using for free while not paying, and making legal threats against us.”

Read more at WordPress.org:

WP Engine Reprieve

Featured Image by Shutterstock/Vladimka production

Source link

Keep an eye on what we are doing
Be the first to get latest updates and exclusive content straight to your email inbox.
We promise not to spam you. You can unsubscribe at any time.
Invalid email address
Continue Reading

SEO

How to Estimate It and Source Data

Published

on

How to Estimate It and Source Data

Total addressable market (TAM) is an estimation of how much you could earn if you could sell your product or service to every possible customer in your market.

The basic formula for calculating TAM is:

TAM = (Total Number of Potential Customers) × (Average Annual Revenue per Customer)

Understanding TAM helps you figure out the size of your market and the amount of money you could make if you captured all of it.

TAM is also a key metric for startup investors. It shows whether a business idea has a big enough opportunity. Investors often look for a TAM that is “just right” — not too big or too small. A TAM that’s too large might mean the market is crowded with tough competition, while a TAM that’s too small could mean limited room for growth.

In this guide, you’ll learn how to estimate TAM using three methods, where people often make mistakes, and how to refine your estimations to make them plausible to investors or stakeholders and actionable for your business.

There are three approaches to calculating TAM. Depending on the available market data, your business model, and your stakeholders/investors, you should consider using the top-down, bottom-up, or value theory approach.

1. Top-down approach

The top-down approach starts with broad market data and narrows it down to estimate the market size for your specific product or service.

This approach is useful when there’s reliable, broad industry data available.

How to use

  1. Estimate the overall market size in which your product operates, usually obtained from industry reports or research.
  2. Apply a percentage that represents the portion of the market your product can realistically capture.

Example

If the global smartphone market is valued at $500 billion, and you are launching a new smartphone accessory, you might estimate that your product could target 5% of the market, which gives you a TAM of $25 billion.

2. Bottom-up approach

The bottom-up approach builds the TAM by starting with specific, individual data related to your business and scaling it up.

TAM: bottom-up approach.TAM: bottom-up approach.

This method is great when you have detailed knowledge of your customer base and pricing. As far as I know, investors prefer this method, which offers the most accurate and actionable TAM estimation.


A few birds in the hand is worth billions in the TAM. Early-stage (pre-Series-B) startups shouldn’t worry too much about calculating a precise TAM. As long as it’s in the right ballpark for their thesis, investors care a lot more about the traction you can show with paying customers. That’s why bottom-up is far more convincing than hand-wavy top-down methods that only rely on finding a big enough pie to claim as your market. 

Rob ChengRob Cheng

How to use

  1. Estimate how many potential customers there are in your target market. You can do this by using sources like industry reports, census data, or research from trusted organizations (more data sources at the end of the article).
  2. Multiply this number by the average revenue you expect to earn from each customer (ARPU – Average Revenue Per User).

Tip

To calculate ARPU, consider the pricing of your product or service, how frequently customers will purchase, and the churn rate.

For example, if you charge $100 per month for a subscription service, your monthly churn rate is 5%; on average, a customer might stay subscribed for around 6-7 months, meaning your average revenue per customer would be around $600-700.

Example

Let’s say you have subscription-based software that helps small businesses manage their finances. You identify that 2 million small businesses could benefit from your software. If your ARPU is $600, your TAM would be 2 million customers × $600 = $1.2 billion.

3. Value theory approach

The value theory approach estimates TAM based on the value your product provides to customers and how much they might be willing to pay for it.

TAM: value-based approach. TAM: value-based approach.

This approach is especially useful if you’re introducing a product or service that disrupts existing markets; traditional market size calculations may not accurately reflect the potential.

How to use

  1. Assess the value or cost savings that your product delivers to the customer.
  2. Estimate how much customers would be willing to pay for that value and scale it across the entire market.

Example

Suppose you have developed a new energy-efficient lighting system that saves companies $10,000 per year in energy costs.

If 100,000 companies could use your lighting system, and each is willing to pay $5,000 for it (because they’ll save $10,000), your TAM would be 100,000 companies × $5,000 = $500 million.

There’s also a fourth option — a middle ground mentioned by quite a few people who offered their insights for this article.


I’d say the best method to estimate TAM is usually a combination of top-down and bottom-up approaches. The top-down method gives you a big picture view using industry reports and market research, while bottom-up lets you build from the ground up using your own data and customer insights. This combined approach helps balance out the weaknesses of each method. 

Aaron WhittakerAaron Whittaker

You may encounter the TAM, SAM, and SOM terminology and need to apply it if an investor requests it.

People who prefer this approach treat TAM as a “pie in the sky” number and further refine it with SAM and SOM portions of it.

  • TAM (Total Addressable Market) is the total market if you could sell to everyone, everywhere. Your biggest possible opportunity.
  • SAM (Service Addressable Market) is the portion of the TAM you can actually target based on where you operate and who your product is for. For example, if you’re a local coffee shop in New York City, your SAM might be coffee drinkers in NYC, not every coffee drinker worldwide.
  • SOM (Service Obtainable Market) is the realistic piece of the SAM that you can actually win over, considering the competition and your strengths. Continuing with the coffee shop example, your SOM might be the number of customers you can realistically attract in your neighborhood, given factors like nearby competitors, your unique offerings, and marketing efforts.

TAM is typically used to make a compelling story about the potential for growth, so it’s easy to be over-optimistic and make mistakes that could make your TAM look better.

Here’s an example. I used a tool that calculates TAM automatically based on a URL to find the market size for netflix.com. The tool told me that there are 7B people who “need it (…) even if they’re not willing or able to make a purchase” and 6.3B ready to make a purchase. Something that I find hard to believe since there are an estimated 5.3B people with internet access worldwide.

Also, the way that the tool defines my potential customers doesn’t sound convincing to me, either, let alone logical.

Example of mistakes in calculating TAM.Example of mistakes in calculating TAM.

Other mistakes you should avoid:

  • Falling into the “everything trap”. This is when businesses assume that their product or service could appeal to everyone in the market, leading them to calculate TAM based on an overly broad audience.
  • Sizing the problem instead of the market. This happens when businesses focus on the total number of people who might benefit from their solution without considering how many are realistically willing to pay for it.
  • Overlooking market trends and dynamics. The market can grow or contract, consumer preferences can change, government regulations can influence the market, etc.

The basic data sources for TAM calculations are industry reports you can find on platforms like Statista and census data (like the US census data). However, there are other places where you can look for more detailed data.

Explore the market using search data

Search data is information about what people are looking for online. It can help you understand what customers want, where interest is growing, and what regions are most active.

Google Trends provides some of that data for free. For example, you can check if interest in a plant-based diet is still strong and where in the US you could find the most customers.

Using Google Trends for TAM.Using Google Trends for TAM.

But that’s how far this tool goes. You don’t know what terms are “inside” the topic or how popular a keyword is (the numbers in Google Trends are relative). Also, sometimes Google won’t have the data, just like for the term “baby food subscription”.

Using Google Trends for TAM.Using Google Trends for TAM.

Alternatively, you can use Ahrefs. I’m sure you’ll find more search terms there and a lot more data points. Let me take you through three examples.

Gauge demand with search volume

Search volume is an estimation of the average monthly number of searches for a keyword over the latest known 12 months of data.

High search volumes suggest a larger potential market. Low search volumes, suggest a smaller market (or that you will need to be more creative to find customers).

For example, while Google Trends didn’t have any data on “baby food subscription”, Ahrefs’ Keywords Explorer shows that there are an estimated 1.2K searches per month in the US of that term. Plus, it shows you the forecast for that keyword.

Example of keyword data useful for calculating TAM. Example of keyword data useful for calculating TAM.

If you’d be planning to start a new business in this niche, you’d need compelling arguments to justify a high TAM estimate, because the current demand for this type of service appears to be relatively low.

Learn what people want and how they look for it

Keyword research can tell you what people want in which countries. All you need to know is a few broad terms related to your product.

For example, for plant-based products, you could just type in “plant-based, vegan” and then go to the Matching terms report to see the popularity of certain types of products. You can also see if the demand for these products has grown or fallen over the last three months.

A selection of keywords with growth metrics. A selection of keywords with growth metrics.

So, if you find that the demand for most vegan products has increased, you could assume that your TAM is going to expand in the near future because more people seem to be interested.

You can also use the tool to automatically translate these keywords and see what search terms people use to find the same products around the world and how popular they are.

Automatic keyword translations in Ahrefs. Automatic keyword translations in Ahrefs.

And if you’re unsure what keywords people could use to find a product or service like yours, just use the AI suggestion feature.

Using AI in Keywords Explorer to find more ways people could look for a product or service online. Using AI in Keywords Explorer to find more ways people could look for a product or service online.

Learn from your competitors

By studying the keywords your competitors are targeting, you can uncover untapped niches or areas where demand is high but competition is lower.

For example, say you’re a SaaS company offering a project management tool. If you used Ahrefs’ Site Explorer, you would find that one of your competitors ranks for terms like “engineering project management software”. This could indicate a niche market with unique needs, where there’s considerable demand but less competition.

Using competitive keyword research to find  new niches. Using competitive keyword research to find  new niches.

While you’re at it, go to the Organic Competitors tab to see who else competes for the same audience. Chances are, you may find some new potential competitors.

Identifying organic competitors to refine TAM. Identifying organic competitors to refine TAM.

Use S-1 filings and quarterly reports from public companies

Public companies’ quarterly reports (10-Q) and S-1/F-1 filings offer rich data for estimating TAM. They provide detailed breakdowns of revenue by product line, geographic region, and market segment, along with insights into market share and growth potential.

For example, if a company generates $500 million from a particular service and claims 10% of the market, you can estimate the TAM at $5 billion.

Both reports can also provide guidance on future growth trends, helping forecast your TAM’s evolution.

You can use AI like ChatGPT to analyze the documents for you (they can be quite complex). Here’s a sample analysis of an over 500-page F-1 filing by an Esports company.

AI used to analyze an S1 document. AI used to analyze an S1 document.

Interview potential customers

While reports give you big numbers, talking to real people gives you the practical insights needed to adjust those estimates.

  • By speaking directly to customers, you can gauge whether they actually need your product and how likely they are to adopt it.
  • Interviews help you narrow down the customer segments most interested in your solution. Maybe not everyone is a fit, but if certain industries or company sizes show more interest, you can focus your TAM on those segments.
  • Asking customers what they’d actually pay for your product gives you real data. If you know what your target customers are willing to spend, you can multiply that by the number of similar customers to estimate your revenue potential and refine your TAM.

Use PitchBook for investment and market data

PitchBook offers broader market data and investment trends. It provides reliable information on market valuations, funding rounds, and industry growth, which helps you gauge the overall size and growth potential of a market.

PitchBook also helps identify key players, making it easier to estimate how much of the market is currently being captured and what remains untapped.

For example, based on Stripe’s post-valuation of $152 billion and an assumed 30% market share, Stripe’s TAM would be approximately $506.67 billion (TAM = valuation/market share).

Example of PitchBook data useful for estimating TAM.Example of PitchBook data useful for estimating TAM.

Other tools for SaaS companies

If you’re in SaaS, there are a couple more sources of data you may find especially useful: BuiltWith and Latka SaaS Database.

BuiltWith is a tool that shows you what technologies websites are using. This tool is great for identifying your ideal customer because you can see which companies use certain tools or platforms that align with your product.

Sidenote.

The Ideal customer profile (ICP) is a detailed description of the type of company or person who would benefit most from your product or service. It’s helpful mostly for a bottom-up approach to calculate market size, as it helps you focus on the specific segments of the market that are most relevant to your business. 

Enter a competitor into BuiltWith, and look for the list of their customers. For example, here are some of the sites that use Salesforce. You can sort the list by employees or traffic to find the size of the company you think you could get on board. 

Example of BuiltWith data useful for estimating TAM.Example of BuiltWith data useful for estimating TAM.

The next one is Latka SaaS Database. If you can’t find a SaaS company on PitchBook or BuiltWith, there’s a chance you will find it on Latka. It’s a SaaS-specific database that tracks metrics like revenue, customer growth, churn rates, and funding for thousands of companies.

Example of Latka's data useful for estimating TAM.Example of Latka's data useful for estimating TAM.

Knowing your competitors’ revenue and the number of customers they serve can help you better estimate the size of your potential market.

  • Use competitors’ ARPU or ACV (Annual Contract Value) to estimate your own future metrics.
  • Use the competitor’s revenue or valuation and apply a market share estimation to calculate TAM.

Final thoughts

Remember, TAM is ultimately an estimation. It’s natural to be slightly off, and you’ll probably need to reevaluate every year, after significant changes in the market or after introducing new products.


Generally, TAM calculations are not very accurate. At best, you’re relying on partially known variables (number of potential customers and average lifetime customer value). Industries also change so quickly that TAM calculations can become irrelevant within a matter of months.

James OliverJames Oliver

What’s perhaps more important than the exact number is the methodology behind your TAM calculation. A well-thought-out approach demonstrates how seriously you take the business and the effort you’ve put into understanding the market.

Got questions or comments? Find me on LinkedIn.

Source link

Keep an eye on what we are doing
Be the first to get latest updates and exclusive content straight to your email inbox.
We promise not to spam you. You can unsubscribe at any time.
Invalid email address
Continue Reading

SEO

9 Successful PR Campaign Examples, According to the Data

Published

on

9 Successful PR Campaign Examples, According to the Data

From Barbie-themed ketchup to exploding owl butts, these PR campaign examples prove that with the right data, timing, and a bit of creativity, you can win coverage and drive real, measurable results. 

In this post, you’ll see the data behind nine successful PR campaigns, and hopefully get some inspiration for your next press idea.

9 popular PR campaign examples

This list is a real mixed bag of PR examples – from newsjacking, to content repurposing, exclusive research, and kooky brand stunts – but one thing they all have in common is measurable success.

In each section, I’ll do a post-mortem of campaign performance, share some analysis tactics, and round-off with a couple of quick tips.

Sound good? Let’s jump in.

1. Heinz + Mattel “Barbiecue” PR campaign

Campaign 🍅👱🏼‍♀️🎀 Heinz Barbiecue
Brand(s) 🏷️ Heinz + Mattel
Links earned 🔗 62
Campaign type 📰 Newjacking/brand collab/product release
Global search volume 🔎 600 for “barbie ketchup”
Search growth (YoY) 📈 200% for “barbie ketchup”

Back in August 2023, when Barbiecore was all the rage, Heinz teased a mockup of two Barbie themed sauces: Kenchup and Barbiecue sauce.

Eight months later, for Barbie’s 65th anniversary in April 2024, Heinz and Mattel dropped the official Barbiecue special edition sauce.

A screenshot of Barbiecue launch from Heinz on TikTok highlighting video engagementA screenshot of Barbiecue launch from Heinz on TikTok highlighting video engagement

Heinz first conceived of the PR stunt to build intrigue around the product months before it hit the shelves, then used public response as a litmus test for its success.

According to their submission in the Shorty Awards, they carefully coordinated their initial “teaser” drop to coincide with an uptick in audience discussions, following the film’s release.

Heinz Shorty Awards quote on the timing of their Barbiecue PR campaignHeinz Shorty Awards quote on the timing of their Barbiecue PR campaign

To date, the Barbiecue PR campaign has earned Heinz 118 relevant mentions in top-tier media outlets like Bloomberg, Yahoo, CBS News, and The Standard, according to Content Explorer.

A screenshot of Ahrefs Content Explorer highlightin 118 mentions of Heinz BarbiecueA screenshot of Ahrefs Content Explorer highlightin 118 mentions of Heinz Barbiecue

With zero dollars in paid promotion, it also generated 38 million organic social impressions and doubled average engagement rates.

Quick learnings

  • Hijack trending cultural “moments”
  • Time your PR campaign launch with peak online conversation
  • Use teaser PR to gauge consumer demand and fuel future R&D decisions 

Campaign 🛀 Saltbomb
Brand 🏷️ Lush
Links earned 🔗 142
Campaign type 📰 Newjacking/product release
Global search volume 🔎 1.3K for “lush saltburn bath bomb”
Search growth (YoY) 📈 37K% for “lush saltburn bath bomb”

This is another great PR example of a brand capitalizing on a film, and waiting for post-event discussion to pick up before newsjacking.

Following a veerryy controversial bath scene in the film Saltburn, UK cosmetics retailer, Lush, jumped on the opportunity to insert their brand into a cultural moment.

In February 2024, three months after the film’s release, they released the “Saltbomb”, a special edition, Saltburn-themed bath bomb.

Parodying some of the film’s most risqué moments, Lush didn’t hold back with their product marketing.

A screenshot of Lush's Saltbomb product pageA screenshot of Lush's Saltbomb product page

And we loved it.

The campaign led to 135 links, many coming from high DR (Domain Rating) publications, driving real, tangible organic traffic – including Global News, New York Times, Pop Sugar, and BBC.

Ahrefs Backlinks report showing 135 press links for Lush's Saltbomb newsjacking PR campaignAhrefs Backlinks report showing 135 press links for Lush's Saltbomb newsjacking PR campaign

Press coverage actually went above and beyond this, because Lush’s products are part of a few publisher affiliate programs – but affiliate links are a little trickier to track.

Here’s an example of what I mean.

The site Allure wrote up a feature piece on the Lush bath bomb, but their affiliate link navigates to a third-party platform before redirecting to Lush’s product page.

A screenshot of an affiliate link from Allure to LushA screenshot of an affiliate link from Allure to Lush

For that reason, the link doesn’t show up in Ahrefs’ Backlinks Report.

Ahrefs Backlinks report showing zero links from Allure to LushAhrefs Backlinks report showing zero links from Allure to Lush

Instead, I found it by monitoring campaign-specific keywords in Content Explorer.

Ahrefs Content Explorer showing press coverage from Allure for Lush Saltburn Bath BombAhrefs Content Explorer showing press coverage from Allure for Lush Saltburn Bath Bomb

Beyond press and affiliate publicity, the Lush PR campaign was a winner on social media.

The photography and product descriptions made it perfect for meme-ification, which added thousands of views and impressions.

A landing page on TikTok for "Saltbomb Lush" with high view-count videos highlightedA landing page on TikTok for "Saltbomb Lush" with high view-count videos highlighted

It also won big in search, with global keyword volume reaching 1.3K…

Ahrefs Keywords Explorer showing 1.3K Global Search Volume for "Lush Saltburn Bath Bomb"Ahrefs Keywords Explorer showing 1.3K Global Search Volume for "Lush Saltburn Bath Bomb"

And the product landing page earned up to 800 monthly organic visits in its first month.

Organic traffic in Site Explorer for Lush's Saltbomb product pageOrganic traffic in Site Explorer for Lush's Saltbomb product page

Traffic has remained steady since, averaging between 500 – 600 monthly visits, despite the product having been archived – pretty good going for a bit of trendjacking.

Quick learnings

  • Scout for affiliate links – you won’t always know when a publisher plans to use an affiliate link, so searching for mentions of campaign keywords can help you find any affiliate coverage that has flown under the radar.
  • Think about how your brand and its tangential topics can tie into cultural moments. 

Campaign 👴🏻 Eclectic Grandpa
Brand 🏷️ Pinterest
Links earned 🔗 98
Campaign type 📑 Report
Global search volume 🔎 4.8K for “eclectic grandpa”
Search growth (YoY) 📈 215K% for “eclectic grandpa”

Every year, Pinterest taps into their internal platform search data to post their trend forecasts in what is known as “Pinterest Predicts”.

Posting on Pinterest For Business (the company’s commercial arm), they categorize related high-growth searches, and assign them novel trend names like “Eclectic grandpa”, “Bow stacking” or “Cafe core”.

A screenshot of Pinterest Predicts Eclectic Grandpa trend pageA screenshot of Pinterest Predicts Eclectic Grandpa trend page

I took a look at the Site Structure report, and found that Pinterest’s most linked trend was in fact the “Eclectic Grandpa” which – in Pinterest’s words – is all about:

“Embracing ‘grandpa core’ and bringing eccentric and expressive elements for the ages to wardrobes. Think retro streetwear, chic cardigans and customised clothing. Because the coastal grandma aesthetic is so last year.”

To date, the trend has earned citations from 98 separate domains.

Ahrefs Site Explorer screenshot of Pinterest Business showing 98 links for trend "Eclectic Grandpa"Ahrefs Site Explorer screenshot of Pinterest Business showing 98 links for trend "Eclectic Grandpa"

A look at the Backlinks report revealed coverage from Vogue, Elle, Who What Wear, New York Post, and Business Insider.

Ahrefs Backlinks report showing 121 press links for Pinterest's Eclectic Grandpa trendAhrefs Backlinks report showing 121 press links for Pinterest's Eclectic Grandpa trend

And it didn’t end there. The “Eclectic Grandpa” gets about a bit, cropping up 340 times in the articles I discovered via Content Explorer.

Ahrefs Content Explorer showing Eclectic Grandpa mentions in top press publicationsAhrefs Content Explorer showing Eclectic Grandpa mentions in top press publications

A considerable number of those DR 50+ mentions (150, to be precise) went unlinked based on Ahrefs’ Unlinked Mentions filter/export – links which could still be claimed by the Pinterest team.

Ahrefs Unlinked Mentions Export for Pinterest "Eclectic Grandpa" mentionsAhrefs Unlinked Mentions Export for Pinterest "Eclectic Grandpa" mentions

Given the far reaching coverage, searches for “Eclectic Grandpa” keywords have shot up in the last year, growing to 4.8K global search volume (GSV). 1727474178 642 9 Successful PR Campaign Examples According to the Data1727474178 642 9 Successful PR Campaign Examples According to the Data

By creating link magnet content, Pinterest has managed to drum up huge publicity – whether they pitched for it or not – making it a great example of a successful PR campaign.

Quick learnings

  • Mine company data to publish new, unseen trends and insights.
  • Come up with a unique name for self-discovered trends and/or theories so it’s easier to monitor uptake and keep track of press coverage.
  • Track mentions – not just links – and claim any unlinked mentions to enhance SEO and brand authority.

Real estate marketplace, Zillow, surveyed 1,815 homeowners and found that those with lower mortgage rates are twice as likely to stay put vs selling their home.

By creating firsthand research tackling an issue close to their audience’s heart, Zillow earned 235 backlinks from the likes of Bloomberg, Yahoo, FoxBusiness, and Money.com.

Ahrefs Backlinks report showing 235 press links for Zillow's Rate-locked Homeowners reportAhrefs Backlinks report showing 235 press links for Zillow's Rate-locked Homeowners report

Sites referenced the survey for multiple reasons; not just quoting one stat, but a whole variety, as evidenced in the anchor text of their backlinks.

Ahrefs Backlinks report showing anchor text variety for Zillow's Rate-locked Homeowners reportAhrefs Backlinks report showing anchor text variety for Zillow's Rate-locked Homeowners report

Quick learnings

  • Conduct your own surveys, asking questions which address a key problem in your industry, then quantitatively analyze the responses.
  • Tease out multiple hard hitting stats to drive more coverage and link variety.

Campaign 🔮👨‍💻 Future of Work
Brand 🏷️ LinkedIn
Links earned 🔗 383
Campaign type 📑 Report
Global search volume 🔎 300 for “LinkedIn report”

LinkedIn tends to keep their data under lock and key, but in their Future of Work report they released proprietary insights on the growth of AI conversations on the platform, plus the impact of AI on careers.

A great example of exclusive PR, LinkedIn’s report made a splash, landing 383 links in Forbes, Microsoft, Harvard Business Review, and CNET.

Ahrefs Backlinks report showing 383 press links for LinkedIn's Future of Work reportAhrefs Backlinks report showing 383 press links for LinkedIn's Future of Work report

Quick learnings

  • Think about what unseen or underground data you can harvest to generate exclusive research for your next PR campaign.
  • If you have internal data, analyze patterns and trends to carve out a totally unique angle..

Tip

Look at your internal site search data in GA4 (thanks to Mark Williams-Cook and Julius Fedorovicius for the tip!) or any other firsthand information at your disposal, to mine insights. 1727474181 615 9 Successful PR Campaign Examples According to the Data1727474181 615 9 Successful PR Campaign Examples According to the Data If you can’t make use of primary data, tap into third-party sources. PR expert, Matt Seabridge, routinely shares some great data sources and PR campaign examples on LinkedIn – I really recommend giving him a follow. 1727474181 397 9 Successful PR Campaign Examples According to the Data1727474181 397 9 Successful PR Campaign Examples According to the Data

Personal finance company, WalletHub, compared the 150 largest metropolitan statistical areas, or MSAs, across 11 key metrics.

Combining primary data with third-party sources like the U.S. Census Bureau, GreatSchools.org, and Yelp, WalletHub created an interactive study ranking the most and least educated cities in America.

A screenshot of WalletHub's Most and Least Educated Cities StudyA screenshot of WalletHub's Most and Least Educated Cities Study

This is an example of a PR campaign that doubles as great content marketing.

It snagged 604 unique backlinks from heavy hitters like Wikipedia, Forbes, Business Insider, Bloomberg, and Yahoo – as well as tons of state publications.

Ahrefs Backlinks report showing 604 press links for WalletHub's StudyAhrefs Backlinks report showing 604 press links for WalletHub's Study

Location based PR campaigns are an especially powerful form of PR, since they have both local and national appeal.

Here’s Tom Chivers, PR Expert and Founder of Sabot, explaining why localization really works for public relations campaigns – with a great additional point made by Co-Founder of Journo Finder, Veronica Fletcher.

Tom Chivers' LinkedIn post on the power of localized PR campaignsTom Chivers' LinkedIn post on the power of localized PR campaigns

Quick learnings

  • Use superlatives in headlines (e.g. “Most”, “Least”, “Best”).
  • Embrace ranking formats – comparisons make readers want to click to see how they size up.
  • Slice and dice your data by location to get your campaign syndicated in both national and local publications.

Campaign 🍩 “Go USA” and “Passport to Paris” doughnuts
Brand(s) 🏷️ Krispy Kreme
Links earned 🔗 95
Campaign type 📰 Newjacking/brand collab/product release
Global search volume 🔎 45K for “Olympics Krispy Kreme Doughnuts”
Search growth (YoY) 📈 4.4M% for “Olympics Krispy Kreme Doughnuts”

Krispy Kreme rode the wave of Olympic interest this year by developing two special edition doughnuts: “Go USA” and “Passport to Paris”.

As we’ve seen already, popular PR campaigns don’t always neatly track back to the sources you’d expect them to.

Krispy Kreme earned only 11 links to their USA doughnut press release, and 20 to their Paris doughnut launch announcement. Not exactly groundbreaking.

But when you filter for mentions of campaign keywords (e.g. “Go USA” and “Paris”) at the domain-level, you find a whole lot more coverage; 95 links, to be precise, from major publications like Yahoo, USA Today, People, and the Food Network.

Ahrefs Backlinks report showing 86 press links for Krispy Kreme's Olympic Doughnuts campaignAhrefs Backlinks report showing 86 press links for Krispy Kreme's Olympic Doughnuts campaign

The special edition doughnuts also drive a cool 45K monthly searches, according to the Matching Terms report in Keywords Explorer.

Ahrefs Matching Terms report showing 45K search volume for olympic krispy kreme doughnutsAhrefs Matching Terms report showing 45K search volume for olympic krispy kreme doughnuts

Quick learnings

  • Capitalize on high demand around recurring events.
  • For campaigns that can’t be neatly tracked (e.g. no specific landing page, or product page) pay closer attention to homepage or domain-level links through clever filtering.

Campaign 🍟👞 McDonald’s + Crocs Collaboration
Brand(s) 🏷️ Crocs + McDonald’s
Links earned 🔗 516
Campaign type 📰 Brand collab/product release
Global search volume 🔎 18K for “mcdonalds crocs”
Search growth (YoY) 📈 838% for “mcdonalds crocs”

This next PR example is a campaign of multiple parts. It began with a pair of McDonald’s themed Crocs, and has extended to a full blown footwear collection…

A screenshot of the crocs and mcdonald's product collection pageA screenshot of the crocs and mcdonald's product collection page

And a novelty product: McDonald’s happy meal mini-crocs keyring.

Press photo of McDonald's and Crocs happy meal toyPress photo of McDonald's and Crocs happy meal toy

The coordinated PR campaign has generated huge awareness for both brands, but tracking all the fragmented assets is no mean feat.

To get a better idea of overall brand awareness, I opted instead to search for co-citations at the domain level.

Searching in the Backlinks report, I applied filters for each brand name in the other’s backlink profile.

A side by side comparsion of press mentions for crocs and mcdonald'sA side by side comparsion of press mentions for crocs and mcdonald's

McDonald’s earned 260 links for “Crocs” related content, but Crocs was the real winner, landing 416 links for “McDonald’s” related press from media goliaths like Business Insider, Fast Company, and Entrepreneur.

From studying the campaign’s individual assets, I noticed something interesting: social posts have the ability to attract links.

Take for instance, this UGC post by Instagram food account, Snackolater. It landed 24 backlinks after sharing news of the happy meal mini-croc launch.

Ahrefs Backlinks report showing 24 press links for an instagram post on the mcdonalds and crocs collabAhrefs Backlinks report showing 24 press links for an instagram post on the mcdonalds and crocs collab

It had never occurred to me to track social media posts for links, but you can never tell how a journalist is going to reference your campaign, so it’s worthwhile setting up a backlink alert for all your assets just in case!

The growth of brand searches is a real testament to the success of a PR campaign, and this collaboration definitely delivers on that front.

Audiences are searching for relevant McDonald’s + Croc based keywords a total of 37K times a month on average, based on data in Keywords Explorer.

1727474190 432 9 Successful PR Campaign Examples According to the Data1727474190 432 9 Successful PR Campaign Examples According to the Data

Quick learnings

  • Sometimes, the “side” brand in a collaboration can snag more links. Keep that in mind for your next PR partnership.
  • With two brands there are double the assets to track, including product pages, press releases, landing pages, and various social posts – make sure you have purview over the performance of all moving parts to track public relations campaigns holistically.
  • Don’t forget to report on social posts, not just for impressions/engagement but for links.

Campaign ❎🍑 Do your lesson, no buts
Brand(s) 🏷️ Duo Lingo
Links earned 🔗 130
Campaign type 📽️ Advert
Global search volume 🔎 250 for “Duolingo commercial”
Search growth (YoY) 📈 376% for “Duolingo commercial”

Duolingo leaned into their weird yet wonderful brand of marketing with a hilarious superbowl ad featuring Duo, the brand’s menacing owl character.

In 5 (wild) seconds, we witness the explosion of Duo’s butt, and the growth of a mini Duo in its place, accompanied by a reminder to do our Duo Lingo lesson.

The ad creative was repurposed from a widget design that went semi-viral – Duo Lingo knew it worked, so they built on it.

And in a stroke of coordinated PR genius, they simultaneously sent out a push-notification to app users as soon as the ad went live.

A photo of a Duo Lingo reminderA photo of a Duo Lingo reminder


“We decided to pair the ad with a coordinated push notification, which would hit learners’ phones right after the commercial aired, reinforcing the idea that Duo is always watching 👀.”

The YouTube commercial has earned 5M views and 130 links from Gizmodo, Lifehacker, and Indy100.

Ahrefs Backlinks report showing 118 press links for Duo Lingo's Superbowl AdvertAhrefs Backlinks report showing 118 press links for Duo Lingo's Superbowl Advert

Plus 24M plays on TikTok.

Screenshot of duolingos no buts PR campaign views on TikTokScreenshot of duolingos no buts PR campaign views on TikTok

The Duolingo team have written up a seriously funny play-by-play of the PR campaign here – they talk about everything from the lengths they went to to get the right “shine” on Duo’s buttocks, to carefully selecting the perfect fart sound effect. I recommend reading it, for a giggle if nothing else.

Quick learnings

  • Upcycle owned content that has worked well in the past for your next PR campaign.
  • Try a mixed-message approach to really drive the point of your campaign home.

How I found these PR campaign examples (and you can too)

I spent a lot of time:

There were so many awesome examples of PR, but I narrowed it down to the ones that drove either press mentions, links, search volume, traffic, or all of the above.

Final thoughts

The best PR campaigns aren’t just about links. They’re about creating conversations, driving awareness, and making a lasting impact on your audience.

Here’s a quick recap of some of the top takeaways:

  • Time it right: Launch your campaigns when conversations peak
  • Tap into unique data: Use exclusive insights to stand out
  • Track holistically: Monitor links, mentions, searches, and social
  • Rank and compare: Engage multiple audience “tribes” through rankings
  • Take a local angle: Analyze multiple locations to win more press
  • Collaborate creatively: Brand partnerships can amplify your reach
  • Repurpose winners: Turn successful content into new campaigns

Success is predicated on a campaign meeting its goal(s), and while we don’t know exactly what these brands set out to achieve, their campaigns have enjoyed results that most of us would be pretty happy with.

Hopefully they’ve given you some inspiration for your next project.


Source link

Keep an eye on what we are doing
Be the first to get latest updates and exclusive content straight to your email inbox.
We promise not to spam you. You can unsubscribe at any time.
Invalid email address
Continue Reading

Trending