PPC
9 Best Practices for LinkedIn Retargeting That Cut Costs & Drive Conversions

LinkedIn is a fantastic channel for reaching your target audience. It has robust targeting options that can help you reach potential customers in many different ways. It’s also a great channel for retargeting.
An example of a LinkedIn Ad.
But LinkedIn is also an expensive channel to remarket on. At first, reaching back out to users who have already engaged with you at a premium price might feel counterintuitive. However, there are some best practices you can follow to make sure you’re making the most of your money. Today, I’m going to share my secrets to a cost-effective, successful LinkedIn retargeting strategy.
9 crucial LinkedIn retargeting tips
Follow these key LinkedIn retargeting best practices for maximized results:
1. Use audiences from all available sources
The first priority when creating a remarketing strategy is to ensure you’re including as many people as possible. Although a website visitor audience is a common target, it doesn’t tell the whole story. Just because someone hasn’t engaged with your website doesn’t mean they aren’t familiar with your brand.
In the LinkedIn Ads platform, you can create audiences from a number of different sources, and each one has a role to play. Here’s the list of options you’re presented with when you click to create a new audience on LinkedIn:
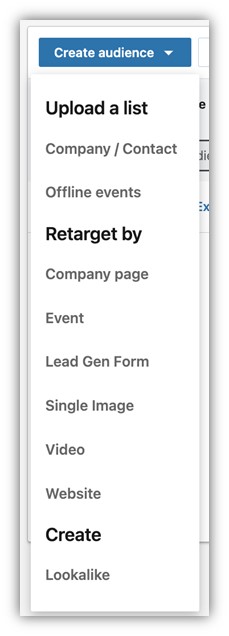
There’s quite a bit more than just website retargeting.
The first group is where you can upload customer information you have already, whether it’s a contact list, company list, or data from offline events. Each of these lets you reach users you’re already aware of after matching to them on LinkedIn, whether they’ve been to your site recently or not.
In the “Retarget by” section, the majority of options have nothing to do with your website. Instead, they focus on how a user engaged with your brand on LinkedIn.
Did they engage with your company page, an event you sponsored, did they open and/or submit a lead gen form? What about creatives? Did they click on a single image ad or did they view one of your video ads for a certain amount of time?
These are important touchpoints for you to consider when you’re trying to find brand-aware users to include in your lists. If you’re not including these users in your LinkedIn retargeting strategy, you’re missing out on a potentially powerful audience to target.
2. Audience size impacts your advertising costs
Aside from simply missing a wide group of users to engage with, there’s another reason you should want to include more users in your retargeting strategies.
On the LinkedIn Ads platform, the larger your audience size, the lower the cost of reaching those users.
Here’s a quick example of two audiences we could use that target people in the PPC space:
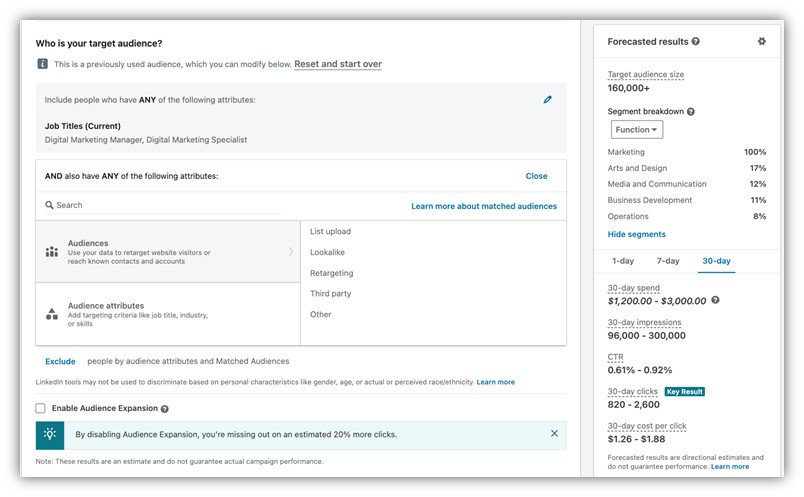
This first audience is just two job titles across the US: Digital Marketing Manager and Digital Marketing Specialist. The audience size is 160,000 and the expected cost per click range is between $1.26 and $1.88.
However, you’ll notice below that when I expand the list to include people with member groups in line with PPC, the visual changes a bit:
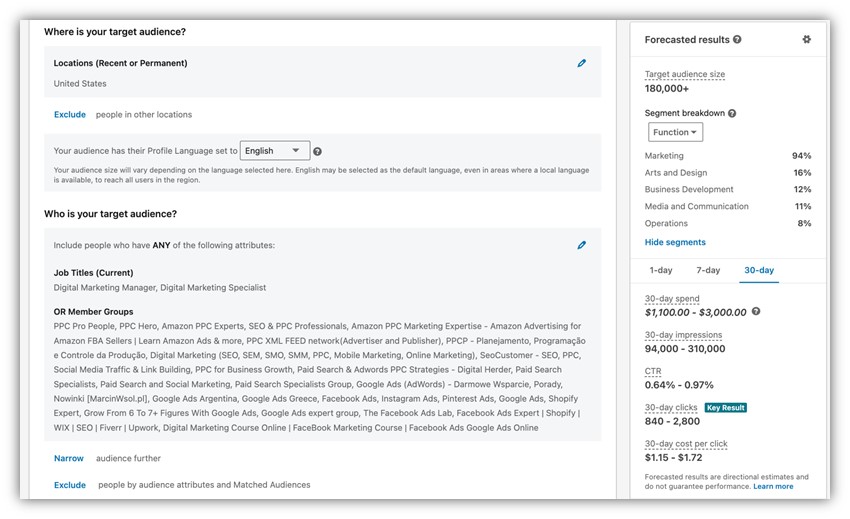
While I was only able to expand the target audience to 180,000, you can see that the estimated cost-per-click range did come down slightly to $1.15 to $1.72. While this might not seem like a big shift, every little bit adds up when you’re running LinkedIn ad campaigns.
The flip side of this coin is that although you’re keeping costs down, you could be diluting your audience if you expand too far. You don’t want to simply add users without considering their value to your campaigns. If that’s the case, you stick with the slightly higher costs and more specific audience to ensure your campaigns are achieving your goals.
3. Keep exclusion audiences updated (including lead gen ads)
Similar to my point above, if you’re adding users to your audience just to make them larger, but not targeting the right people, then you’re likely not achieving your campaign goals.
Excluding the right people from your campaigns can be just as impactful as targeting the right ones. Each of the audience types shown above can be used for targeting in campaigns, but they can also be used for exclusion as well.
Depending on the goal of your LinkedIn retargeting campaign, make sure you’re using all of the list types above to exclude users who have already taken those actions.
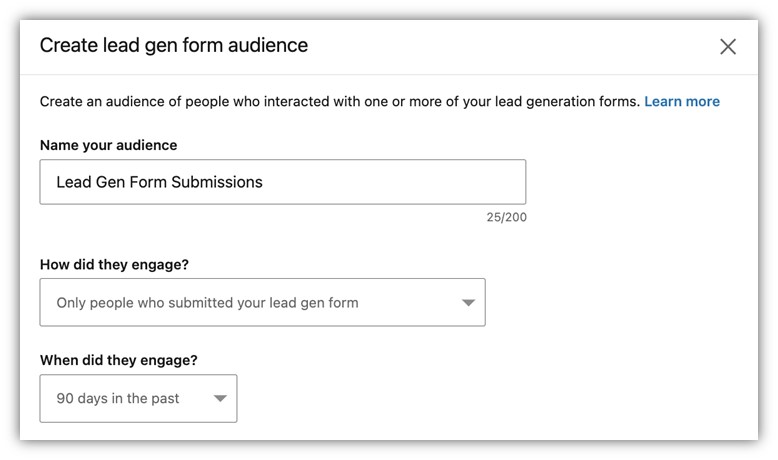
One of my favorites here is the LinkedIn lead gen form exclusion. As you can see below, you can make a list of users who opened and submitted a lead form in your LinkedIn Ads campaigns. This is clearly a lead, so if your retargeting campaign is designed to generate the same type of lead, you should likely be excluding all lead gen form submitters from your campaign.
4. Use multiple ad formats (including text ads)
When retargeting users with LinkedIn ads, you have to remember that those folks have already engaged with your brand in one way or another. However, it’s almost impossible to have a succinct picture of every single user’s journey.
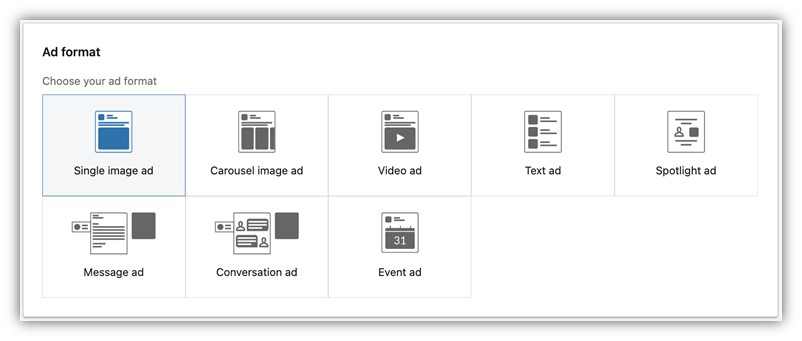
Using multiple ad formats allows you to continue to reach your LinkedIn retargeting audience in new and unique ways, even if the content of the ad itself isn’t drastically different. (We’ll get to that in a minute.)
Each ad format has its own specifications and requires different things, so if you’re interested in getting a better rundown of those, you can watch this video.
That said, one ad format has always been my favorite for retargeting and I use it every time I retarget on LinkedIn: Text Ads.
While Text Ads might not be the most visually appealing format on LinkedIn, they can be great tools for retargeting ads. Unlike In-Feed Ads, Text Ads show up on the right-hand side of the LinkedIn interface.
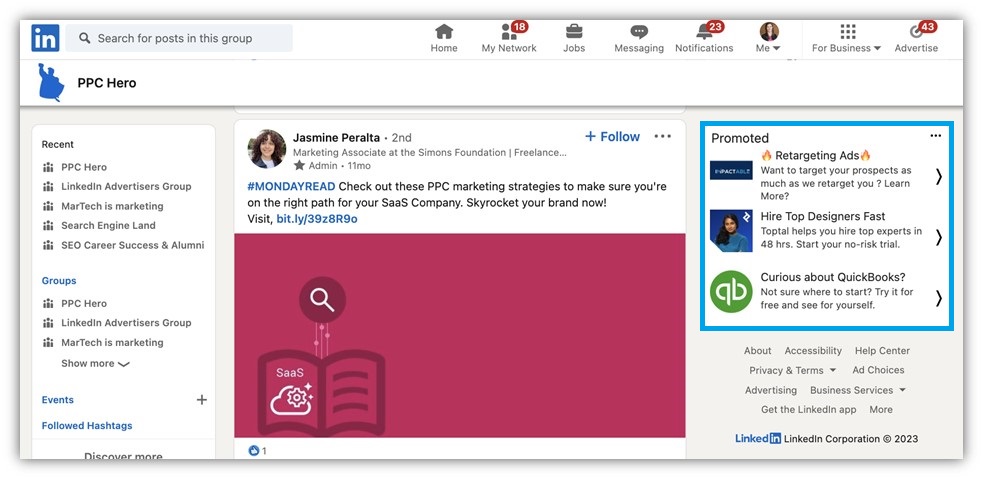
They’re smaller, require a very different image type (typically just a logo or single point of focus shot) since it’s so small, and the text is limited. Also, most users don’t see them because they don’t show up on all screens in the interface.
So, to set your expectations, text ads typically have high impression counts, low clicks, and pretty terrible click-through rates. While that sounds bad, Text Ads also (in my experience) tend to have much lower CPCs than any In-Feed format. Conversion rates may be a little lower as well, but the overall cost per acquisition is typically much lower than with other formats.
So while text ads might only drive smaller amounts of incremental conversions, they’re also typically cheaper, which is never going to disappoint me.
5. Mix up calls to action until you find what works best
Just like with ad formats, it’s important to change up the call to action you’re using until you find the sweet spot for your different audiences.
Using the same call to action as your original campaign typically isn’t a good idea. If the user didn’t take action on it the first time, what makes you think they will the second time?
Additionally, LinkedIn retargeting is a bit of a different beast than other channels. Typically, very low funnel actions such as purchase or demo requests don’t work too well here. On this channel, we need to target the middle of the funnel.

Why the middle and not the top? For a couple of reasons. First, these users are already familiar with you to some degree, so a high-level brand awareness impression isn’t really necessary. Second, paying LinkedIn’s high prices for those brand awareness messages simply doesn’t make sense. If you want to generate a bigger audience with those messages, use them either on another platform or targeting net new users on LinkedIn.
6. Control your rotation settings for your goals
Did you know that LinkedIn has a rotation setting for your ad creatives? If you don’t, no worries. A lot of people aren’t aware of it because it’s a little hidden in the interface.
In each campaign, on the ads setup tab in the editor, you’ll find this gear icon at the top of the page.

When you click on it, you’ll be given the option to either optimize ads or rotate evenly.
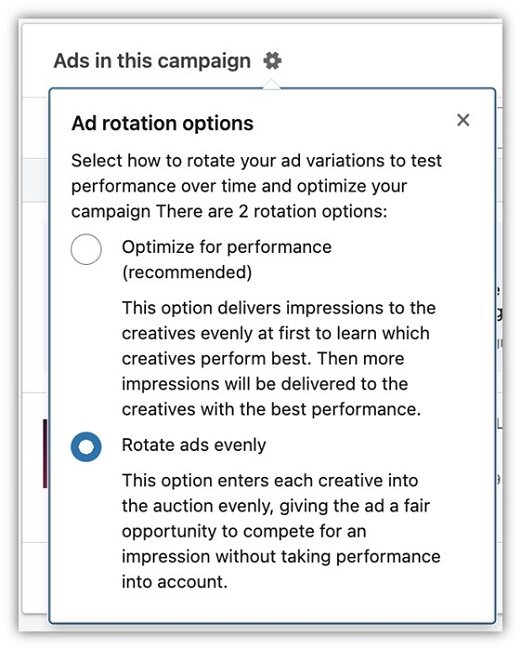
Personally, I like to rotate ads evenly so I get to decide which metrics are most important to me. If you use optimize, your ads will rotate in the beginning but will start to favor certain ads over time based on their performance.
Optimize might not sound bad, but my suggestion is for you to test what works best in your accounts. Despite being called “optimize” and trying to prioritize the ads with “best performance,” the optimize setting doesn’t always return the best results in my experience.
7. Always include five ads for full coverage
On the same tab in the interface, you’ll see a message that tells you to “create five ads to improve performance.”

It suggests you should create five ads in your campaign so as to get a higher LinkedIn Ads performance. I agree with that on its own merits, but also because, at least for sponsored content ads, five is a magic number when it comes to ad impression counts.
For sponsored content, if you have five ads in your campaign, you can show all five to each user in your audience over a 48-hour period. If you only have three to four ads, you’ll only get three to four impressions for that same 48-hour period.
Other formats have differing impression counts for their respective frequency caps, but I used sponsored content as it seems to be the most popular.
If you’re interested in using all the other formats and want a rundown on the number of creatives to use, check out this episode of the LinkedIn Ads Show with AJ Wilcox.
8. Monitor reach and frequency to avoid ad fatigue
Even with frequency caps and proper audience sizes, it is still possible to wear out your welcome with certain audience members when practicing LinkedIn retargeting. Two metrics that can help with that are Reach and Frequency.
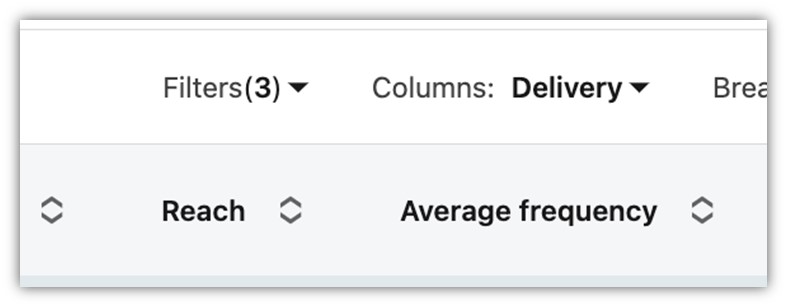
Reach is the number of unique users your ads were shown to during a given time frame. Frequency is the average number of times each user saw those ads during that same time period.
You can find these numbers by adding their columns individually or by using the preset Delivery columns option.
Your mileage may vary on how far you can push these stats for your audience. I suggest checking on them whenever you’re not seeing a good performance or if your creatives have been running for a while. It might be time to change up ad formats, messaging, the call to action, or some combination thereof.
9. Use manual bidding (and bid through the floor)
My last suggestion for your LinkedIn retargeting campaigns is focused on trying to make your clicks as inexpensive as possible.
In each campaign type, you can choose manual bidding as an option instead of max delivery or another strategy that’s the default. This allows you to choose what you want to bid in the auction for an ad impression.
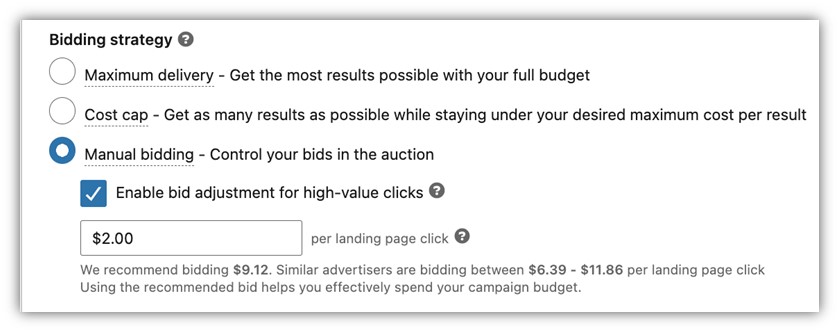
I typically always start with a very low number, knowing that I will miss out on a few impressions, but also knowing that I will get the lowest average cost per click possible for my target audience.
Over time, if performance is strong, I can get more volume by increasing my bid and winning more auctions. This is the tried and true bidding strategy that I use in all of my LinkedIn ad campaigns and it works even better for retargeting.
Create LinkedIn retargeting campaigns that thrive
At first glance, LinkedIn retargeting doesn’t always seem like a go-to strategy for businesses looking to grow. However, these best practices will give you the best chance to see good returns for your audiences. While LinkedIn Ads can be a more expensive ad platform, leveraging my top LinkedIn remarketing tips can help you cut costs and maximize your marketing ROI.
To recap, here are those nine LinkedIn retargeting best practices again:
- Use audiences from all available sources
- Audience size impacts your advertising costs
- Keep exclusion audiences updated (including lead gen ads)
- Use multiple ad formats (including text ads)
- Mix up calls to action until you find what works best
- Control your rotation settings for your goals
- Always include five ads for full coverage
- Monitor reach and frequency to avoid ad fatigue
- Use manual bidding (and bid through the floor)
PPC
86 Summer-Ready June Content Ideas

June marks the official start of summer, opening up many creative ways to connect with your audience. Throw in June’s holidays, summer solstice, and a bounty of food-themed days of appreciation (we’re looking at you, National Doughnut Day), and your June content calendar runneth over.
With all that fun in mind, we’ve gathered dozens of creative June content ideas. From entertaining videos to educational emails, you’ll find plenty of inspiration to fill this month’s content calendar.
Contents
💡 Want an entire year’s worth of marketing ideas? Download The Mega Must-Have Marketing Calendar.
June holiday content ideas
Although this month does not have any tentpole holidays like Thanksgiving or Christmas, there are several June holidays worth celebrating.
Father’s Day (June 16)
Great parents should be celebrated every day, but let’s face it, they’re often in the background doing the hard work most people don’t see. That’s why we celebrate Mother’s Day in May and Father’s Day in June, so these often unsung heroes get a little of the recognition they deserve.
If you want to get a gift for a dad with no strings attached, buy them a broken guitar (cue the groan). But seriously (sort of), Fire Department Coffee found a fun way to celebrate Father’s Day with an Instagram Reel full of dad jokes.
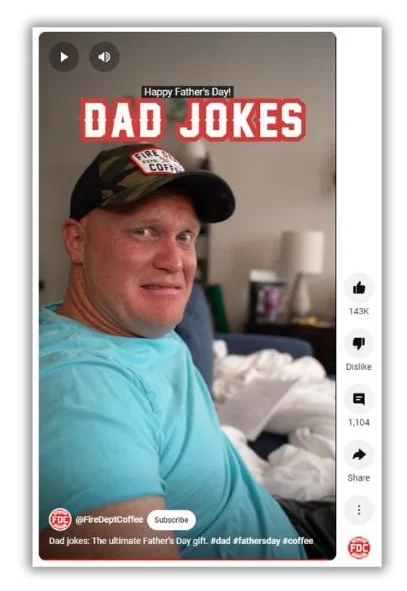
This is a low-lift way to have a little fun with your audience while keeping in the spirit of Dad’s big day.
Here’s another thing to be aware of. Father’s Day can be a difficult time for some people. If you’re running a Father’s Day email campaign, give your subscribers a way to opt out.
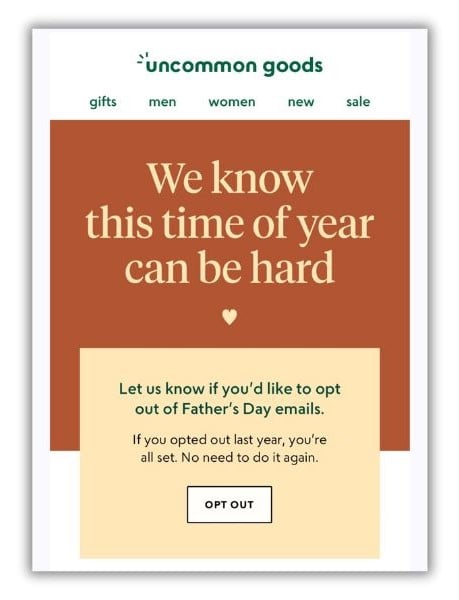

here are several other June content ideas geared toward dads and the people who care about them:
- Have a dad joke competition on social media.
- Get dads to comment describing their favorite way to spend Father’s Day.
- Write a blog post listing local Father’s Day discounts and events.
- Share a heartfelt shout-out to everyone who has lost their father, stepped in as a father figure, hopeful dads facing fertility issues, and fathers who have lost a child.
👋 Email is one of the best marketing channels available. Use The Complete Email Marketing Toolkit (Free Email Templates, Subject Lines, & Tips) to make the most of it.
Juneteenth (June 19)
On June 19, 1865—more than two years after President Lincoln signed the Emancipation Proclamation—Union troops arrived in Galveston Bay, Texas, the final holdout for the practice of slavery in the US. On that day, 250,000 enslaved Africans were finally granted their freedom. We now commemorate the history of that day as Juneteenth, often considered the second American Independence Day.
Juneteenth festivals are increasingly popular, with events popping up in big cities and small towns alike. The Brooklyn Mavens help their followers find the events by posting a video on Instagram with a roundup of what’s happening Juneteenth weekend.
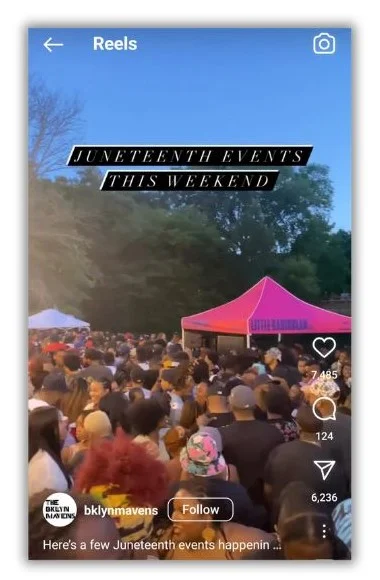

You can do the same on social media posts, blog posts, or even by email. But there are plenty of other ways to share in this important day. Here are a few ideas to get you started:
- Post powerful quotes from African American leaders.
- Write an article explaining the history of Juneteenth, covering what happened before and June 19th.
- Create a cooking video featuring Juneteenth-inspired recipes.
- Curate a list of books from Black authors or highlight the works of Black visual artists.
- Share a list of Black-owned businesses in your area.
Pre-Independence Day
For many people, the 4th of July is a big event that requires plenty of planning. That means you should share at least some of your Independence Day content ahead of time in late June.
ExtraSpace Storage shows us how it’s done with an extensive blog post full of ideas for a sparkling Fourth of July party.
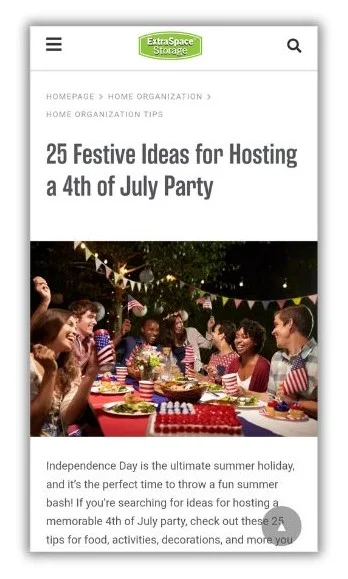

You can use the same strategy and create a big roundup of party planning ideas or go deep on one or two parts of planning a celebration, like these:
- Post a patriotic music playlist.
- Video a video showing how to clean and prep a gas grill.
- Make a shopping list of essentials for the perfect Independence Day party.
- Note local fireworks regulations and safety tips, plus mention that June is National PTSD Awareness Month as a way to remind people to be considerate with their fireworks displays.
June food content ideas
Sometimes, the fastest way to your followers’ hearts is through their stomachs. When it comes to planning your June marketing, don’t sleep on June’s variety of victual delights.
National Doughnut Day (June 7)
If you need to fill a hole in your June marketing calendar, celebrate one of the most beloved foods on the planet: the mighty doughnut! Just about anything you publish will garner good feelings (and maybe make your competition a little jelly).
The icing on top is that your brand doesn’t need to be a purveyor of cylindrical breakfast snacks at all. Take a look at this pastry-perfect post from Famer’s Almanac.
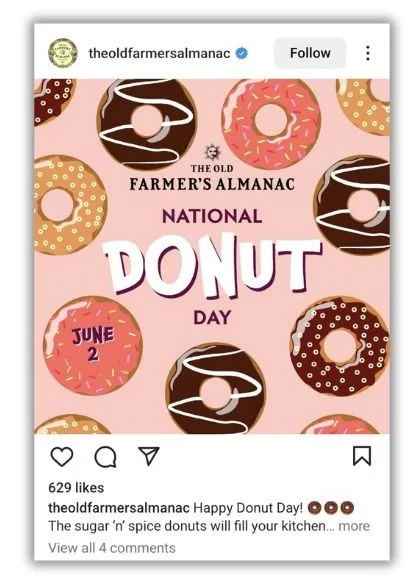

What’s brilliant about this tactic is the social media post directs viewers to a recipe on the Almanac’s website, offering a surgery slide into the business’s marketing funnel. Want to cash in on this confectionary? Try these Doughnut Day ideas for yourself:
- Get followers to vote on a March Madness-like bracket of the best doughnut toppings and fillings.
- Let people know where they can get discounts and specialty doughnuts around town.
- Create a slideshow of the most unusual, real-life doughnut recipes (like the hibiscus doughnut or the infamous cayenne pepper-topped Ring of Fire).
- Just share a picture of your staff enjoying their favorite doughnut.
National Corn on the Cob Day (June 11)
It may not have the draw of doughnuts, but no food signifies the start of summer like a fresh ear of corn on the cob. National Corn on the Cob Day, celebrated on June 11, is the perfect opportunity to engage anyone stalking your marketing channels.
This diabetes wellness account on Facebook has a cool take on hot corn. It shows you how to prepare corn on the cob without the extra calories and salt that come with traditional methods.
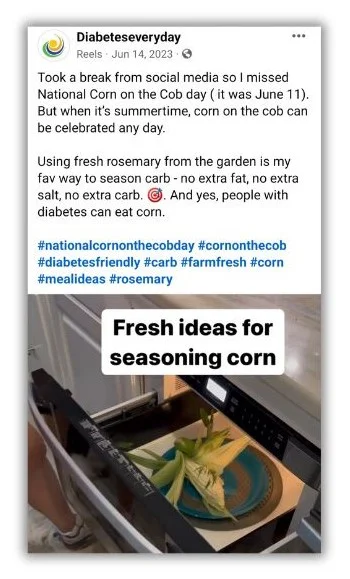

There are dozens of variations on the recipe that you can use. But don’t stop there. Mix in some more of these corny content ideas:
- Take a poll on Instagram asking how people eat their corn (with two-pronged cob holders, using the husk like a handle, or grabbing the ear with reckless abandon).
- Post some corn facts, like alternative uses for corn, the fact that corn cobs always have an even number of rows, or that the tallest recorded corn stalk was 48 feet high.
- Share a healthy dose of corny jokes (Know what happened to the corn that was fed up with his job? He went into a completely different field).
More food June content ideas
We told you June was full of food-themed content opportunities. Here’s the proof.
- National Candy Month
- National Fresh Fruit and Vegetables Month
- National Rocky Road Day (June 2)
- National Egg Day (June 3)
- National Chocolate Ice Cream Day (June 6)
- National Rosé Day (June 8), National Red Rosé Day (June 11)
- National Black Cow Day (June 10), National Ice Cream Soda Day (June 20), National Vanilla Milkshake Day (June 20)
- National Herbs and Spices Day (June 10)
- National German Chocolate Cake Day (June 11)
- National Chocolate Pudding Day (June 26)
Awareness June content ideas
While there’s plenty to celebrate in June, there are also many causes, movements, and historical events to remember and discuss. Create some space in your content plan to spread awareness of these important issues.
LGBTQ Pride Month
LGBTQ Pride Month is celebrated each June to honor the 1969 Stonewall Uprising, commemorate the positive impact people in this community have had, and remember those lost to LGBTQ hate crimes.
Live events, such as parades, lectures, concerts, workshops, and more, are a big part of Pride Month. Use one of your email newsletters to connect people with these happenings throughout the month.
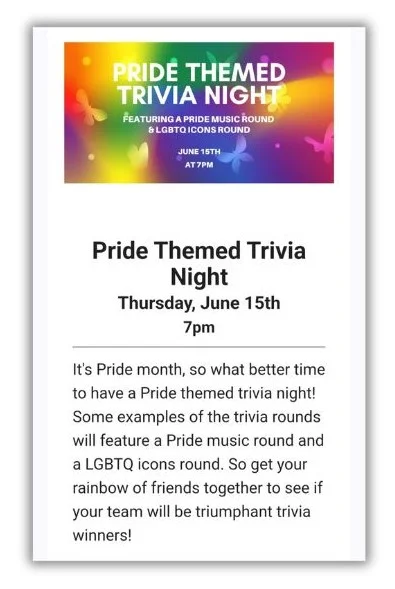

If you want to be an ally, find meaningful ways to lend your content platforms. These ideas will get you started:
- Make a watch list of LGBTQ movies, from comedies to documentaries.
- Host an event on Instagram Live, like a trivia contest or speaker series.
- Share stories of important LGBTQ figures that shaped the culture and movement.
- Organize a Pride parade watch party.
D-Day (June 6)
On D-Day, we remember the thousands of brave soldiers, sailors, airmen, and marines who participated in the Invasion of Normandy during World War II—the largest amphibious invasion in history.
Plumbers “R” Us does an excellent job of using its Instagram page to remind its followers of the aftermath of D-Day.


Here are a handful of ideas you can use to keep the memory of this day alive:
- Share images from the fateful day and a few brief words explaining what it means to you.
- Suggest a moment of silence at a particular time on June 6.
- Create a slideshow or Instagram Story highlighting a few inspirational figures from that day.
- Publish a blog post about World War II war memorials or museums in your area that people can visit.
More June awareness content ideas
June offers a lot to be thankful for and mindful of. These additional content ideas are a great way to share this with your followers and customers.
- National Adapt-a-Cat Month
- National Foster a Pet Month
- National Say Something Nice Day (June 1)
- International Corgi Day (June 4)
- National Hug Your Cat Day (June 4)
- International Yoga Day (June 21)
- National Take Your Dog to Work Day (June 21)
- National Yard Games Day (June 21)
- World Day of Music (June 21)
- Global Beatles Day (June 25)
- Alzheimer’s and Brain Awareness Month
- National Play Outside Day (June 1)
- National Go Barefoot Day (June 1)
- World Pet Memorial Day (June 11)
- National Random Acts of Light Day (June 13)
- US Army Birthday (June 14)
- World Blood Donor Day (June 14)
- Global Garbage Man Day (June 17)
- World Rainforest Day (June 22)
- World Refugee Day (June 30)
- National Day of Indigenous People (June 21)
- Family Owned & Operated Business Day (June 23)
- Helen Keller Day (June 27)
Summer fun June content ideas
Summer takes off in June, so there are plenty of sun-fueled topics to discuss online. Travel, beach days, pool parties, and outdoor activities are all on the table. These creative June content ideas will let you tap into those hot summer vibes.
Ask a summer-related question
Engagement is key to success in digital marketing. You don’t just want to talk at your audience; you want them to participate in the conversation. One surefire way to do it is to ask questions.
Here’s a simple option to start the conversation. Post a question in an image that people can answer in the comments.
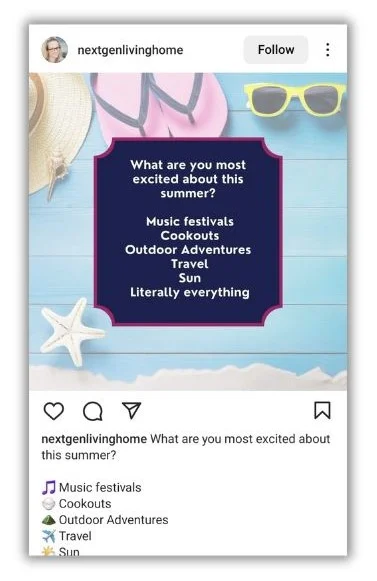

Polls on Instagram and other platforms can also work. You can even ask for feedback through email and ask if it’s okay to share it on other channels. The opportunities are endless, so consider this list of questions as inspiration for your next June campaign:
- Beach or mountains for the summer?
- Favorite summer food?
- Favorite beach?
- What song makes you think of summer?
- Best summer vacation?
- Favorite summer activity: fishing, outdoor concerts, grilling, hiking?
- Most recent summer read?
Gather summer-themed UGC
User-generated content is the not-so-secret weapon of the best online marketers. Why is it so great? Because it’s a fast way to fuel your online content from real people who use your product. It’s a triple win!
UGC is great for June content because people are excited to share their images of early summer. To boost your June UGC campaign, tie it to a free giveaway or contest, like Hydroflask did.


Ask your fans and followers to enter the contest by following your account, liking or commenting on the post, or clicking a link to a contest landing page. Notice how Hydroflask also used a unique hashtag. That’s a fantastic tactic to make it easy for people to share your campaign in their networks.
You can run a UGC campaign at any time, but here are a few days in June that would be ideal for it:
- National Selfie Day (June 21)
- National Camera Day (June 29)
- Social Media Day (June 30)
Create summer to-do lists
People start making summer plans as soon as the temperature starts climbing. It’s easy to feel like you’ve left something important off the list. Help your audience by creating a themed summer to-do list and distributing it as part of your June content calendar.
YouTuber Becca Bradley posted this summer bucket list on YouTube, which gave her followers many ideas for spending their summer days.
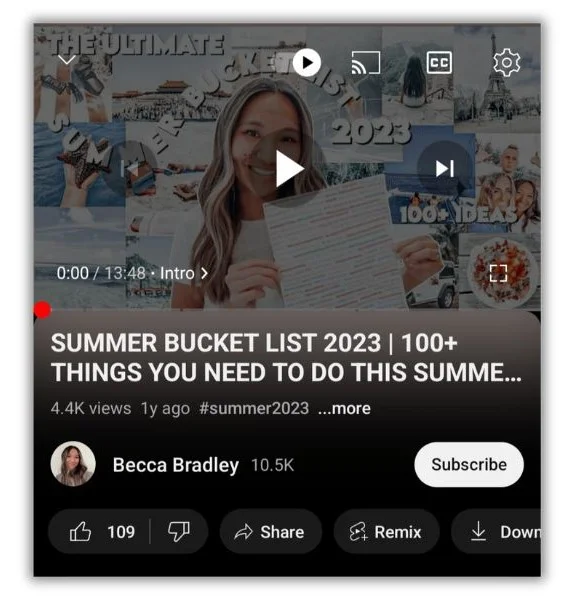

What’s great about this June content idea is that you don’t need expensive recording equipment or editing apps. Just make a list of summer activities and explain them. You can even add a theme, like activities with your pet or activities for kids.
Give your summer to-do lists a little more focus by tying them to fun observance days. Here are some ideas:
- Conservation efforts for National Pollinator’s Month, World Environment Day (June 5), or World Ocean Day (June 8)
- Kid-friendly activities for National Zoo and Aquarium Month, National Drive-In Movie Day (June 6), or World Picnic Day (June 18)
- Outdoor activities for Great Outdoors Month, National Parks Trail Day (June 1), or National Go Fishing Day (June 18)
- Summer sports to try for World Bicycle Day (June 3), World Softball Day (June 14), or National Tennis Week (June 23 to 29)
June content ideas to keep the summer vibes rolling
Your June content will be a valuable marketing tool whether you’re after awareness, looking for leads, or counting on conversions. The keys to success are to be authentic and creative so your audience has a reason to look forward to the next post, email, or video.
While you mull over the content that will fill your June calendar, get even more inspiration from these June marketing guides:
PPC
How to Capture Your YouTube Ads Audience in 5 Seconds

You could have the best product in the world, but if your ideal customers don’t know it exists, you’re just spinning your wheels. YouTube ads are a great way to get your video content in front of your audience – but it’s not enough to simply make a video.
Low video engagement is the scourge of many business owners, but it doesn’t have to be. You can increase brand awareness, attract new business, and get the attention of your target market with the right approach to video storytelling.
Here’s how to hook your audience within the first 5 seconds of your ad.
Plan Your Message
Though viewers prefer raw, authentic videos to more polished ads, you can’t exactly wing it. You need a clear, targeted message, or a concept that speaks directly to your target audience.
If you cast your net too widely, you’ll have a wishy-washy message that doesn’t capture the attention of your ideal viewer, or tell them why they should spend a few minutes watching your content. Know your audience and tailor the message to them.
To do that, you have to know what your audience is looking for. Think about:
- Their pain points
- Their interests
- The challenges or stress they experience every day
- The problems they’re trying to solve
- The content they enjoy
- The brand voice and personality they expect
Need a little guidance? Tools like Google Analytics and YouTube’s built-in analytics can offer key insights into your audience and competitors. You can also glean insights from interactions on your social media videos or other marketing content to better understand your audience.
Lead your YouTube Ads with a Catchy Headline
Just like the first line of an article, your headline has to make an impact – especially with YouTube ads. According to research, 8 out 10 people will never make it past the headline, so you have to use those precious view words to capture their attention.
Some tips for an effective video title:
- Make sure your title matches the content (no clickbait!)
- Know your audience and speak to them
- Rely on keyword research
- Create a sense of urgency
- Provide a compelling hook
- Keep your title under 60 characters
- Create listicle-style titles
- Study your competitors’ videos
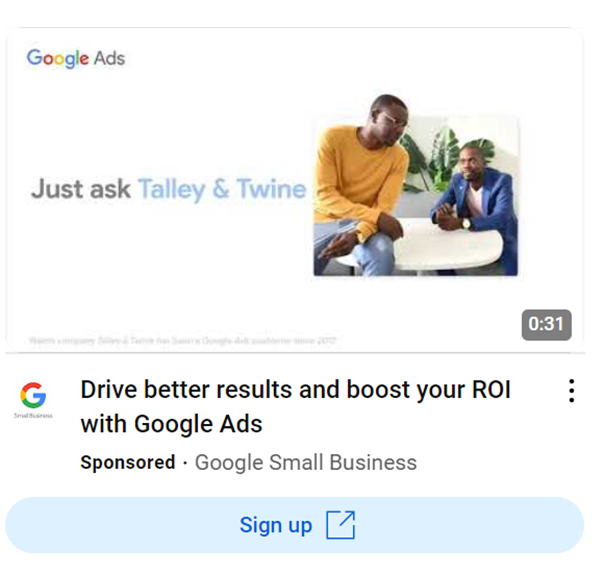
This is an example of a good headline from Google Small Business that addresses the audience’s pain points and goals:
Tell a Story with your YouTube Ads
Humans are drawn to stories. Designing your video ad around a narrative will attract the viewer’s attention better than conveying information in a basic way. Your viewers become more immersed in the message and more compelled to take the action you want – signing up, subscribing, or completing a purchase.
How do you turn your content into a story? Think about the essence of what you want to say. Triumph over adversity? The power of community? The pursuit of a dream? Think beyond the direct benefits of your product or service to the larger context.
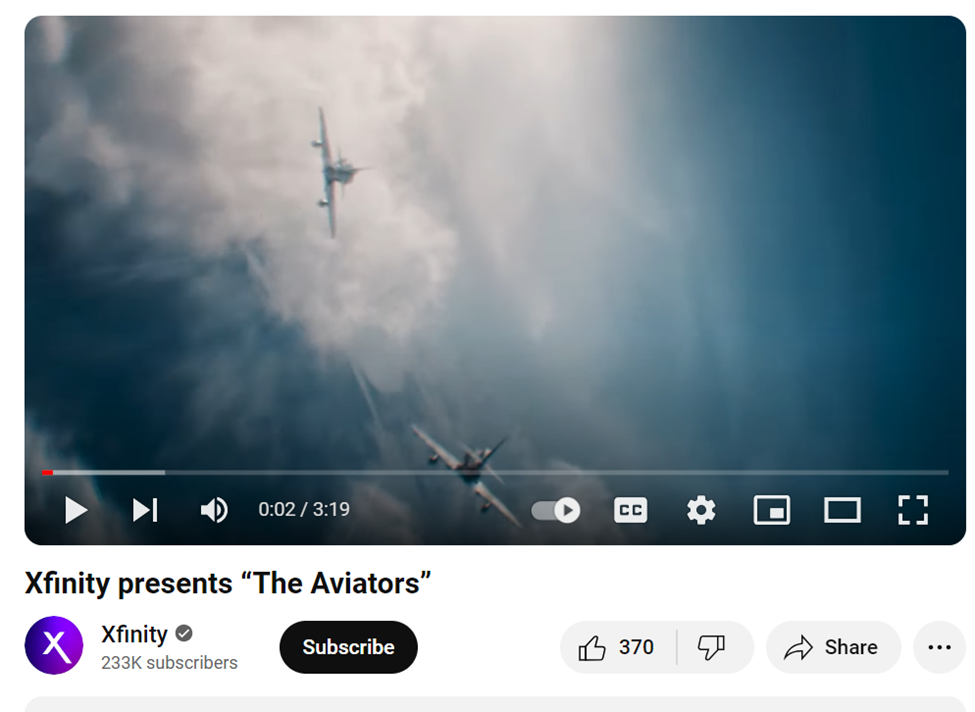
One of the best examples of storytelling in video ads is Xfinity’s recent ad, “The Aviators.” It tells the story of a clever granddaughter helping her veteran grandfather and his friends fly jets once again with the power of VR and Xfinity Internet.
Don’t Forget the Call to Action (CTA)
A clear and compelling call to action (CTA) is essential to every successful campaign, including YouTube ads. The CTA is how you tell the viewers what action you want them to take, whether it’s subscribing to your channel, checking out your website, or purchasing a product.
Like your headline, your CTA should be persuasive, clear, and concise so you viewers know exactly what you want them to do and how to do it. Your CTA should align with your ad’s message – which should motivate them throughout the content to seal the deal. Include a CTA as on-screen text and narration for more impact.
Keep Your Brand at the Forefront of your YouTube Ads
Video ads from the top brands are instantly recognizable through logo, brand colors, familiar faces, or other details. You should do the same with your brand to boost awareness and ensure you stay top-of-mind for your viewers.
That said, you don’t want to create a video that’s all about your brand with salesy language and a lot of promotional aspects. Try to include your brand as seamlessly as possible without detracting from the story and the message of value you’re offering for your audience.
Keep It Fun
Humor is a powerful tool in advertising and can capture attention and memory more successfully than other tactics, but you have to be careful about it. Humor is highly subjective – what’s hilarious to one person may be offensive to another.
When Peloton took a shot at humor with a holiday ad in 2019 that featured a man giving his wife a Peloton bike as a Christmas gift, the brand was heavily criticized for reinforcing negative body images.
However, the controversy did inspire a spoof ad from Aviation Gin that featured the same actress exchanging her stationary bike for gin martinis, which she drinks with friends. The caption read, “Exercise bike not included.”
One miss, one hit. Be mindful of how you incorporate humor and always aim to be entertaining and memorable, not offensive or controversial (unless that fits your brand).
Experiment and Test
There’s no one-size-fits-all solution to better YouTube ad engagement. What connects with one audience may fall flat with another, so you have to experiment a little and determine what speaks to your target viewers.
Try different storytelling techniques, headlines, CTAs, visual styles, multimedia additions, and video marketing SEO tactics to see what works and what doesn’t. Fortunately, YouTube has excellent analytics to track your ad performance and optimize your strategy moving forward.
Hook Your Audience
Creating attention-grabbing YouTube ads can feel like an overwhelming challenge – especially if you’re not getting much engagement with your current strategy. Incorporating some best practices, experimenting, and evaluating your ad performance can help you unlock the key to your audience and create ads that hook them in seconds.
Torrey Tayenaka is the co-founder and CEO at Sparkhouse, an Orange County based commercial video production company.
PPC
Google Ads Benchmarks 2024: New Trends & Insights for Key Industries
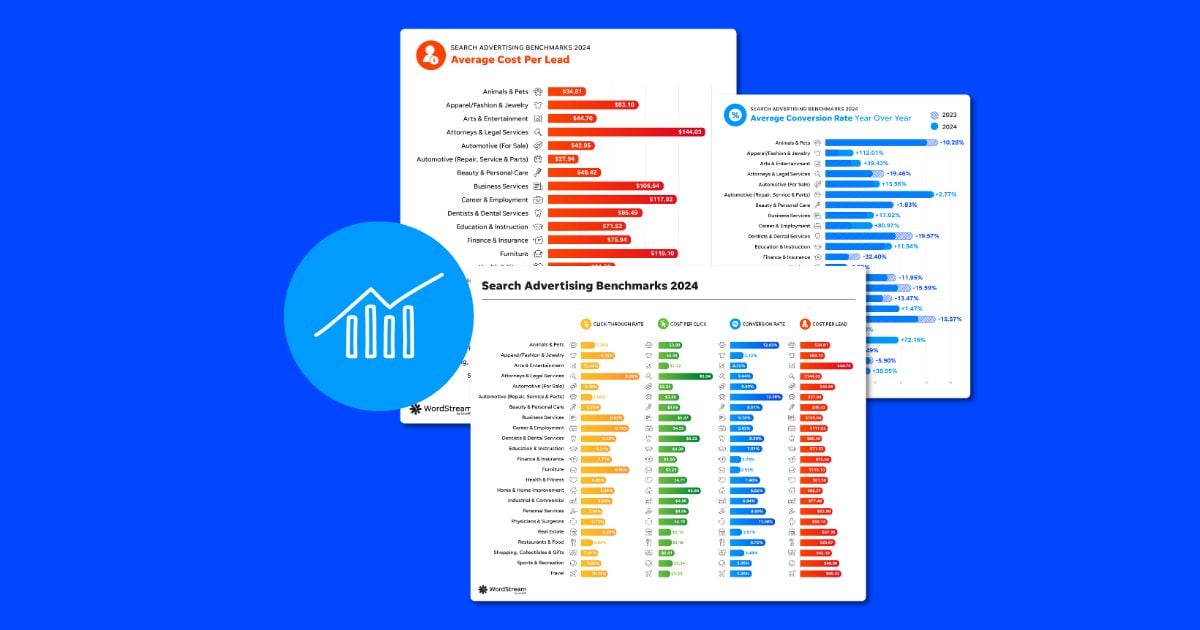
With over 80% of buying journeys beginning on search engines, it’s not a surprise that so many businesses are running search ads to capture searchers and convert them into customers.
But with search engines like Google constantly changing the search landscape, and with advertising costs rising across the board, it’s important to understand how your search ads are really performing to drive the best results for your business.
That’s where we come in! We analyzed over 17,000 campaigns running from April 2023 through March 2024 to create the latest version of our search advertising benchmarks report to give you a peek at how businesses in your industry are performing on Google Ads and Microsoft Ads.
We’re also providing expert insights and actionable tips to help you optimize your campaigns and get the best results from your search ads strategy.
🏃 Need to take this data to-go? We wrapped our 2024 Google Ads Benchmarks report into a free, easy-to-download guide here.
Contents
In remembrance of Mark Irvine
Our team was deeply saddened to learn of Mark Irvine’s sudden passing in early May. Mark was a longtime friend and colleague as well as a frequent contributor to the WordStream blog, and the author of our first Google Ads benchmarks report in 2016. Our hearts go out to his friends and loved ones. Find our tribute to Mark here.
Microsoft and Google Ads benchmarks: Key trends in 2024
Before we get into the metric-by-metric details, let’s first get a birds’ eye view of the latest benchmark data.
Here are the overall trends for Google Ads and Microsoft Ads in 2024 you need to know:
- Click-through rate improved for most industries. 70% of industries saw an increase in CTR year over year, some significantly, with an overall average increase of 5% since 2023.
- Cost per click increased for 86% of industries. Some industries, like Real Estate, Sports & Recreation, and Personal Services saw increases of over 25% year over year, with an average overall increase of 10%.
- Conversion rate decreased for 12 out of 23 industries, although the average was fairly minimal at only 1%. Some industries did see bigger decreases, like Finance & Insurance (-32.40) and Dentists & Dental Services (-19.57%). But some industries saw substantial increases YoY, such as Apparel / Fashion & Jewelry (112.01%) and Career & Employment (80.97%).
- Cost per lead increased for 19 out of 23 industries, with an average increase of about 25%. This is a little lower than last year’s 27% increase, which came after record inflation and an unstable economy.
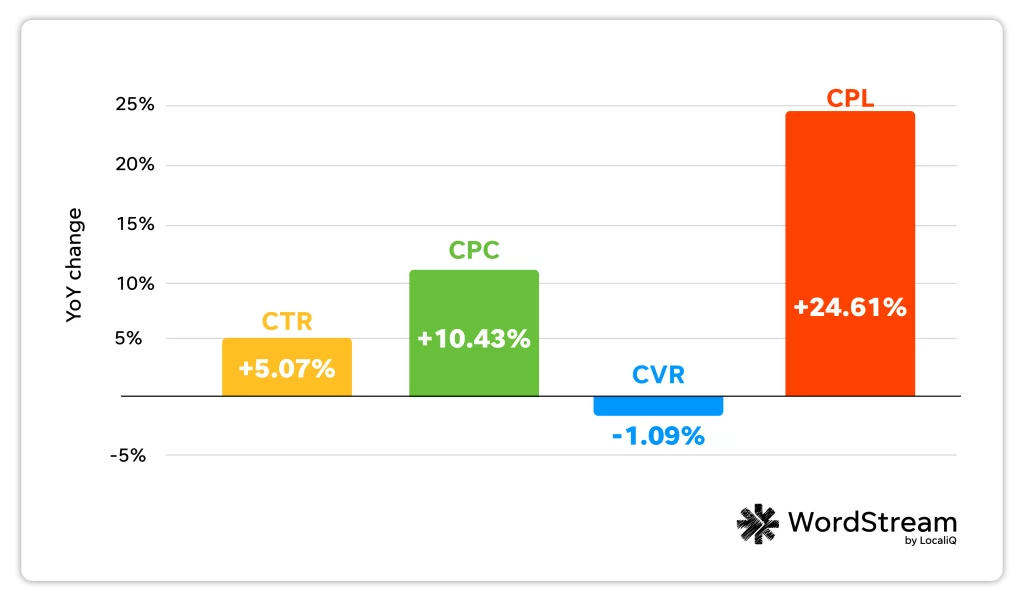

Year over Year Changes in Search Ads Metrics from 2023 to 2024
The overall takeaway from these trends? Increases in CTR indicate that the SERP is becoming more ad-friendly—for many queries, most results above the fold are ads, and ads continue to blend into organic results.
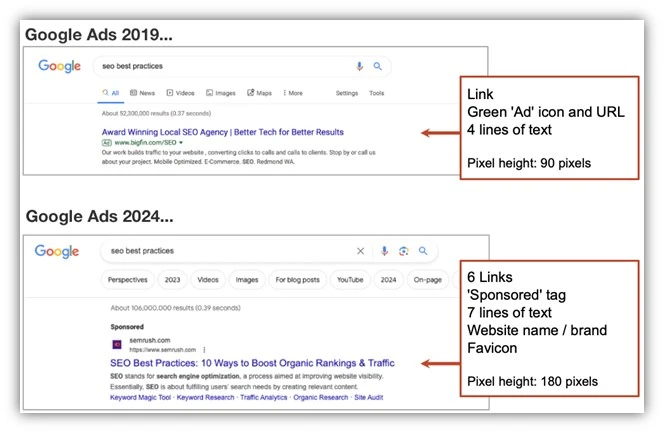

Google has also made broad match the default mode for match types, meaning ads may be matching to searches with relatively low commercial intent. This could lead to increases in clicks that don’t necessarily turn into sales.
The economy also continues to play a role in Google Ads costs increasing. In last year’s Google Ads benchmark report, CPC increased for about 60% of industries, but those increases were fairly small (averaging 2%). This year’s average is 10%, likely due to continued effects from inflation.
“The rise in CPC across most industries aligns with the ongoing economic challenges like inflation,” said Alessandro Colarossi, Partner Data Transformation Lead at Google.
It could also be due to Google increasing costs for their own bottom line. “Google only generates revenue when we click on ads… In 2023 those clicks generated $250B in revenue, up 5x over the last 10 years,” said Andy Crestodina, Co-Founder and CMO at Orbit Media, in this recent article.
🚨 Find out how your business compares to the industry average with our free Google Ads Grader!
Search ads benchmarks for every industry
Ready to dive deeper into some of the latest PPC trends? Here are the Microsoft Ads and Google Ads benchmarks across all metrics and industries for 2024.
Let’s take a closer look with a breakdown for each metric.
📧 Want the full data breakdown straight to your inbox? Download our free 2024 Google Ads benchmarks guide!
Average click-through rate in search ads
Click-through rate, while often overlooked in favor of cost-driven metrics, can be extremely telling when it comes to your search campaign performance. It indicates how frequently people are clicking on your ad once it’s shown in the SERP—which is half the battle when it comes to getting a conversion.
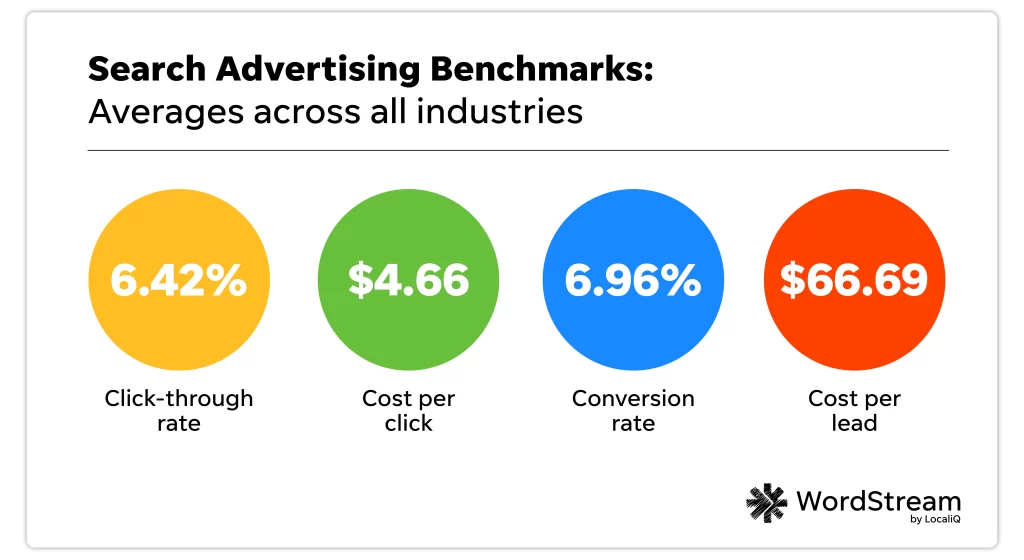
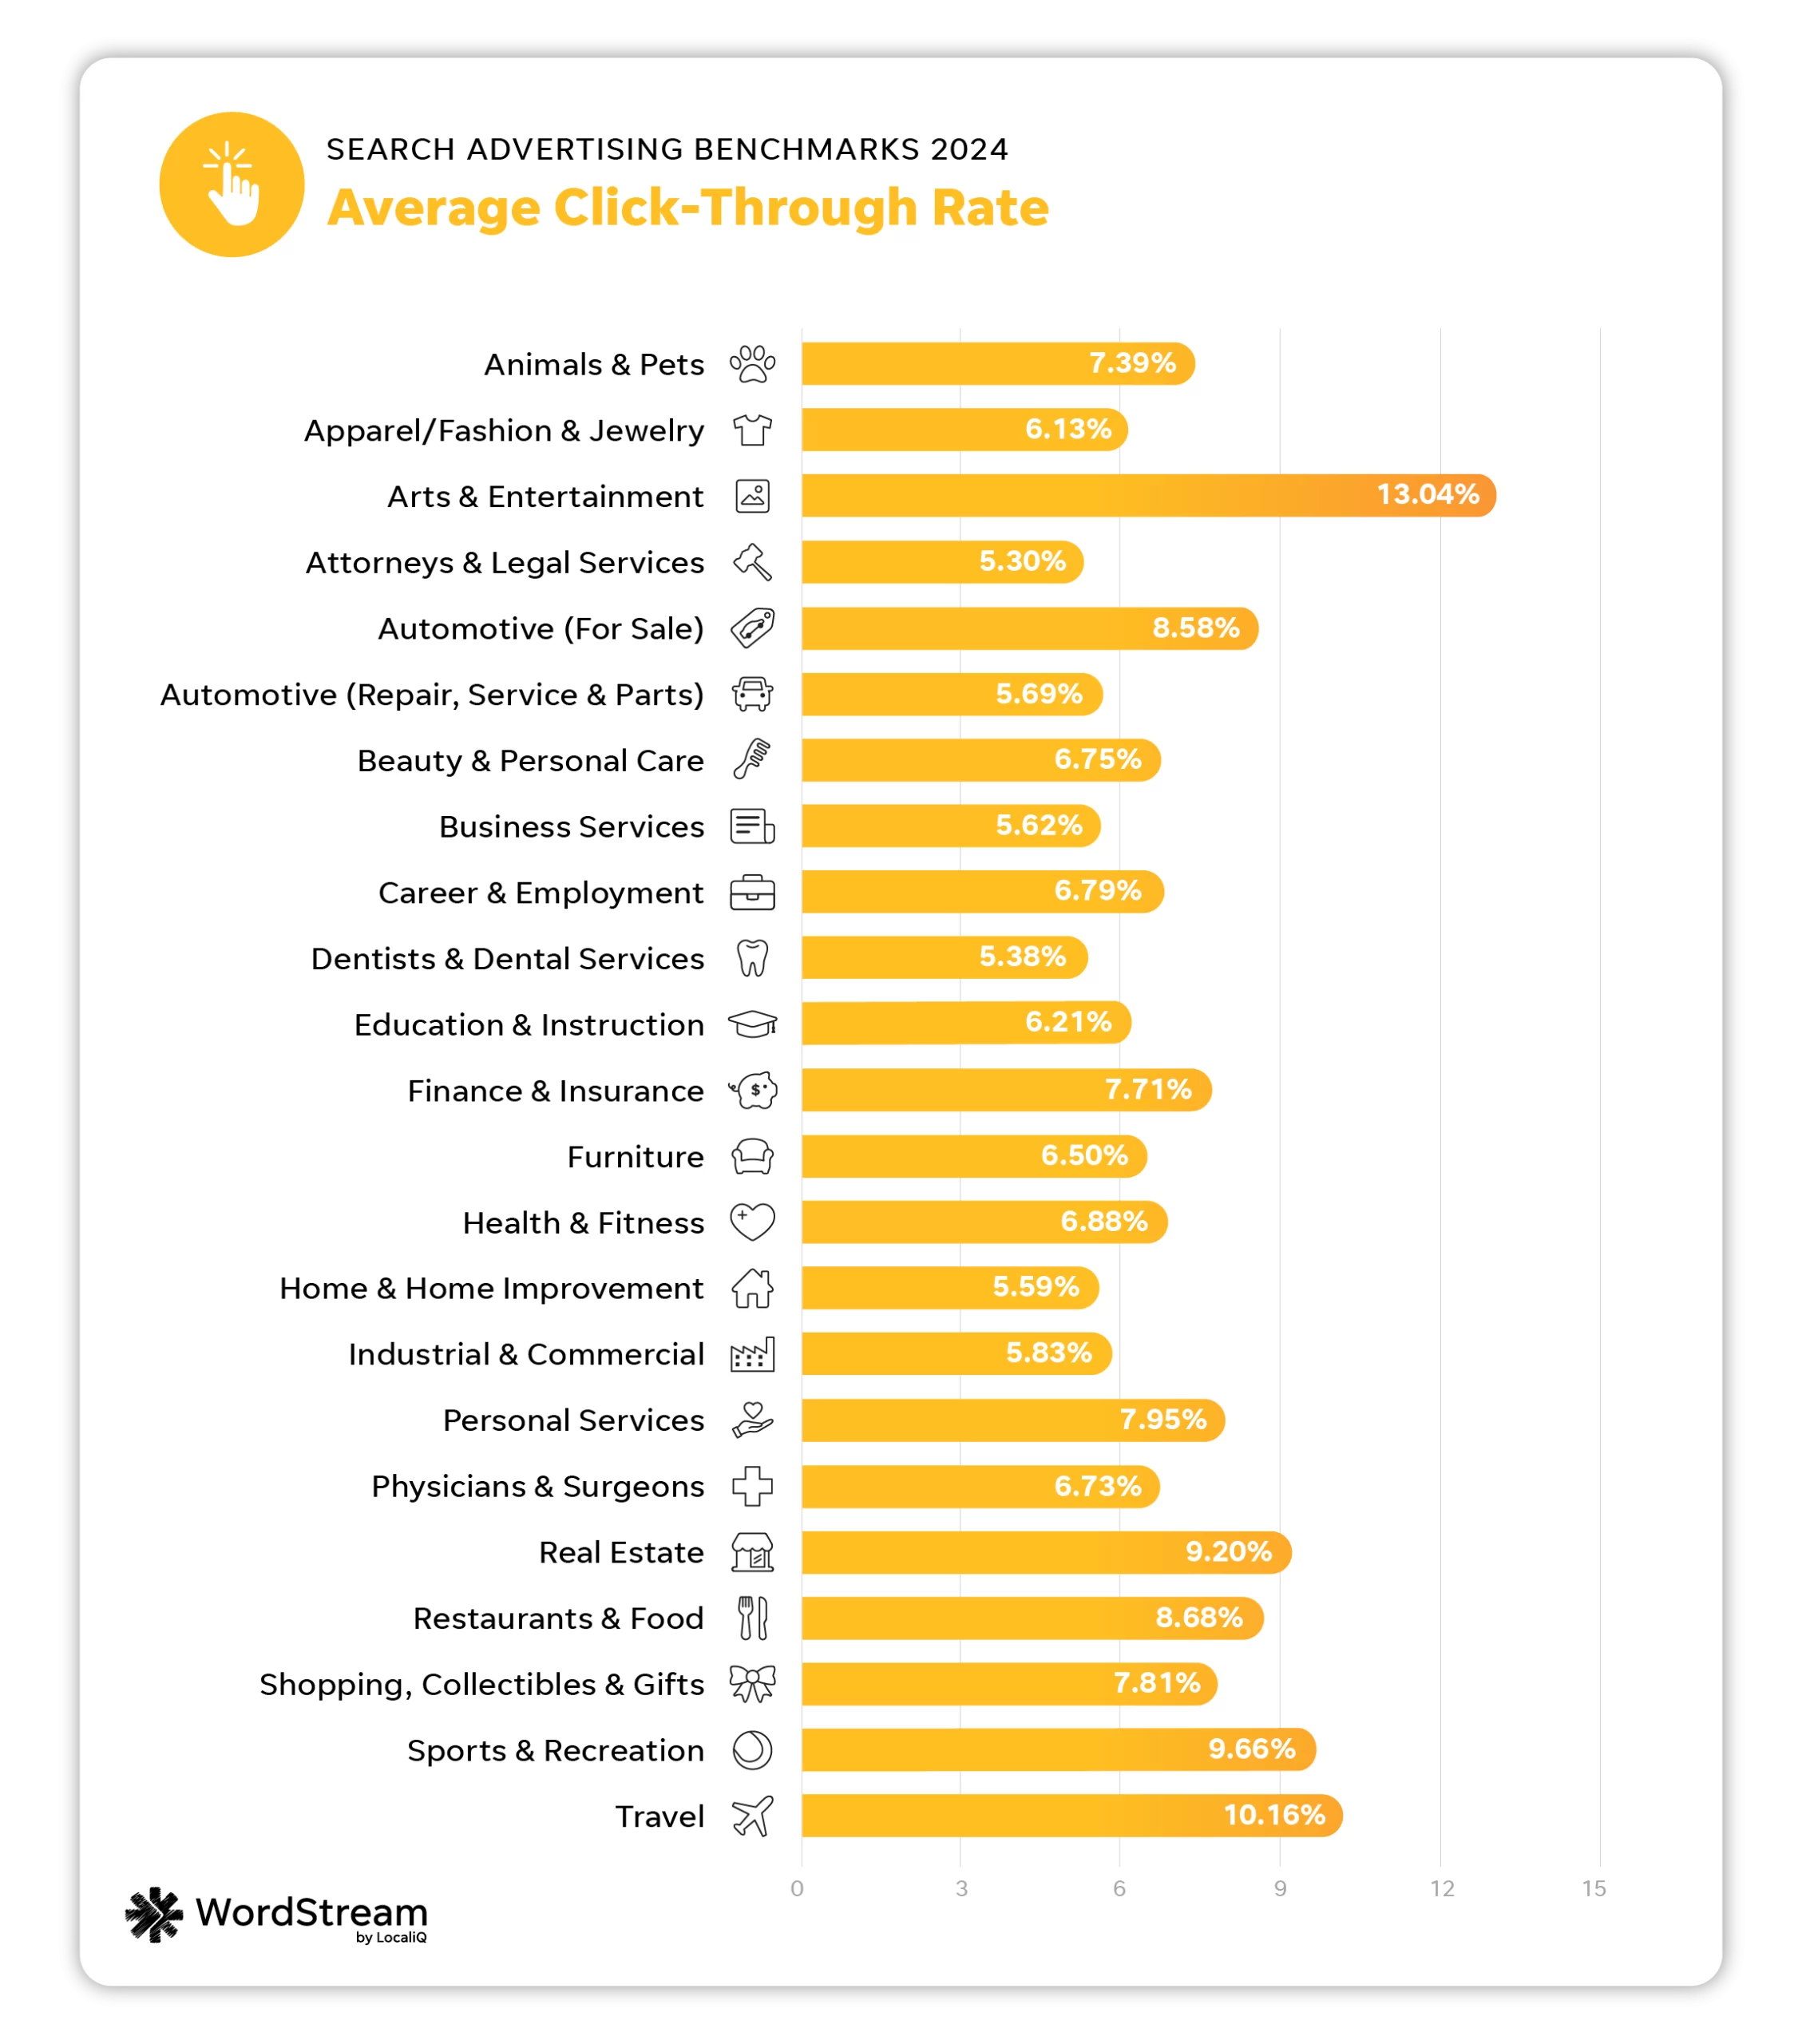
The average click-through rate in Google Ads in 2024 is 6.42%.

| Business category | Avg. CTR |
| Animals & Pets | 7.39% |
| Apparel / Fashion & Jewelry | 6.13% |
| Arts & Entertainment | 13.04% |
| Attorneys & Legal Services | 5.30% |
| Automotive — For Sale | 8.58% |
| Automotive — Repair, Service & Parts | 5.69% |
| Beauty & Personal Care | 6.75% |
| Business Services | 5.62% |
| Career & Employment | 6.79% |
| Dentists & Dental Services | 5.38% |
| Education & Instruction | 6.21% |
| Finance & Insurance | 7.71% |
| Furniture | 6.50% |
| Health & Fitness | 6.88% |
| Home & Home Improvement | 5.59% |
| Industrial & Commercial | 5.83% |
| Personal Services | 7.95% |
| Physicians & Surgeons | 6.73% |
| Real Estate | 9.20% |
| Restaurants & Food | 8.68% |
| Shopping, Collectibles & Gifts | 7.81% |
| Sports & Recreation | 9.66% |
| Travel | 10.16% |
The industries that saw the best average CTRs this year were Arts and Entertainment (13.04%), Sports and Recreation (9.66%), and Real Estate (9.20%).
Meanwhile, the industries with the lowest average CTRs were Attorneys and Legal Services (5.30%), Home and Home Improvement (5.59%) and Dentists and Dental Services (5.38%).
The overall increase in CTR for most industries indicates a more ad-friendly SERP, which has upsides and downsides. As results above the fold are increasingly populated by ads that blend seamlessly into organic results, advertisers will see an increase in clicks, but they may also see decreases in organic traffic.
“Since the advent of Responsive Search Ads, Google has been subtly shifting away from ads reading as a fixed three-headline format to something more flexible and agile for different screens. Now, you’re seeing ads with one headline that look nearly identical to their organic listings in every way,” said Mark Irvine, Vice President of Search at SearchLab.
Average click-through rate: YoY
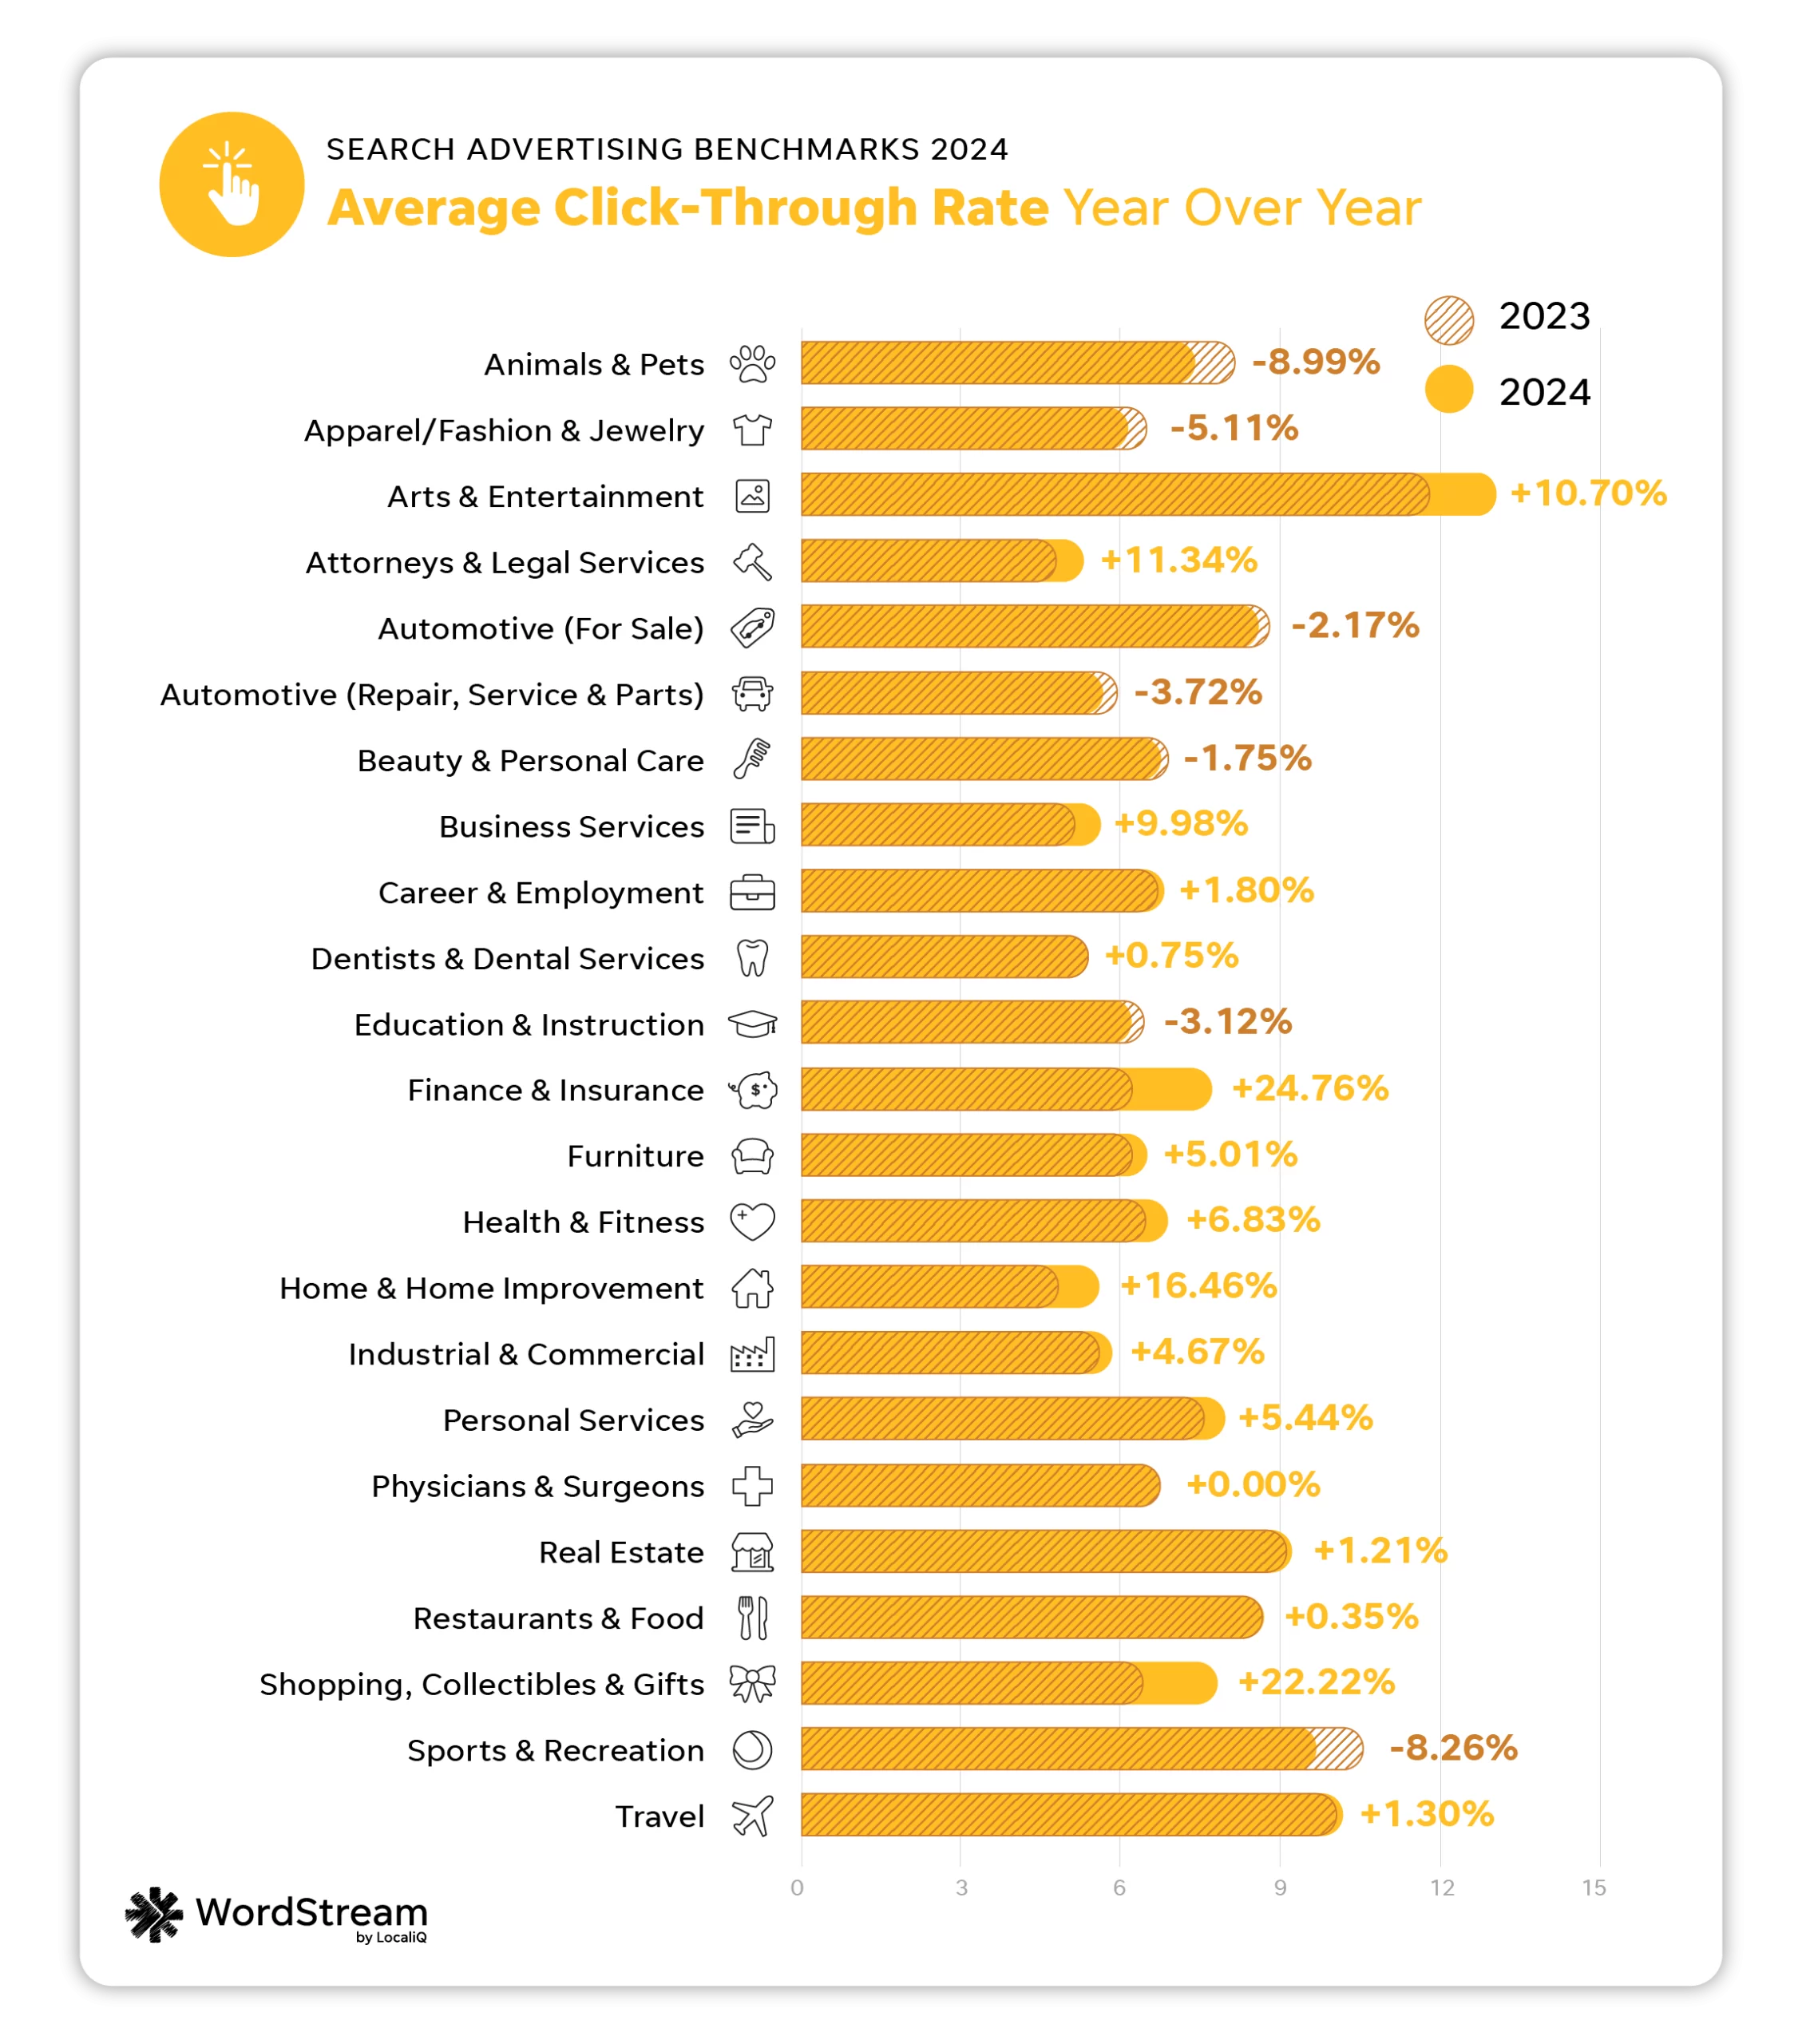
The industries that saw the biggest increases in CTR performance year over year were Finance and Insurance (up 24.75%), Shopping, Collectibles, and Gifts (up 22.22%), and Home and Home Improvement (up 16.46%).
In contrast, the industries with the biggest decreases in CTR year over year were Animals and Pets (down 8.99%), Sports and Recreation (down 8.26%) and Apparel, Fashion, and Jewelry (down 5.11%).
The 2024 average CTR of 6.42% is higher than last year’s overall average of 6.11%.

How to improve click-through rate
If your current click-through rate doesn’t align with the average for your industry, you may want to consider how, exactly, your customers are searching for your business and tailor your ads accordingly.
“There are so many avenues now for consumers to find information that before you could only find on a website. You can be cooking dinner and just say ‘Alexa,’ or hit your watch and say ‘Hey, Siri.’ With so many ways for consumers to find search results, you are seeing the competition continue to increase,” said Stephanie Scanlan, Vice President of Client Success at LocaliQ.
Using keywords, headlines, and descriptions optimized for voice search, and answering customer pain points, questions, and more may make your ads more visible (and clickable) in the long run. You can find more ways to improve your click-through rate here.
Average cost per click in search ads
You can’t take your click-through rate into consideration without also factoring in your cost per click. Cost per click is a measure of how much you’re charged, on average, for a click on your search ads. Cost per click can vary depending on your bidding strategy, click-through rates, industry competition, and more.
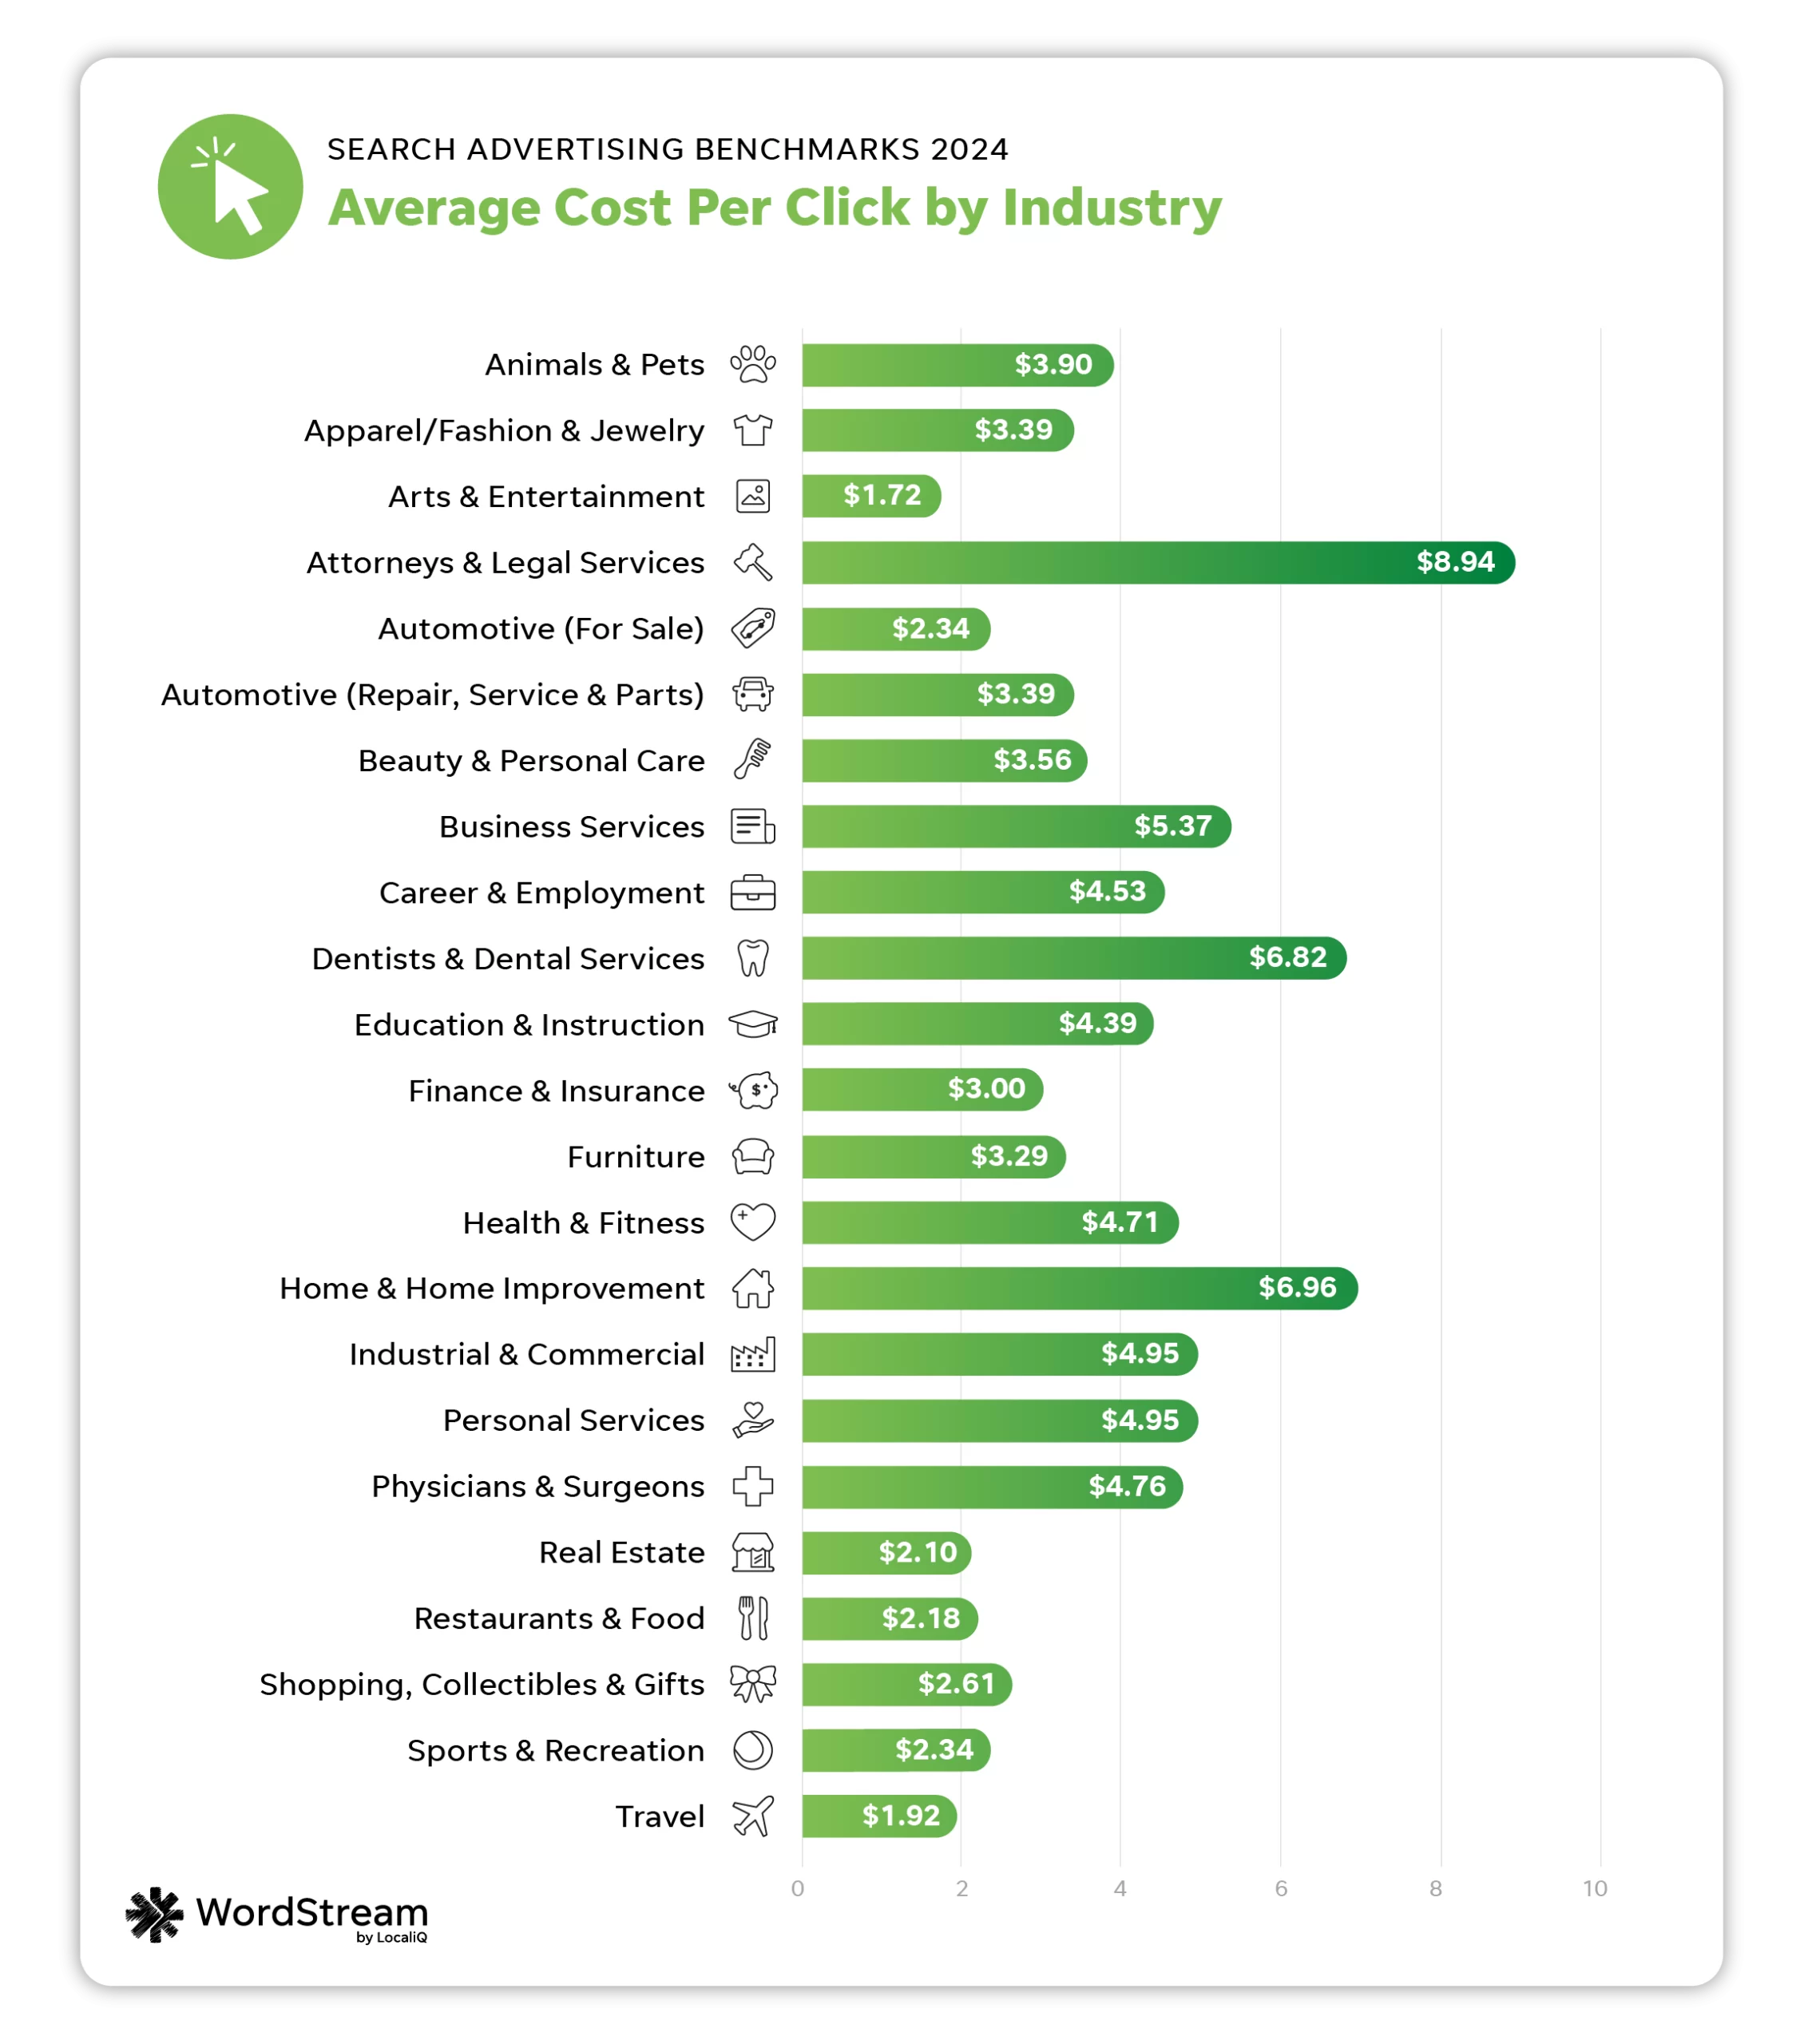
The average cost per click in Google Ads in 2024 is $4.66.

| Business category | Avg. CPC |
| Animals & Pets | $3.90 |
| Apparel / Fashion & Jewelry | $3.39 |
| Arts & Entertainment | $1.72 |
| Attorneys & Legal Services | $8.94 |
| Automotive — For Sale | $2.34 |
| Automotive — Repair, Service & Parts | $3.39 |
| Beauty & Personal Care | $3.56 |
| Business Services | $5.37 |
| Career & Employment | $4.53 |
| Dentists & Dental Services | $6.82 |
| Education & Instruction | $4.39 |
| Finance & Insurance | $3.00 |
| Furniture | $3.29 |
| Health & Fitness | $4.71 |
| Home & Home Improvement | $6.96 |
| Industrial & Commercial | $4.95 |
| Personal Services | $4.95 |
| Physicians & Surgeons | $4.76 |
| Real Estate | $2.10 |
| Restaurants & Food | $2.18 |
| Shopping, Collectibles & Gifts | $2.61 |
| Sports & Recreation | $2.34 |
| Travel | $1.92 |
This year’s industries with the lowest average CPCs were Arts and Entertainment at $1.72, Travel at $1.92, and Real Estate at $2.10.
The industries with the highest average CPCs were Attorneys and Legal Services ($8.94), Home and Home Improvement ($6.96), and Dentists and Dental Services ($6.82).
Last year, CPC increased for about 60% of industries, but those increases were fairly small (averaging 2%). This year’s average increase is 10%. This is likely due to continued effects of inflation; while rates on inflation have slowed, the costs of most goods and services have not come down.
While industries like Attorneys and Legal Services typically face higher costs, conversions from these pricier clicks can be of much higher value for these types of businesses.
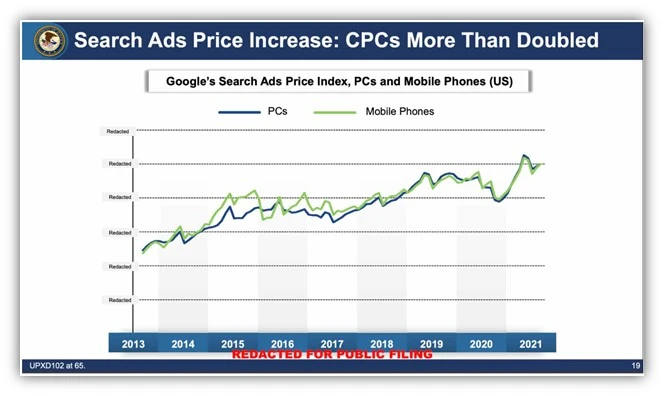
It isn’t a shock that some industries are seeing high costs per click, as it was found in the Google Antitrust trial that CPCs have steadily increased over the years.

Average cost per click: YoY
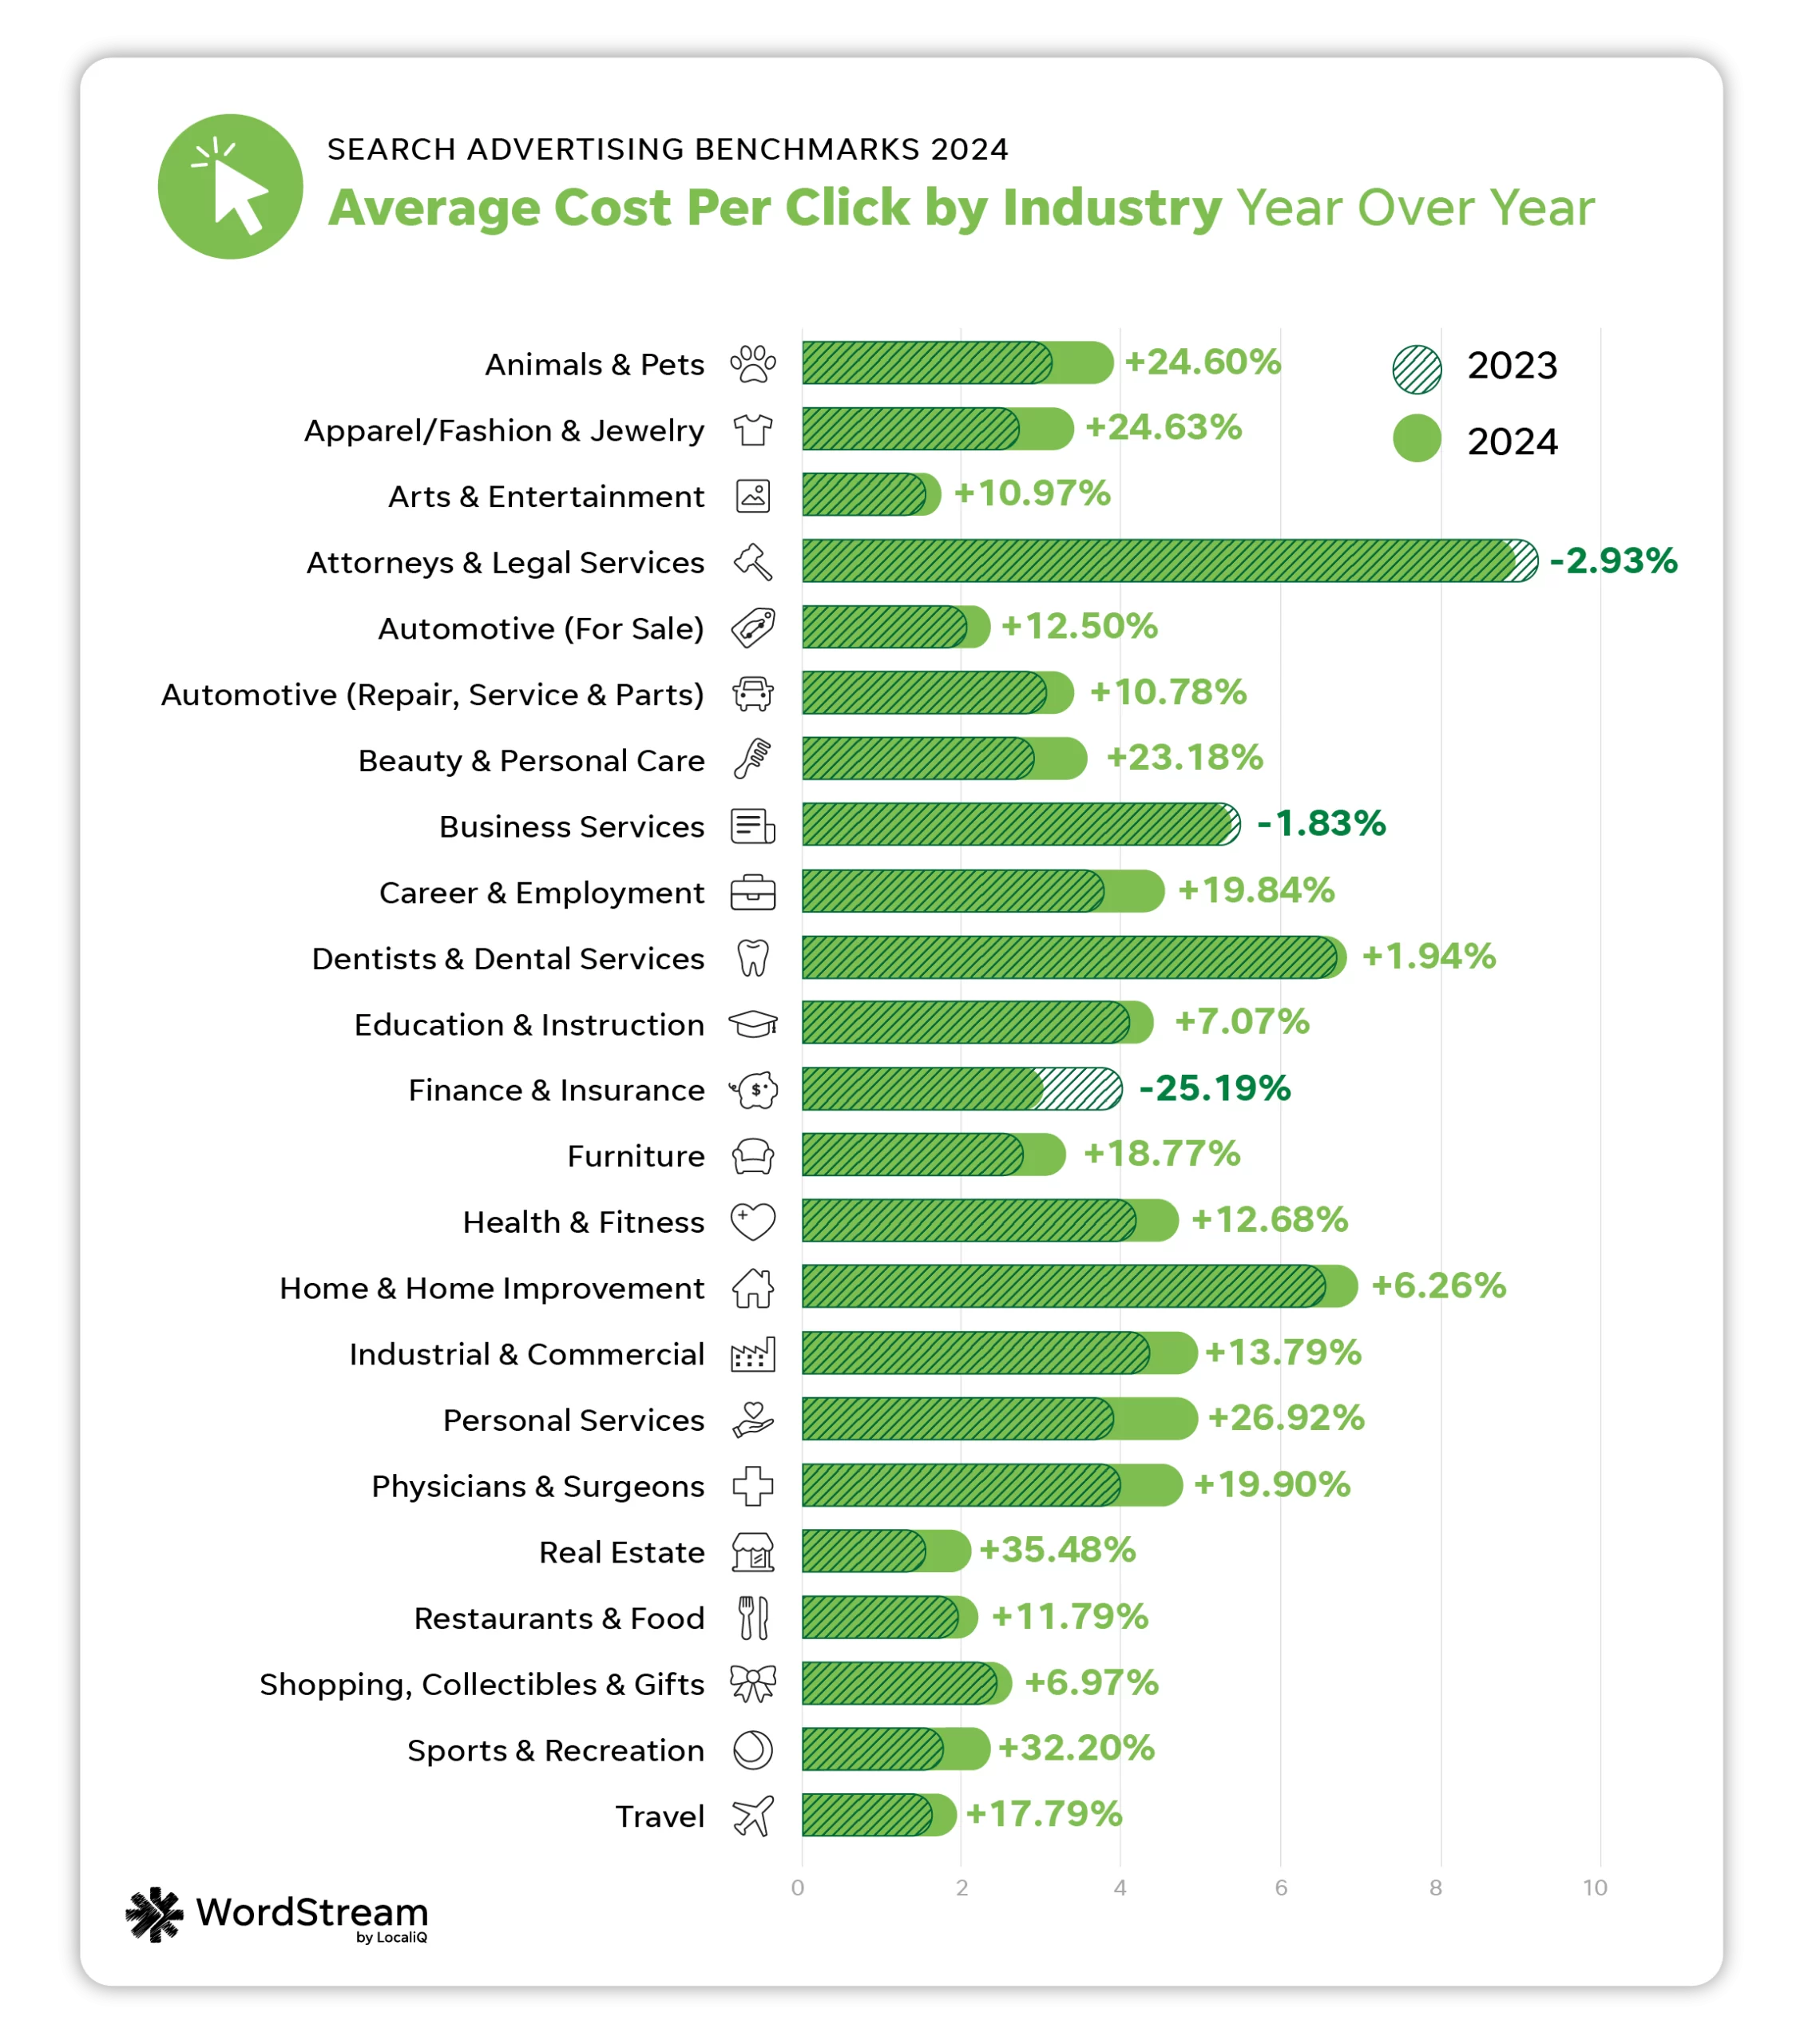
The industries with the biggest drops in CPC performance were Real Estate (increased 35.48%), Sports and Recreation (increased 32.20%), and Personal Services (increased 26.92%).
Meanwhile, the industries that saw the biggest improvements in CPC performance were Finance and Insurance (-25.19%), Attorneys and Legal Services (-2.93%), and Business Services (-1.83%).
This year’s overall average CPC of $4.66 is 44 cents higher than last year’s average of $4.22.

How to lower cost per click
When it comes to any cost in Google Ads, including cost per click, there are a few factors that may be out of your control.
“The noticeable jump in CPC prices could be due to the lingering effects of inflation. Like almost everything else—advertising costs have gone up for businesses, and that is largely contributing to the changes in CPC trends we’re seeing,” said Goran Mirkovic, CMO at Freemius.
“Changes in industry-specific demand (like real estate), competition levels, unique advertising tactics, and consumer behavior could also be impacting these trends. As users interact with search results and ads in new ways, it’s only natural to expect that these changes will have a visible impact in both CTR and CPC rates,” said Goran.
However, there are still optimizations you can make to lower your cost per click. For example, tightly aligning your landing pages with your keyword intent can increase your Quality Score, which in turn can lower your cost per click.
Average conversion rate in search ads
Conversion rate is one of the most important PPC metrics to advertisers because it accounts for how many ad clicks turn into real sales or leads.
It can be tricky to balance trying to achieve a high conversion rate while lowering costs. That’s why it’s so important to closely track your conversion rate against other metrics in your account to get a holistic view of your strategy.
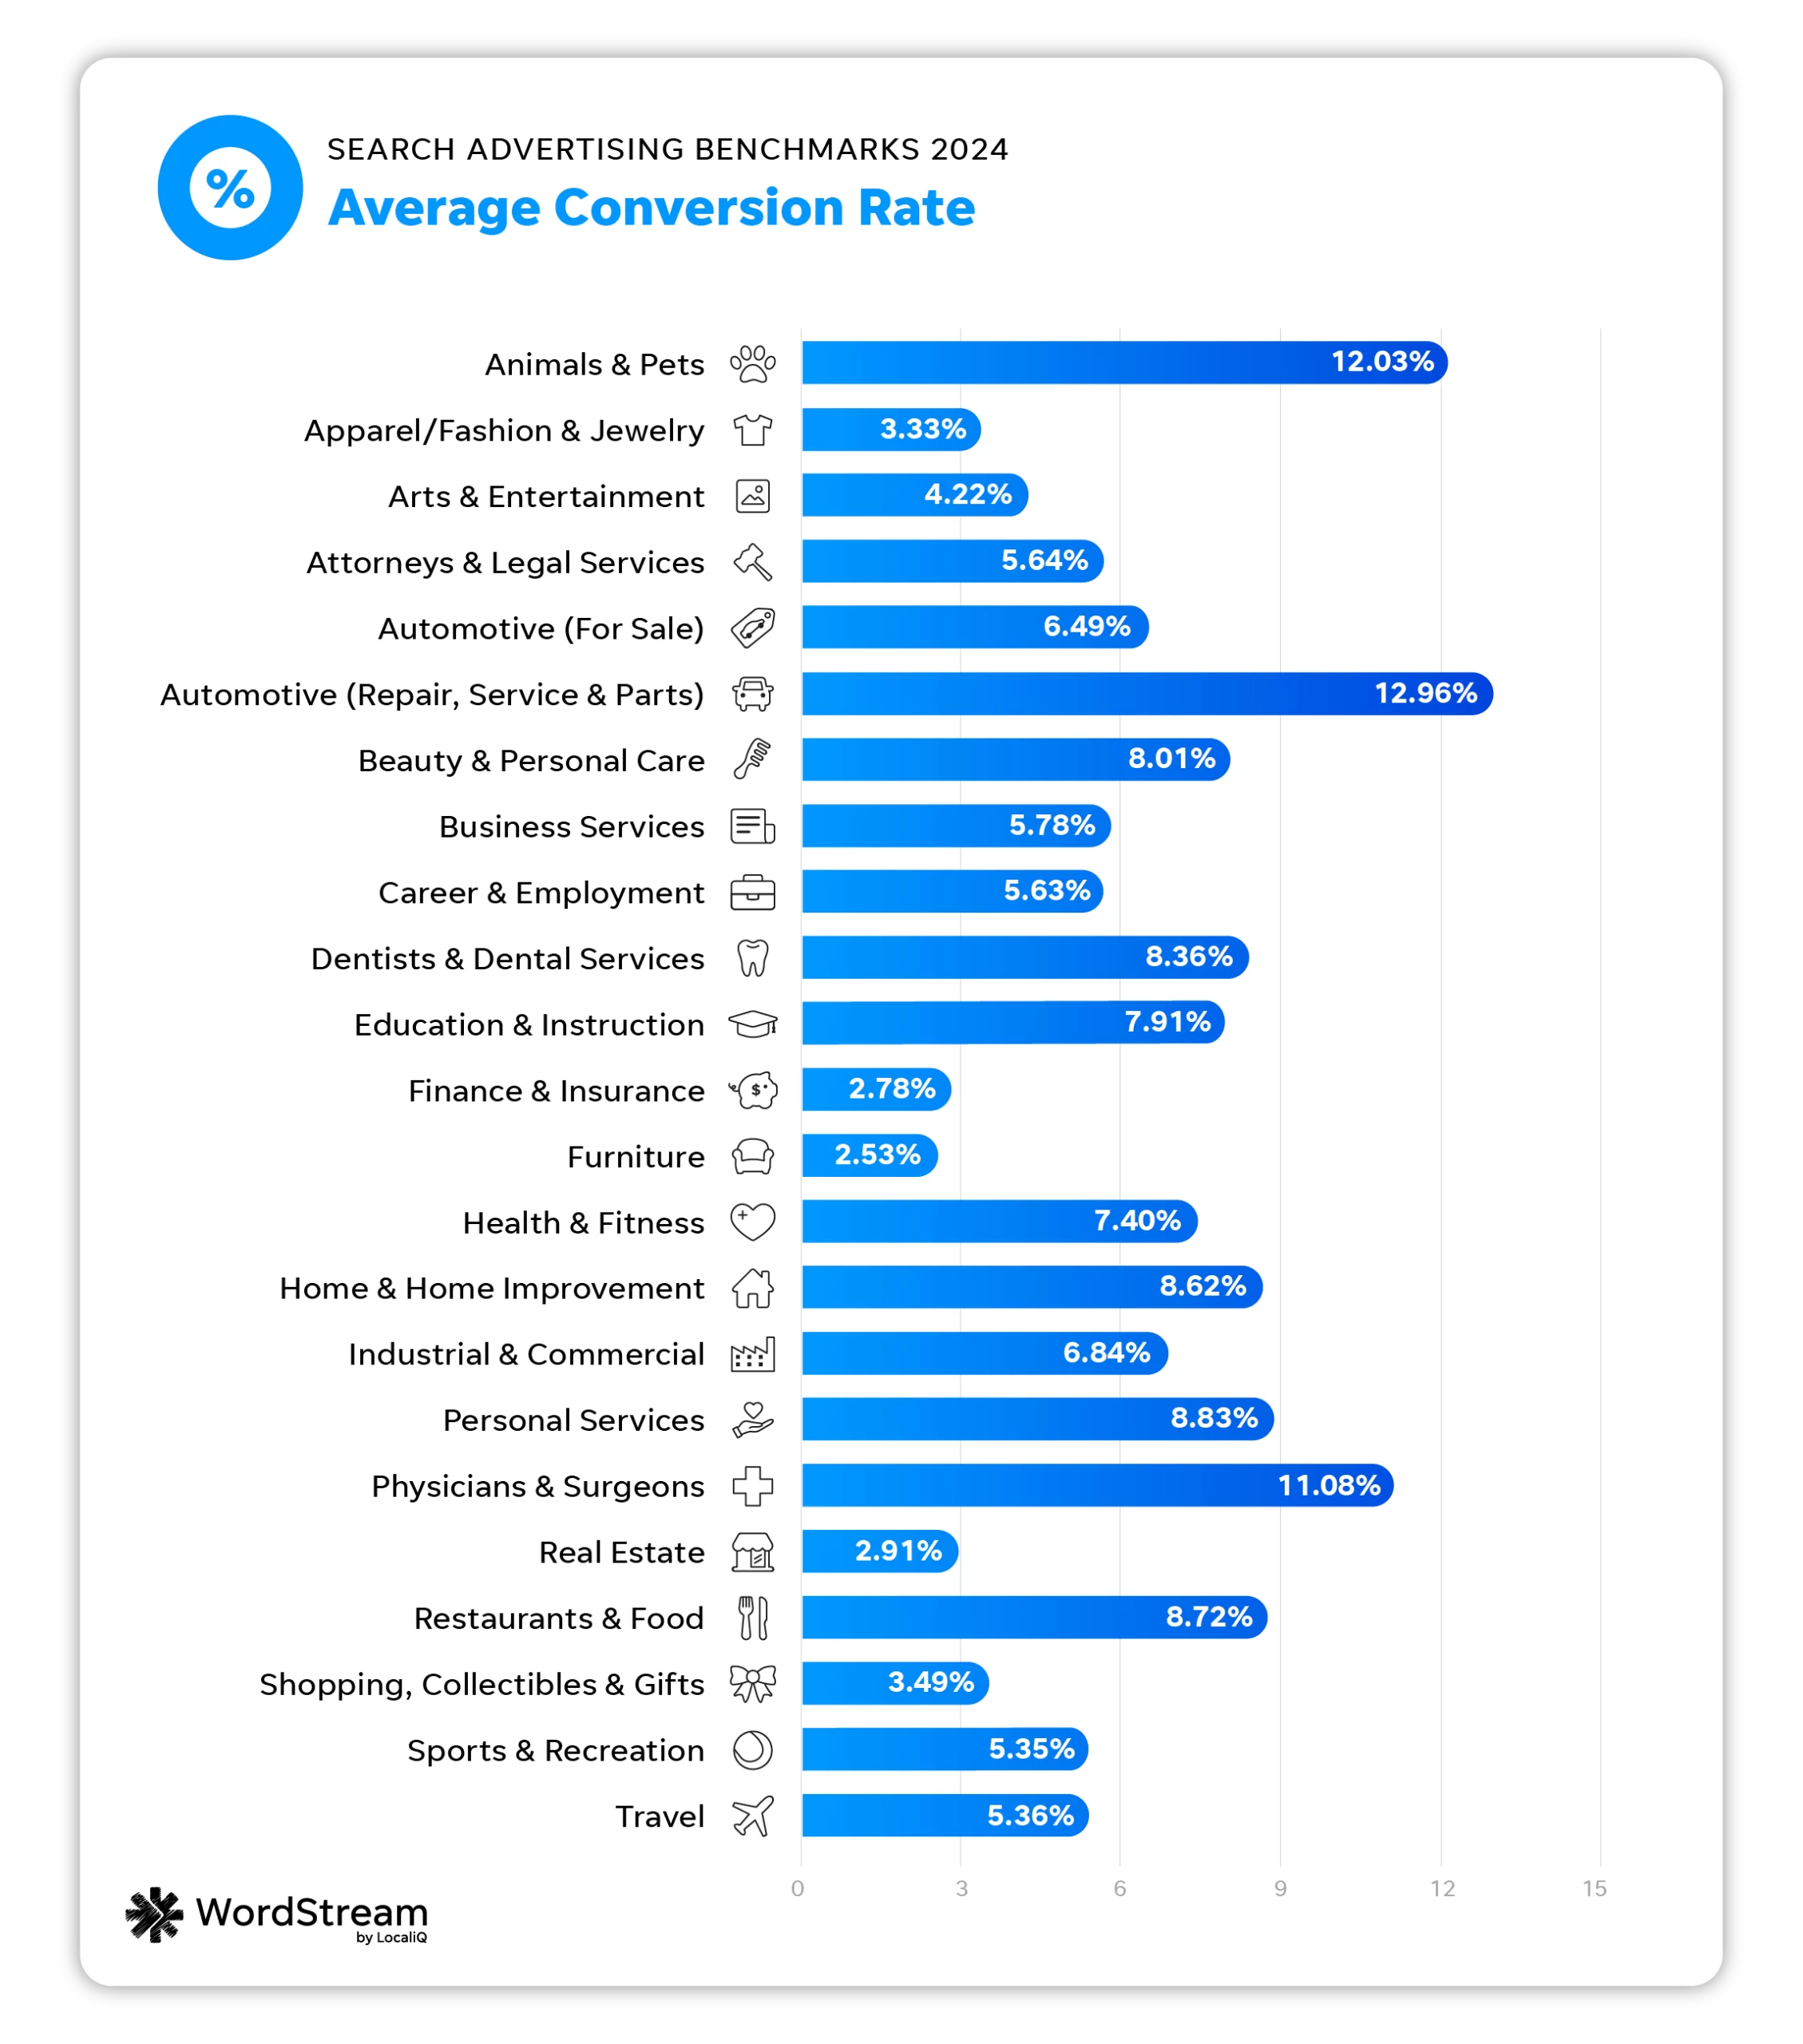
The average conversion rate in Google Ads in 2024 is 6.96%.

| Business category | Avg. CVR |
| Animals & Pets | 12.03% |
| Apparel / Fashion & Jewelry | 3.33% |
| Arts & Entertainment | 4.22% |
| Attorneys & Legal Services | 5.64% |
| Automotive — For Sale | 6.49% |
| Automotive — Repair, Service & Parts | 12.96% |
| Beauty & Personal Care | 8.01% |
| Business Services | 5.78% |
| Career & Employment | 5.63% |
| Dentists & Dental Services | 8.36% |
| Education & Instruction | 7.91% |
| Finance & Insurance | 2.78% |
| Furniture | 2.53% |
| Health & Fitness | 7.40% |
| Home & Home Improvement | 8.62% |
| Industrial & Commercial | 6.84% |
| Personal Services | 8.83% |
| Physicians & Surgeons | 11.08% |
| Real Estate | 2.91% |
| Restaurants & Food | 8.72% |
| Shopping, Collectibles & Gifts | 3.49% |
| Sports & Recreation | 5.35% |
| Travel | 5.36% |
The industries that had the highest average CVRs were Automotive Repair, Service, and Parts at 12.96%, Animals and Pets at 12.03%, and Physicians and Surgeons at 11.08%.
Industries that saw the lowest average CVRs were Furniture at 2.53%, Finance and Insurance 2.78%, and Real Estate at 2.91%.
As ads are blending into organic results, and often take up more space on the SERP even for search terms with low commercial intent, lower CVRs may be more common. This is because of an increase in clicks from people who may not be ready to convert.
Advertisers have to be really savvy in making the most of their spend and focusing their budget on the highest-intent keywords to maintain strong conversion rates.
Average conversion rate: YoY
The industries with the biggest conversion rate decreases were Finance and Insurance (-32.40%), Dentists and Dental Services (-19.57%), and Attorneys and Legal Services (-19.46%.)
The industries with the highest conversion rate increases were Apparel, Fashion, and Jewelry (112%), Career and Employment (80.97%), and Restaurants and Food (72.16%).
The 2024 overall average conversion rate of 6.96% is only slightly lower than last year’s average of 7.04%.
How to improve conversion rates
When you’re trying to improve your conversion rate, it’s important to first find any correlations between your conversion rate performance and your progress in other PPC metrics.
“All of your different KPIs (key performance indicators) give you a guide to what optimizations need to be made to improve your PPC results,” said Stephanie.
“While cost per conversion, conversion rate, and cost per lead are the indicators to focus most heavily on, a poor CTR or higher-than-needed CPC can also give you insights into a potential problem with your campaign—impacting the overall results. Each KPI should be reviewed both independently and within the bigger picture of overall results to see if they can be optimized to better improve your overall ROI.”
For example, if you find you have a low conversion rate but high CPCs, you should first try to get more clicks at a lower cost, since clicks are half the battle when securing conversions. You can learn more conversion rate optimization tips here.
Average cost per lead in search ads
You could say we saved the best metric in our benchmarks breakdown for last, since most advertisers use cost per lead as their core “money metric.” Cost per lead (also known as cost per conversion, cost per action, or cost per acquisition) determines how much a conversion sourced from a search ad costs your business on average.
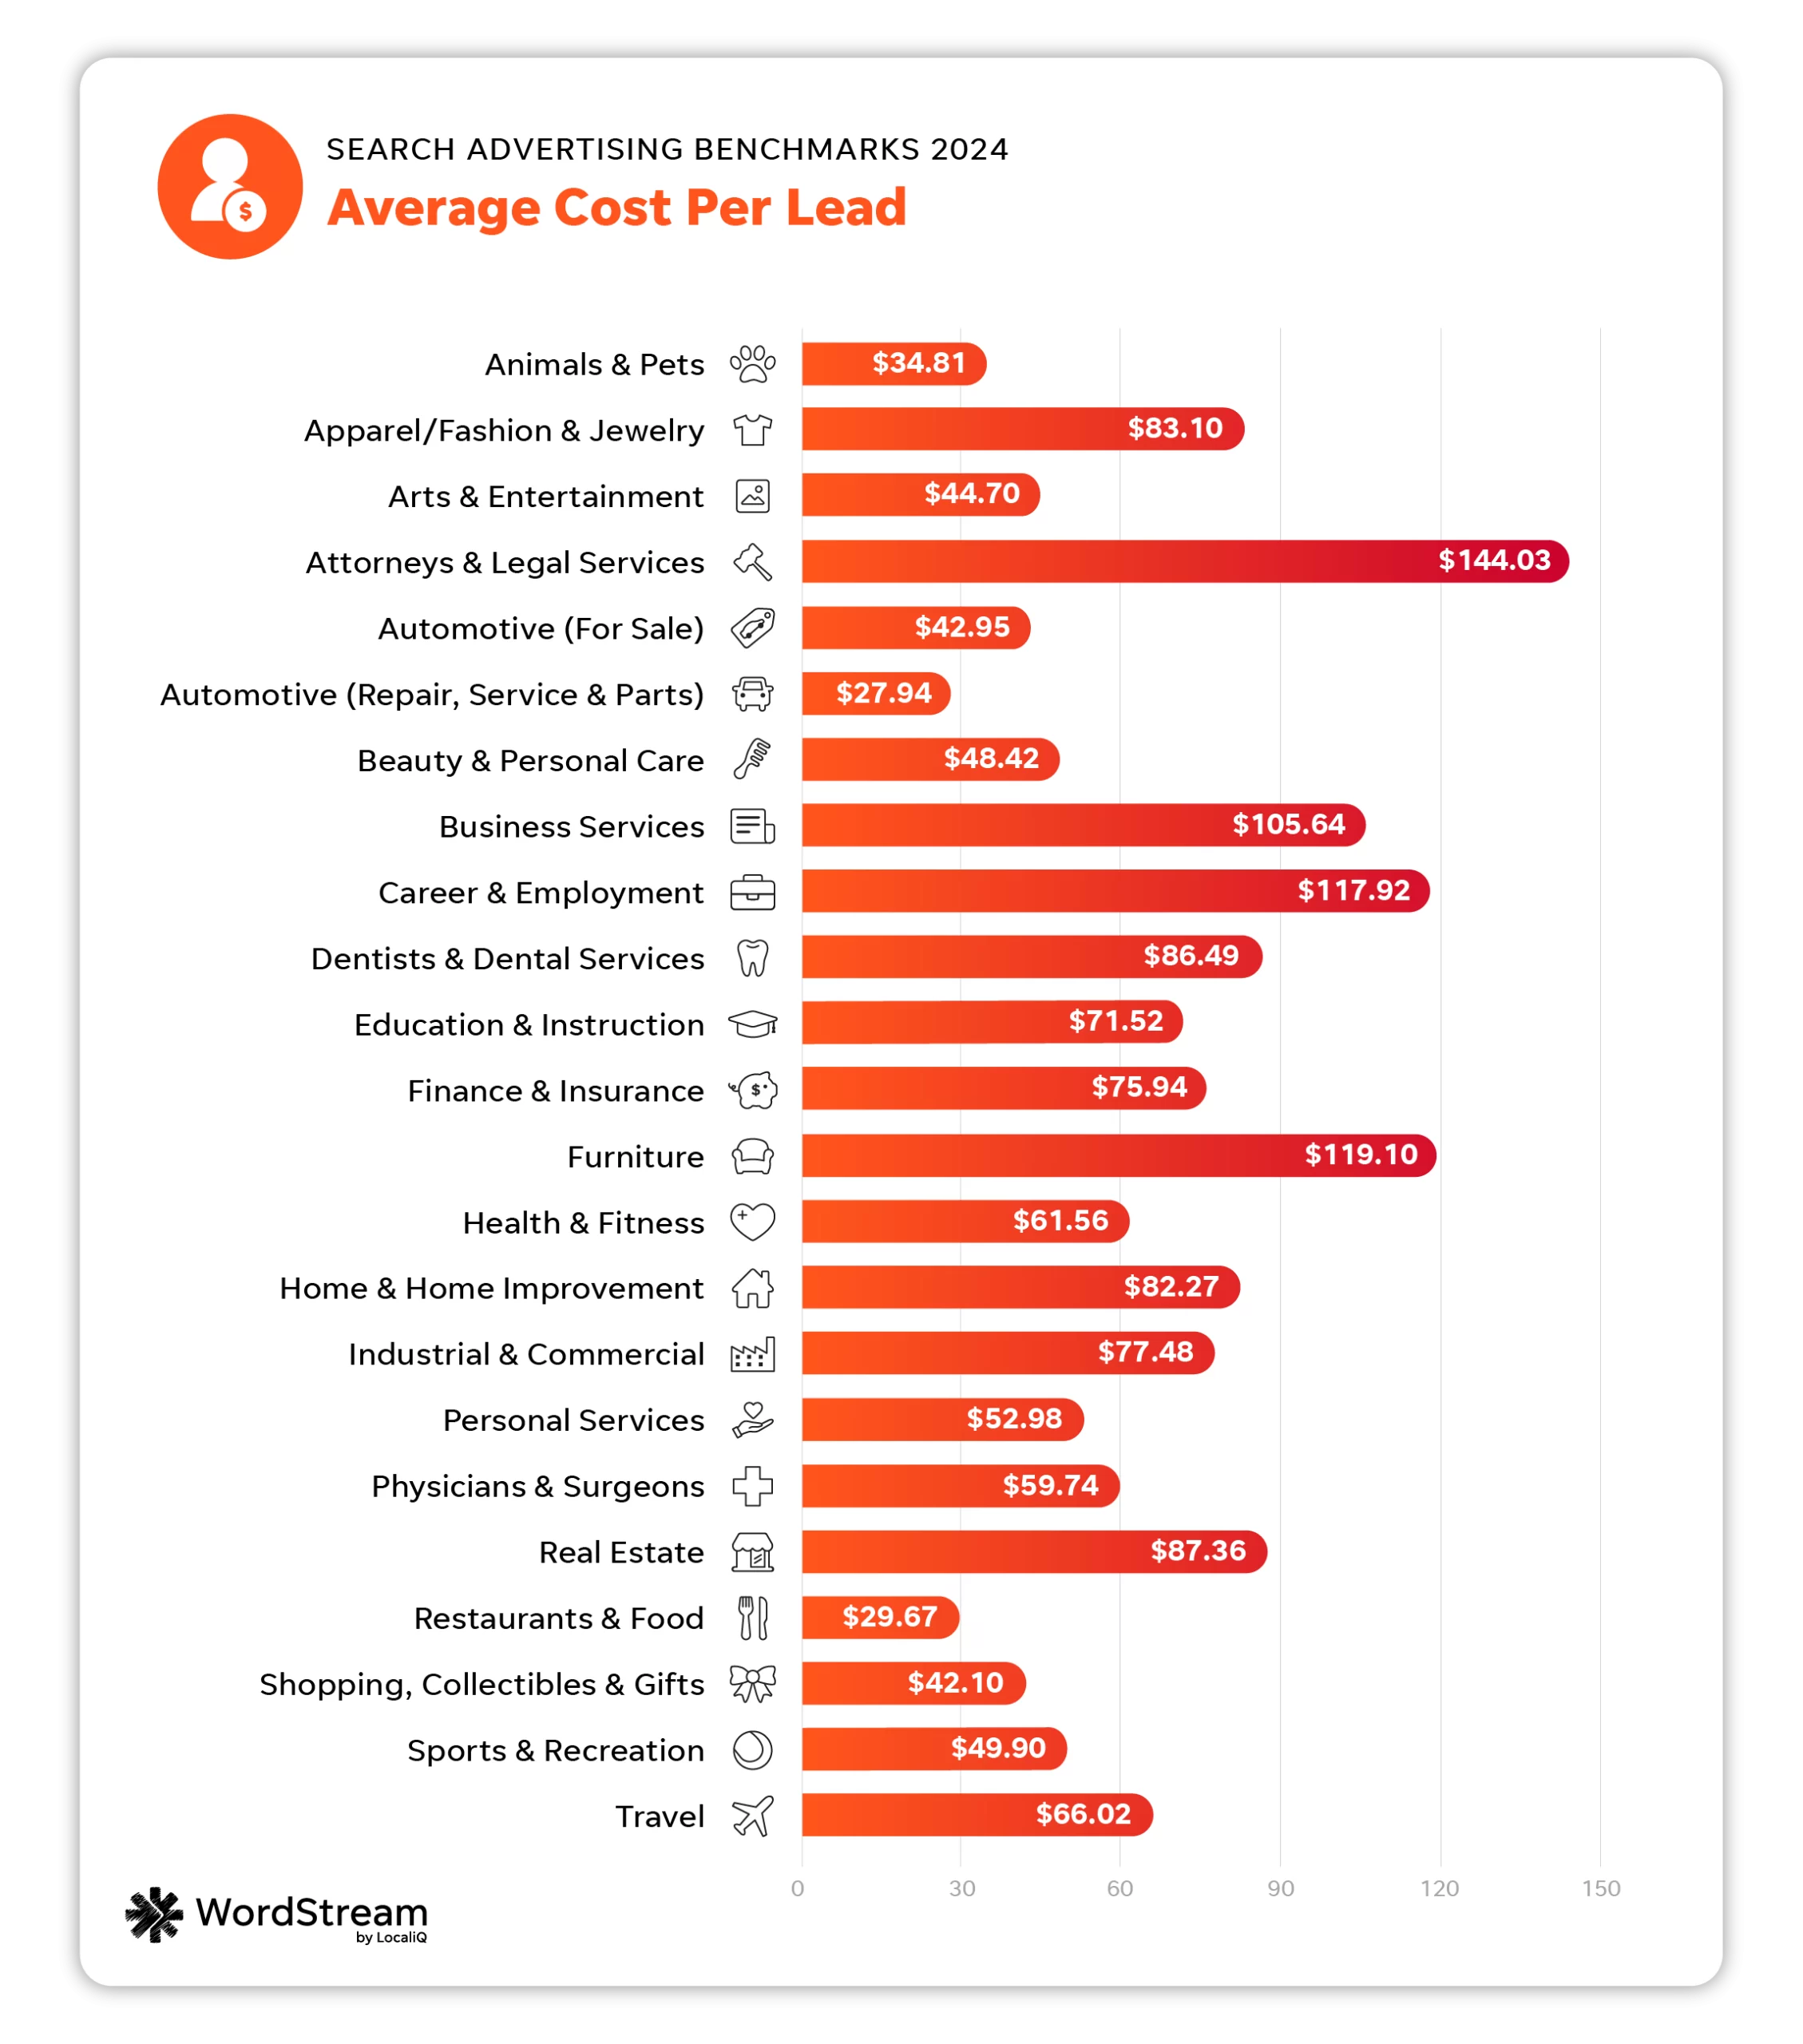
The average cost per lead in Google Ads in 2024 is $66.69.

| Business category | Avg. CPL |
| Animals & Pets | $34.81 |
| Apparel / Fashion & Jewelry | $83.10 |
| Arts & Entertainment | $44.70 |
| Attorneys & Legal Services | $144.03 |
| Automotive — For Sale | $42.95 |
| Automotive — Repair, Service & Parts | $27.94 |
| Beauty & Personal Care | $48.42 |
| Business Services | $105.64 |
| Career & Employment | $117.92 |
| Dentists & Dental Services | $86.49 |
| Education & Instruction | $71.52 |
| Finance & Insurance | $75.94 |
| Furniture | $119.10 |
| Health & Fitness | $61.56 |
| Home & Home Improvement | $82.27 |
| Industrial & Commercial | $77.48 |
| Personal Services | $52.98 |
| Physicians & Surgeons | $59.74 |
| Real Estate | $87.36 |
| Restaurants & Food | $29.67 |
| Shopping, Collectibles & Gifts | $42.10 |
| Sports & Recreation | $49.90 |
| Travel | $66.02 |
The industries with the lowest average CPLs were Automotive Repair, Service, and Parts at $27.94, Restaurants and Food at $29.67, and Animals and Pets at $34.81.
Industries with the highest average CPLs included Attorneys and Legal Services ($144.03), Furniture ($119.10), and Career and Employment ($117.92).
In the US versus Google antitrust trial, it was brought to light by the Department of Justice that Google has been increasing advertising costs. This article explains how Google “has the power to raise prices when it desires to do so.”
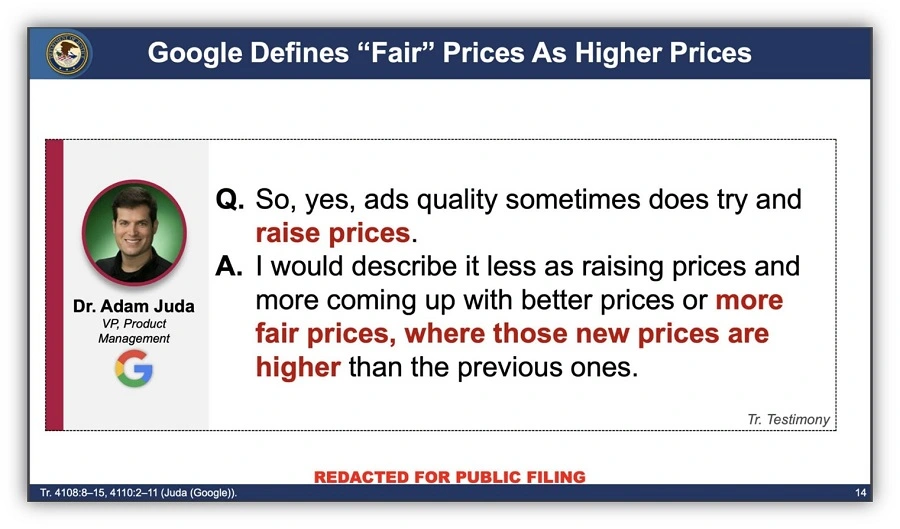

While this could have impacted overall costs for advertisers, it’s important to remember other factors beyond Google’s control (like the number of advertisers in your industry or your chosen account structure) still play a role in your cost per lead. So, if your industry has a higher cost per lead, you can identify ways to combat this—even if, at times, it feels like Google is hiking up prices.
Average cost per lead: YoY
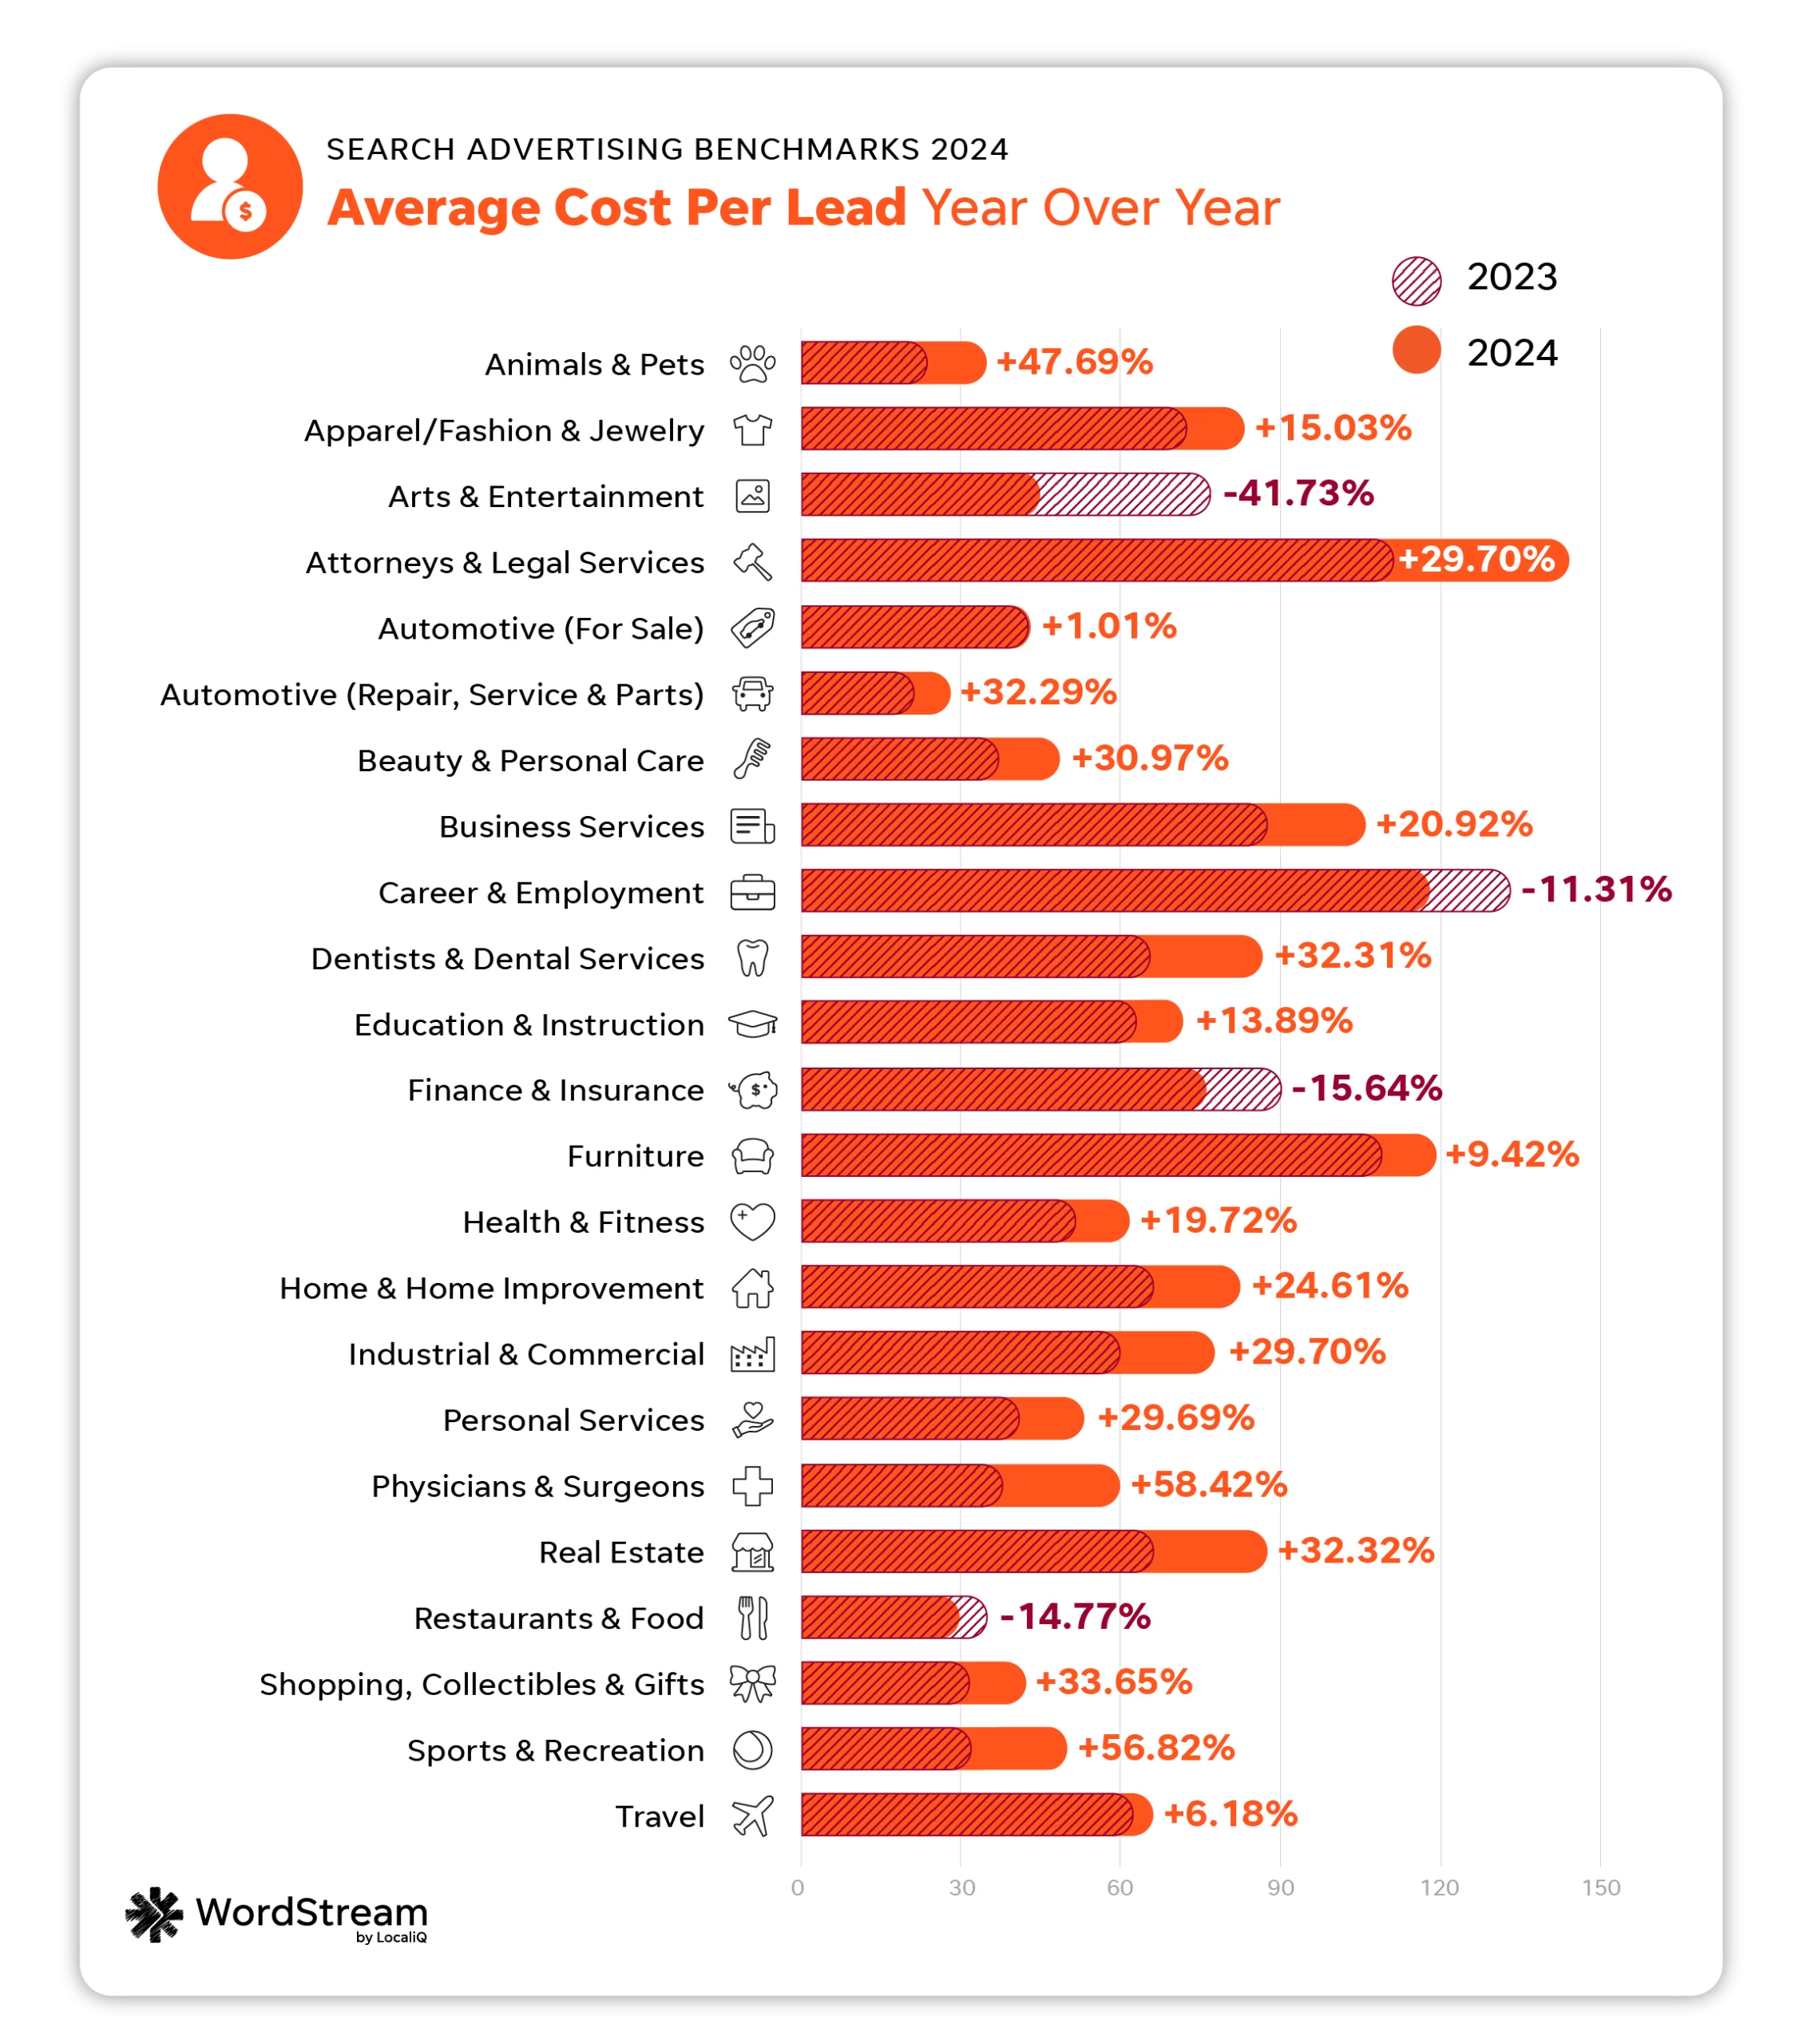
The industries with the biggest improvements in cost per lead were Arts and Entertainment (-41.73%), Finance and Insurance (-15.64%), and Restaurants and Food (-14.77%).
Alternatively, the industries that saw their cost per lead go up year over year were Physicians and Surgeons (58.42%), and Sports and Recreation (56.82%), and Animals and Pets (47.69%).
This year’s overall CPL of $66.69 is $13.17 higher than last year’s average of $53.52.

How to improve cost per lead
While it can be easy to get hung up on how your cost per lead compares to other businesses in your industry, it’s important to focus on what matters to your business’s bottom line and optimize for that.
“This year’s search advertising benchmarks underscore the critical need for campaign optimization. While rising click-through rates suggest a more receptive environment for ads, the cost of clicks increasing, as well as shifts in conversion rates and cost per lead, demonstrate significant variation across industries,” said Katia Hausman, Vice President of Ad Products at LocaliQ.
Keeping in mind that there are some fluctuations and variations when it comes to cost per lead metrics, you may want to see how you can optimize all your campaigns across platforms to bring down your overall cost averages. For example, how you’re attracting and tracking conversions will directly impact your cost per lead numbers.
“This data is actually very surprising—the gains in click-through rate seem to indicate that folks are getting less valuable traffic. Advertisers are doing a great job creating ads to get the user to click, but they may not be able to track the conversions, so cost per lead goes up,” said Navah Hopkins, PPC Evangelist at Optmyzr.
Navah added that there might also be “false positives” within an advertiser’s conversion tracking. This could lead to more low-value actions (such as button clicks) being counted as conversions—skewing conversion numbers to appear higher. Automated bidding strategies would then be thrown off and start to overbid on less valuable ads. This means that businesses need to keep a careful eye on their conversion tracking set-up.
You can uncover more ideas to lower your cost per lead here.
What these search ads benchmarks and trends mean for your business
If you’re wondering how you can take action on these search advertising benchmarks, we’ve got you covered.
1. A holistic approach to your search ad strategy is key
While it can be easy to get preoccupied with individual platform performance, expanding your business’s reach by running ads across multiple search engines is a way to maintain maximum overall marketing ROI.
What to do about it
By running search ads across multiple search engines, including Google and Microsoft, you can maximize your budget and offset potential cost increases.
“As Google Ads CPCs and cost per lead continue to rise, we actually see the reverse in Microsoft Ads. It’s an interesting trend that can help to offset growing costs,” said Katia.
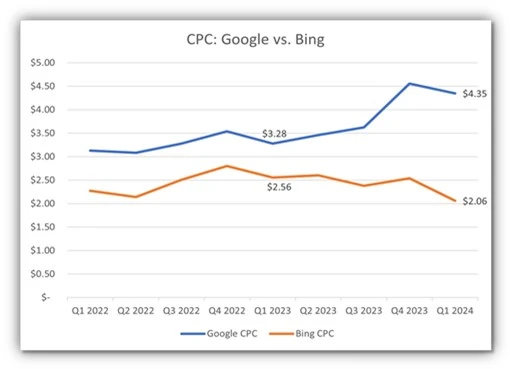

Data from US-based LocaliQ campaigns shows the difference in costs per click between Google and Microsoft.
2. AI and automation can boost results
Automation can help you keep your campaign optimized without sacrificing time or results. You can use automation and AI to simplify budget allocation, keyword management, and overall campaign optimizations.
What to do about it
It may take some trial and error, but look for AI-powered options within the platforms that work for your business; it can save you time and money in the long run.
“Don’t overlook the AI-driven features within Google Ads, such as Performance Max, broad match, and Demand Gen campaigns. These can significantly streamline campaign management and drive results, provided they’re fed with high-quality data,” said Alessandro.
3. Data-driven conversion tracking and first-party data are more important than ever
The upcoming deprecation of third-party cookies has been a hot-button topic within the PPC community for some time now. That said, with the sunset of third-party data fast approaching, it’s more important than ever to collect, organize, and act on your business’s owned, first-party data.
What to do about it
“These benchmarks emphasize the necessity for a data-driven approach to target the appropriate audience and optimize campaigns for conversions across all touchpoints (including websites and landing pages) within today’s competitive advertising landscape. Testing various optimization and bidding strategies continues to be instrumental in maximizing campaign performance,” said Katia.
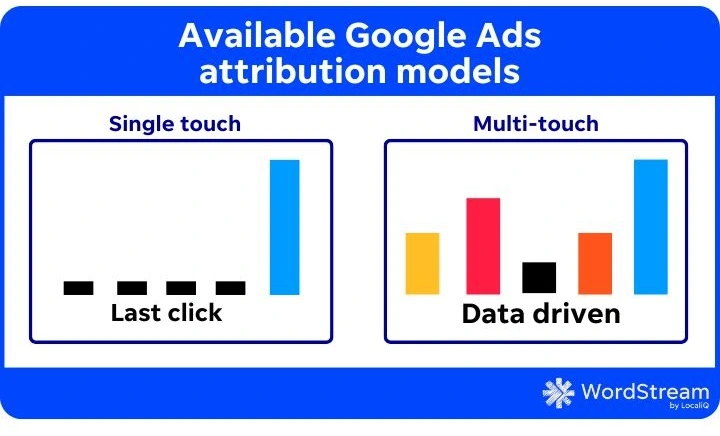
For example, your conversion tracking strategy should pivot to meet the new tracking capabilities Google has rolled out, like data-driven attribution modeling.
“My top tip for enhancing PPC results revolves around comprehensive conversion tracking and leveraging durable tactics to future-proof your setup. Implementing tools like Enhanced Conversions can provide invaluable insights into campaign performance and audience behavior,” said Alessandro.

4. Some metrics might thrive while others fluctuate
If you feel like your search performance is all over the place, you’re not alone. As Google and Microsoft continue to test and change parts of the search journey, results will fluctuate.
What to do about it
You may need to look at other metrics, like return on ad spend (ROAS), to get a clear picture of your search ad progress.
“ROAS helps you assess the profitability of your advertising efforts by measuring the revenue generated for every dollar spent on ads. It helps a lot with understanding how well a PPC campaign is doing when it comes to driving revenue,” said Goran.
You’ll also need to prioritize some metrics over others depending on your goals.
“Most of our discussions focus on CPL and CVR. There can be all sorts of factors leading to more clicks on ads like the placement, blending into organic results, and bidding strategies optimizing for engagement,” said Michelle Morgan, Co-Founder of Paid Media Pros.
“But the real test of an ad campaign is how much business it actually drives. While we pay attention to all metrics, our bigger efforts are focused on ensuring our campaigns are profitable from a CPL and CVR standpoint.”
So, while you may see a decrease in one metric, try to look out for other growth opportunities within your ad accounts.
A typical ad account could still recover from a poor search performance with the right first-party data.
“I don’t think these metrics should be taken as a sign of doom and gloom. Rather, they represent the reality of the privacy-first world,” said Navah.
“If you’re not able to connect your conversions, and if you’re not able to spend to meet thresholds for modeling, you’ll see the vanity metrics go up (like CTR), while conversion rates and CPL flounder.”
5. Additional optimizations to ad assets are making ads more clickable
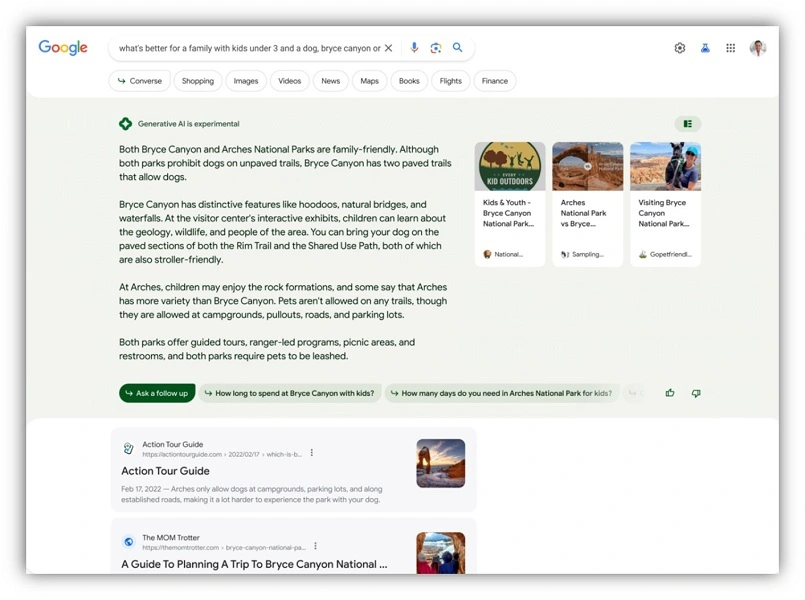
Not only are ads being incorporated into new search experiences, they also have the ability to blend in with organic results better than they have in the past—which may be part of the reason for the overall increase in CTR.
What to do about it
Take advantage of the optimization options available for your search advertising campaigns.
“Less than a decade ago, when I first made the WordStream benchmarks, the average CTR was 3.17%, and only one industry had a CTR above 6% (I thought that was an outlier at the time). Now the average is twice that! Ambitious advertisers might be able to realistically achieve double-digit CTRs this year with some creative work,” said Mark.
“We’re seeing Google more aggressively add images to their ads with image assets, Google Business Profile image assets, logo assets, and automating those for new advertisers as well. Not only are the ads becoming more attractive, but Google is also making them look less like ads at the same time.”

6. Google’s Search Generative Experience and Gemini can impact ads
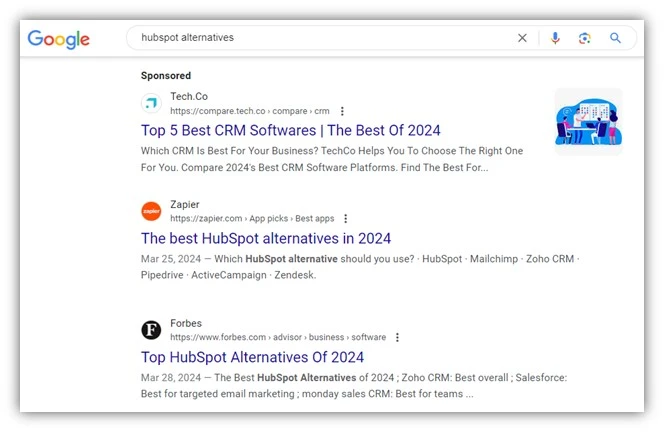
The evolution of Google Ads isn’t just apparent from the advertiser’s perspective, but from the searcher’s perspective as well. For example, Google Gemini and the new Search Generative Experience (SGE) is changing how search results are curated and viewed.
“As SGE became more widely used over the past year and ads have been rolled out in that experience, I think we’re seeing that Google is still in the early stages of optimizing that experience for advertisers. Some of the top areas that Google has boasted its SGE product, like shopping and home improvement, are some of the industries where advertisers have the steepest drops in CTR,” said Mark.
“It’s likely that as people turned to Gemini in 2023 (formerly Bard), users may have seen new ad impressions from their AI chat companions. But unfortunately, those ads may not have been as great a response to their detailed organic responses and had relatively low CTRs when compared to more traditional searches. This growing SGE trend may be artificially dragging down the CTRs from advertisers in these industries,” said Mark.
What to do about it
Continue to evolve your ad copy, keyword intent, and landing pages to be more easily pulled into conversation-style search results. Consider what questions your customers may be looking to get answered by Gemini.
“The uptick in CTR, likely fueled by Google’s evolving SERP design, is also something I’ve seen firsthand. However, the data’s emphasis on the disconnect between higher CTR and lower conversions is interesting. In my view, it highlights the growing importance of proper audience targeting and intent optimization in Google Ads,” said Alessandro.

7. Economic shifts correlate with search ad metric fluctuations in certain industries
You might notice that some industries saw more aggressive year over year changes than others. This is no coincidence, as many external economic factors impact certain verticals more than others.
What to do about it
Take note of your industry’s strengths and weaknesses in the search advertising space. For example, if your industry has slowed during times of economic fluctuation, you may need to rethink how you approach your ads when your customers aren’t ready to buy.
“I think the finance and real estate industries are fascinating in how dramatically you’re seeing them change,” said Mark.
“As it becomes clear that interest rates are likely to stay high for a while and all financial advertisers now have less flexibility in their offers, their ads are becoming less competitive and less attractive from the otherwise bleak news on the SERP. However, at least this industry’s CPC is equally becoming less competitive as these advertisers have less of an edge to outbid each other.”
Meanwhile, real estate is seeing similar issues as the financial market, but real estate ads are struggling less.
“Price and mortgage costs may not be call-outs in their ads, but location, features, and new opportunities are much easier to attract clicks on the SERP, so their ads are still performing strong enough to maintain their CTR (and possibly CVR). This justifies for real estate businesses to increase their budgets to remain competitive in an industry that’s struggling offline,” said Mark.
8. Regular PPC audits are more important than ever
If there is one final takeaway from our 2024 Google Ads industry benchmarks report, it’s that staying on top of your account performance this year is critical as industry averages continue to fluctuate year over year.
What to do about it
Try scheduling regular PPC audits to see how your PPC metrics are pacing against the benchmarks in your industry.
“By regularly analyzing and refining keywords, ad copy, targeting, and bidding strategies—businesses can ensure that their ads are reaching the right audience and generating the best possible results.
In marketing and advertising, staying proactive and making data-driven adjustments is what gets rewarded,” said Goran.
Take action on these search advertising benchmarks
When it’s time to measure your PPC performance, and you’re not sure where to start, these benchmarks can be a guiding light. However, try to remember that no two Google Ads accounts are the same. What might work for one advertiser may not work for another. So, keep in mind that there is no right or wrong answer for how you approach your PPC strategy.
That said, using data like the averages in this report can help you make informed decisions about your marketing and advertising. The sooner you start to track and pivot your ad strategy, the better! Plus, if you find you still want more out of your PPC ads as you start optimizing your account, our solutions are here to help you make the most out of your search campaigns.
About the data
This report is based on a sample of 17,998 US-based search advertising campaigns running between Apr 1, 2023, and March 31, 2024. Our proprietary platform dynamically shifts budget between search channels on a campaign-by-campaign basis, but in aggregate, 80-85% of spend was allotted to Google Ads and 15-20% to Microsoft Ads. Each subcategory includes at minimum 70 unique active campaigns. “Averages” are technically median figures to account for outliers. All currency values are posted in USD.
-

 PPC7 days ago
How the TikTok Algorithm Works in 2024 (+9 Ways to Go Viral)
-
 SEO6 days ago
How to Use Keywords for SEO: The Complete Beginner’s Guide
-
 MARKETING7 days ago
How To Protect Your People and Brand
-
 MARKETING4 days ago
Advertising on Hulu: Ad Formats, Examples & Tips
-

 MARKETING5 days ago
Updates to data build service for better developer experiences
-
 MARKETING1 day ago
18 Events and Conferences for Black Entrepreneurs in 2024
-

 MARKETING6 days ago
The Ultimate Guide to Email Marketing
-
 WORDPRESS4 days ago
Best WordPress Plugins of All Time: Updated List for 2024


