SEO
Google Explains Why Sites Should Combine Structured Data

Google’s Lizzi Sassman answered a question in a Google SEO Office hours session about whether it’s okay to combine different structured data types.
The answer illuminated an important point about how Google interprets structured data and whether it’s better to combine structured data or two separate them out.
Combining multiple structured data is called nesting.
What is Nesting?
Structured data is basically about high level data types (called Types) and the attributes of those Types (called Properties).
It’s kind of like with HTML where the main HTML building blocks of a webpage are called Elements and every element has properties that modify them that are called “attributes.”
The HTML of a webpage begins by communicating that it’s an HTML webpage like this:
<HTML>
Similarly, a structured data script begins by saying what the main structured data for the webpage is.
A recipe structured data on a webpage that is about a recipe looks like this:
<script type="application/ld+json">
{
"@context": "https://schema.org/",
"@type": "Recipe",
Nesting is the addition of other structured data types within the main structured data.
So if the page is about Reviews, then the main structured data should begin like this:
<script type="application/ld+json">
{
"@context": "https://schema.org/",
"@type": "Review",
But what about when the page is about a recipe and it has a review?
Do you create two structured data scripts?
Or do you combine the two structured data types?
Lizzi Sassman shares that there is a right and a wrong way to do it.
Is Combining Structured Data Allowed?
Structured data follows a logical set of rules. Once the rules are learned it’s easy to make sense of structured data.
This question is about the organization of structured data and how that impacts how Google interprets it.
This is the question that was asked:
“Is it allowed to add one structured data inside another type of structure data? For example, adding carousel structured data inside Q & A structured data.”
Lizzi Sassman answered:
“Yep. Nesting your structure data can help us understand what the main focus of the page is.
For example, if you put recipe and review at the same level, it’s not as clear as telling us that the page is a recipe with a nested review.
This means that the primary purpose of the page would be a recipe and that the review is a smaller component of that.
As a tip, always check the specific feature documentation to see if there’s any more notes about combining various structure data types.
Right now, the only supported carousel features are course, movie, recipe, and restaurant.”
Structured Data Tells Google What a Page is About
This is really interesting because what Lizzi is saying is that the structured data helps Google understand what a webpage is about.
But if you have two separate structured data scripts on the same webpage it makes it harder for Google to understand what the “focus” of the webpage is about.
She advises that it’s best to combine them so that the first part says what the webpage is about.
So if the webpage is about recipes, the structured data should start like this:
<script type="application/ld+json">
{
"@context": "https://schema.org/",
"@type": "Recipe",
Google’s Search Central documentation about JSON-LD structured data discusses nesting:
“JSON-LD* (Recommended)
A JavaScript notation embedded in a <script> tag in the <head> and <body> elements of an HTML page.The markup is not interleaved with the user-visible text, which makes nested data items easier to express, such as the Country of a PostalAddress of a MusicVenue of an Event.
Also, Google can read JSON-LD data when it is dynamically injected into the page’s contents, such as by JavaScript code or embedded widgets in your content management system.”
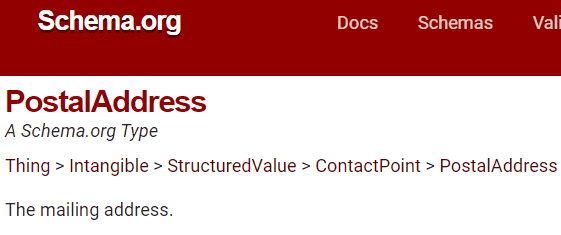
What the above quoted section from Google’s documentation means, in plain English, is that a webpage that is about a musical event (using the Event) structured data type, can also include additional data types for the music venue and the postal address.
The webpage in the above example is about an Event, not the venue of the event.
So the JSON-LD script that contains the Event structured data would begin like this:
<script type="application/ld+json">
{
"@context": "https://schema.org",
"@type": "Event",
Event is a structured data type:
And the Postal Address for where the event takes place is also a structured data type:
Communicate the Focus of the Webpage
Sometimes it can feel like the “O” in SEO means optimizing a webpage for better rankings. But that’s not what search optimization is.
The “O” in SEO stands for means optimizing a webpage so that it’s easy for search engines to crawl and to understand what the webpage is about.
A webpage can’t rank without accomplishing those two optimizations.
Nesting structured data fits into that paradigm of “optimization” because it helps to make it clear what the focus of the webpage is.
Listen to the Google SEO Office Hours session at the 14:58 minute mark.
Featured image by Shutterstock/Asier Romero
SEO
Apple’s “Intelligent Search” Will Summarize Webpages

A report based on independently verified accounts notes that Apple’s Safari 18 will come with an Intelligent Search feature that summarize webpages in response to search queries and there may be a new feature called Web Eraser that allows users to permanently remove text, images, advertisements from webpages.
The Potential For Disruption By Apple AI Search
Apple has been gathering website data for years through its Internet crawler that uses the user agent, Applebot. The harvested data has in the past been used in the context of Siri and Apple’s Spotlight Suggestions feature.
Many in the search community have been aware of Applebot and have welcomed the prospect of a new search engine from Apple but despite constant crawling Apple has not released a search engine. A reason Apple has not released a standalone search engine may be that it’s become apparent that the best way to challenge Google Search is with a technology that replaces search engines altogether, much like how the Apple iPhone made digital cameras obsolete.
The latest news coming out about Safari 18 appears to confirm that supplanting Google is the strategy that Apple is pursuing.
The approach Apple is taking has the potential to disrupt not just search engines but also the search optimization and publishing industry, who have have been waiting years for an Apple search engine. But the extent of that disruption depends on how Apple implements their AI web search summarizer.
Webpage Summarization
Although news reports didn’t provide details as to how the new search result summaries will appear, it seems reasonable to speculate that Apple will provide attribution in the form of a link to websites so that users can click through to the website.
This is what was reported:
“With the release of Safari 18, Apple is expected to introduce article summarization through a new Intelligent Search feature — meaning users will have the option to generate a brief summary of any webpage currently on screen.
Apple’s built-in AI software can analyze the keywords and phrases within a webpage or document and generate a short summary containing only the most important information.”
SEOs have been giddy about the prospect of an Apple search engine for years. It now appears that the Google Killer they’ve been waiting for could possibly result in less traffic from search queries but to what extent it’s impossible to tell at this point.
One search marketing expert mused in a private chat that if Intelligent Search summarizes more than it links out then that may signal it’s time to start selling off the domain names they’ve invested in.
On-Device Processing
An interesting feature of the text summarization is that the technology that creates the summary (called Ajax) resides on the mobile device itself. What Ajax does is extract keywords, entities, and use the data to identify the topic and a loose summary of a webpage which is then turned into a text summary for the user.
This is how the functionality is described:
“In analyzing texts, the software takes into account all relevant information available. It can recognize and classify entities such as companies, people, and locations. For instance, if a name appears at the top of a text, the software will likely recognize the name as belonging to the text’s author.”
Apple Also Plans A Web Eraser
As if an Apple search summarizer isn’t bad enough Apple reportedly has a “Web Eraser” functionality planned for Safari. Web Eraser is a feature that removes content from webpages so that site visitors don’t have to look at it anymore. Things like advertising, videos, comments, suggested reading and maybe even popups could be permanently blocked by the Web Eraser. Once a user “erases” a block of content from a webpage that block stays erased for the site visitor on subsequent visits.
According to the a report about the Apple Web Eraser:
“The feature is expected to build upon existing privacy features within Safari and will allow users to erase unwanted content from any webpage of their choosing. Users will have the option to erase banner ads, images, text or even entire page sections, all with relative ease.”
Technological Disruptions
It’s a natural response to experience anxiety in the face of changes. For many, the dawning of AI Search is their first experience of a major change. But for those of us who have been in search for 25+ years we have experienced and grown accustomed to sudden and transformative changes that alter publishing and SEO. I tend to feel that Apple’s implementation of an AI search engine that summarizes websites will be disruptive but not to the point that it harms websites. It’s in Apple’s self-interest to not disrupt the Internet to the point of extinction.
Featured Image by Shutterstock/frantic00
SEO
128 Top SEO Tools That Are 100% Free

Software makes the SEO world go round. From analyzing your website data to performing research, effective SEO relies on a series of tools to assist humans in decision-making.
Paid subscription tools can be highly effective and usually come with support. But if you don’t have a large monthly budget, they might be out of the question.
The good news is that there are plenty of free tools. With a bit of time and know-how, you can create a free stack of software that helps you achieve your SEO goals.
What Are SEO Tools?
Think of SEO tools as your digital magnifying glass and toolkit for your website. They’re not just about providing numbers and graphs; they’re about offering insights and strategies to enhance your website’s visibility and performance.
These tools are the compass and map for navigating the vast world of search engine optimization, helping you pinpoint exactly where you stand and what steps you need to take to improve and boost visibility in search engine results pages (SERPs).
Each SEO tool has a unique function, just like how a hammer is distinct from a screwdriver in a traditional toolbox. They offer specialized assistance in various aspects of SEO:
- Analytics – Understand your website traffic and user behavior.
- Keyword Research – Discover what your audience is searching for.
- Links – Analyze your backlink profile and build quality links.
- Local SEO – Optimize your site for local search results.
- Mobile SEO – Ensure your site is optimized for mobile users.
- On-page SEO – Improve the content and structure of your website pages.
- Research – Dive deep into market trends and competitor strategies.
- Rank Checking – Monitor where your pages stand in search results.
- Site Speed – Enhance the loading speed of your pages.
- WordPress SEO – Optimize your WordPress site specifically for SEO.
SEO tools are incredibly useful, but you must understand how to use them to get the most out of them.
There are even a few toolsets that can help you in more than the areas we just mentioned, giving you more of an all-at-once glance at your SEO performance.
Do You Need SEO Tools?
The short answer is yes, you need SEO tools.
Imagine trying to build a table using only your hands.
You wouldn’t get very far, would you? No.
You will need tools – saws, a measuring tape, a drill, and screwdrivers, to name a few.
Similarly, while you can certainly create a website with basic knowledge and intuition, truly optimizing and understanding its performance requires the right tools.
Without them, you’re essentially playing a guessing game.
Without SEO tools, you’re missing out on:
- The volume of traffic reaching your site.
- Alerts on sudden drops in website visits.
- Identifying and fixing HTML errors.
- Tracking the quantity and quality of your backlinks.
- Discovering potential keywords to drive more traffic.
- And much, much more.
So, while it’s theoretically possible to manage a website without SEO tools, if you’re serious about maximizing its potential and reaching your audience effectively, leveraging these tools isn’t just recommended – it’s essential.
What Are The Best Free SEO Tools?
If you’re looking to get started with SEO or want to achieve better results for the low cost of $0, here are 110 of the best free SEO tools you should be using.
Free SEO Analytics Tools
1. Google Analytics 4
Google Analytics 4 is an invaluable resource that is virtually indispensable to any digital marketer serious about SEO.
It provides plenty of handy data about websites, such as the number of site visits, traffic sources, and location demographics.
With the detailed information from Google Analytics, digital marketers can tweak their content strategy and figure out what works and what doesn’t.
Google Analytics 4 is one of the best free SEO tools that every digital marketer should be using.
2. Looker Studio (Formerly Data Studio)
Google Looker Studio lets you merge data from varying sources, such as Google Search Console and Google Analytics, and create sharable visualizations.
If you’re just getting started with it, this beginner’s guide to Data Studio will be helpful.
More advanced users can learn how to use CASE statements for better Data Studio segments here.
3. Keyword Hero
Missing keyword data? Leave it to Keyword Hero, which uses advanced math and machine learning to fill in the blanks.
This service is free for up to 2,000 sessions per month. Keyword Hero also provides a 14-day free trial of any of its plans.
4. Mozcast
Mozcast tracks changes big and small to Google’s search algorithm.
With Google making hundreds of changes every year, keeping abreast of the latest developments helps you ensure you’re doing everything to have the best SERPs.
5. Panguin Tool
The Panguin Tool, provided by Barracuda Digital, lines up your search traffic with known changes to the Google search algorithm.
If you see a drop that lines up with an update, you’ve likely found the culprit and can work on fixing it!
6. Google Search Console Enhancer
A Chrome extension that beefs up your Google Search Console (GSC) with additional features and insights. Google Search Console Enhancer is like putting a turbocharger on your Console, providing you with more detailed data to fine-tune your SEO approach.
7. Better Regex In Search Console
This nifty Chrome extension amps up your Google Search Console experience.
If you’re into the nitty-gritty of SEO data, this tool helps you create more sophisticated search patterns to dive deeper into your website’s search query data.
8. Lost Impressions Index Check
This tool from TameTheBots helps you uncover potential SEO opportunities by identifying where you might be losing visibility in search results.
Free Crawling & Indexing Tools
9. Redirect Path
 Screenshot from Redirect Path, March 2024
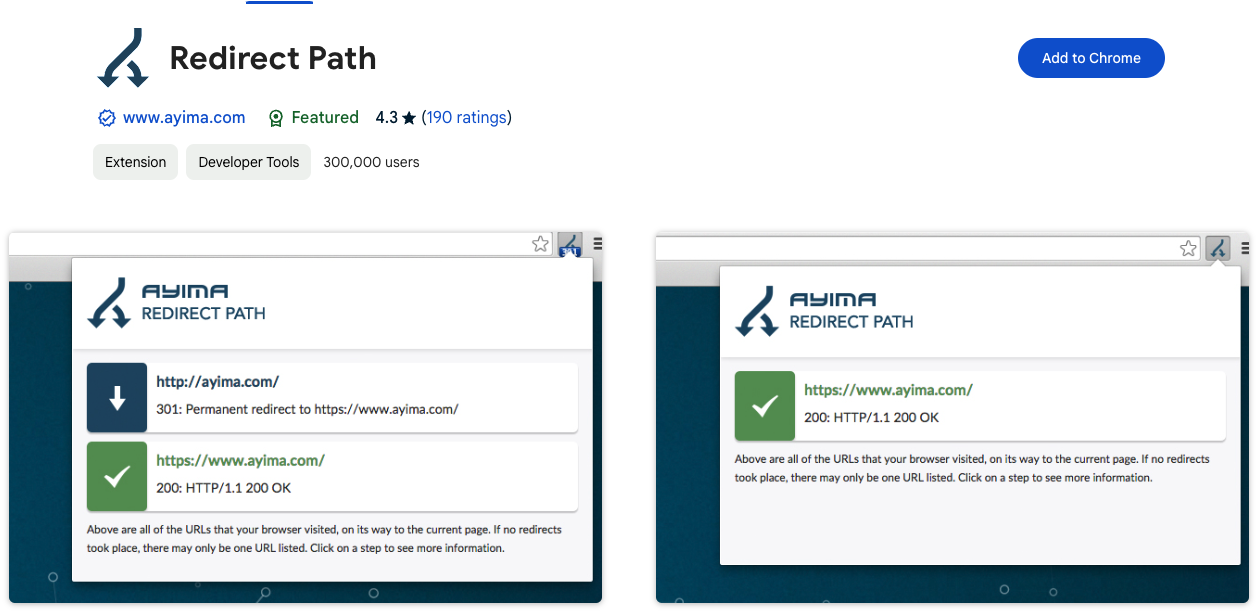
The Redirect Path Chrome extension will flag 301, 302, 404, and 500 HTTP Status Codes.
Additionally, client-side redirects like meta and JavaScript redirects will also be flagged, ensuring any redirect issue can be uncovered immediately.
HTTP Headers, such as server types and caching headers, as well as the server IP address, can also be displayed with the click of a button.
Furthermore, all of these details can be copied to your clipboard for easy sharing or addition to a technical audit document.
10. Link Redirect Trace
Use this Chrome plugin to make sure all your link redirects are directing people and crawlers to where you want them to go.
11. Screaming Frog SEO Spider
Crawl your website for SEO errors.
Discover HTTP header errors, JavaScript rendering hiccups, excess HTML, crawl mistakes, duplicate content, and more with Screaming Frog SEO Spider.
12. Screaming Frog Log File Analyzer
Upload your log files to Screaming Frog’s Log File Analyzer to confirm search engine bots, check which URLs have been crawled, and study search bot data.
13. SEOlyzer
Another SEO log analysis tool that provides data in real-time and page categorization.
14. Xenu
One of the original free SEO tools, Xenu is a crawler that provides basic site audits, looks for broken links, and the other usual suspects.
15. Where Goes?
Track where redirection URLs and shortened links go with Where Goes?
16. Check My Links
 Screenshot from Check My Links, May 2024
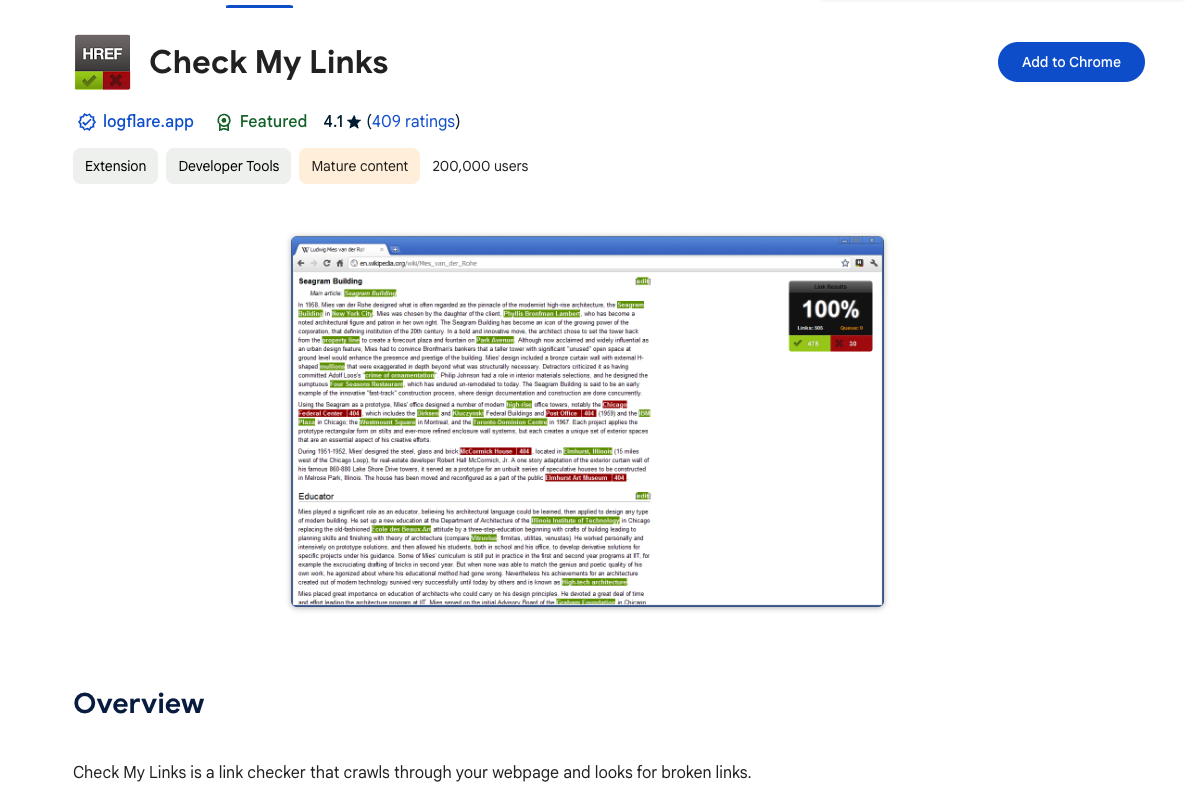
Check My Links is a nifty Chrome Extension that crawls through your webpage and identifies the status code for each link on the page – including broken links.
Each status code is color-coded with 200 status codes returning dark green, 300 status codes returning light green, and 400 status codes returning red.
Once identified, you can copy all bad links to your clipboard with one click.
17. Robots.txt Generator
Create a correct robots.txt file instantly so search engines know how to crawl your website.
Advanced users can customize their files with Robots.txt Generator as well.
18. HEADMaster SEO
Checks URLs in bulk for status code, redirect status, response time, response headers, and HTTP header fields with HEADMaster SEO.
Get results in real-time, sort and study your findings, and export your work to CSV.
19. Keep-Alive Validation SEO Tool
Check URLs in bulk – or one by one – to see if their servers support persistent connection, which makes your website load faster.
Check what version of HTTP your server is on and whether there are any external connections on your URL with this tool.
20. Hreflang Tag Generator
Generate hreflang tags so that Google knows which language particular pages on your website are in.
This will allow Google to search those pages in that language.
21. XML Sitemaps
Create a site map of up to 500 pages for free without registration.
Download your sitemap as an XML file or get it via email.
22. SERP Checker
Determine the potential ranking difficulty of a keyword with Ahrefs’ free SERP Checker tool.
You can check the top 10 search ranking results from any location without using proxies or location-specific IP addresses.
23. SFAIK Screaming Frog Analyzer
A robust visualization of Screaming Frog crawl data using Google Data Studio.
24. SEOWL Google Title Rewrite Checker
This Google Title Rewrite Checker will allow you to check if Google is rewriting the title of a list of pages, allowing for deeper Title Tag structure analysis.
Free Keyword Research Tools
25. AnswerThePublic
 Screenshot from AnswerThePublic, May 2024
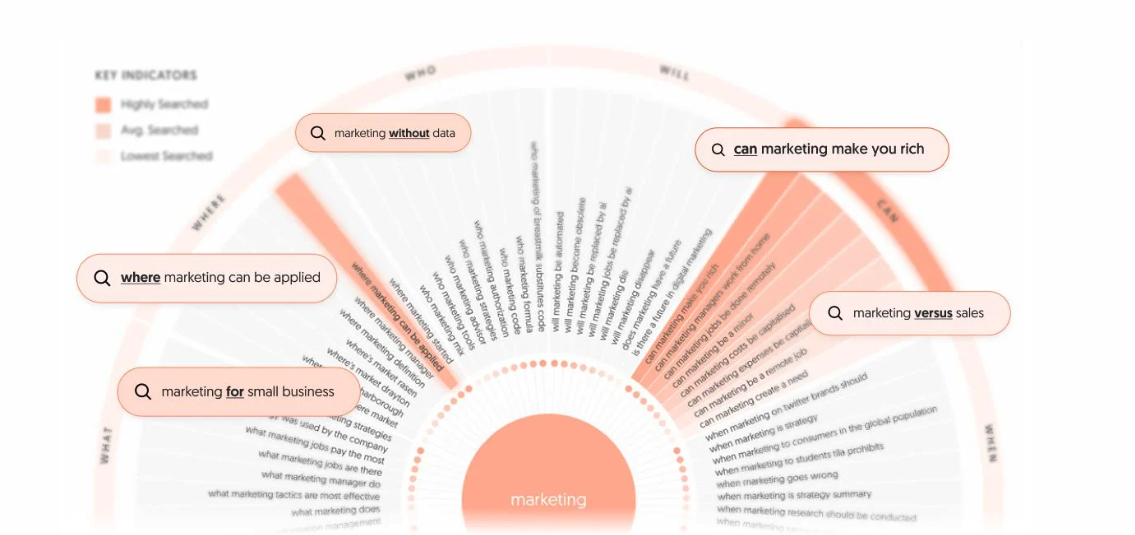
AnswerThePublic is a nifty tool that provides content marketers with valuable data about the questions people ask online.
Once you input a keyword, it fetches popular queries based on that keyword and generates a cool graphic with the questions and phrases people use when they search for that keyword.
This data gives content creators insight into potential customers’ concerns and desires, and enables them to craft highly targeted content that addresses those needs.
AnswerThePublic also provides keyword suggestions using prepositions such as “versus,” “like,” and “with.”
It is an excellent research tool that can help you create better content that people will enjoy and be more likely to share.
26. Keyword Explorer
This keyword research tool will give you up to 1,000 keyword suggestions, a keyword difficulty score, a click-through rate date, and SERP analysis.
You get three free searches per day.
27. Keyword Planner
Google’s Keyword Planner is designed for ad campaigns, but you can use it for keyword research by seeing how keywords perform in ads.
28. Keyword Sheeter
Get keyword volume, cost per click, and competition data with this free keyword tool.
29. Keywords Everywhere
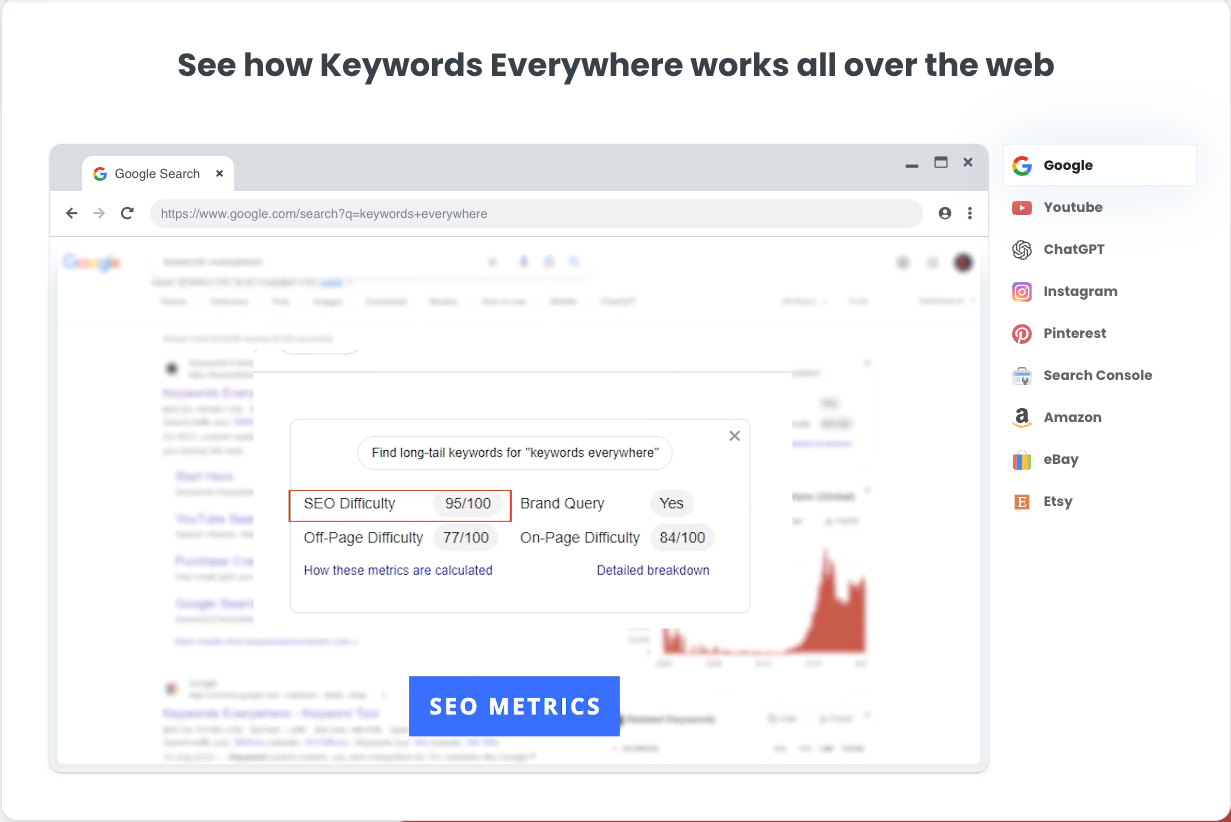 Screenshot from Keywords Everywhere, May 2024
Keywords Everywhere is a must-use keyword research tool due to the massive list of sites that it provides free search volume, CPC, and competition data for:
- Google Search.
- Google Trends.
- eBay.
- AnswerThePublic.
- Google Keyword Planner.
- Bing.
- Etsy.
- Soovle.
- Google Search Console.
- YouTube.
- Ubersuggest.
- Majestic.
- Google Analytics 4.
- Amazon.
- Keyword Sheeter.
- Moz Open Site Explorer.
It’s available for Chrome and Firefox.
30. Ahrefs Keyword Difficulty
This tool lets you discover how difficult it will be to rank in the top 10 search results for any keyword.
Simply enter your term and choose your location, and Ahrefs will give you a score, with 0 being easy and 100 being extremely difficult.
31. Also Asked
Find out what questions people are asking about particular keywords so that you can write content that answers those questions with Also Asked.
Conduct searches by country and in different languages. You can claim three free searches to start.
32. Google Trends
With Google Trends, you can see the interest in a particular term from as recently as an hour to as far back as 2004.
Sort by categories, country, and type of search. See related topics, popularity by region, latest most frequently searched-for terms, and compare to other terms.
33. Glimpse – Google Trends Search Extension
This Chrome extension brings Google Trends right to your browser, offering instant insights into trending topics.
It’s a goldmine for SEO strategists looking to tap into current interests and emerging searches.
34. Keyword Surfer
This Chrome extension shows you the search volume in your Google search results. You can also see the word count and the number of keywords for top-ranking pages.
35. CanIRank
 Screenshot by author, March 2024
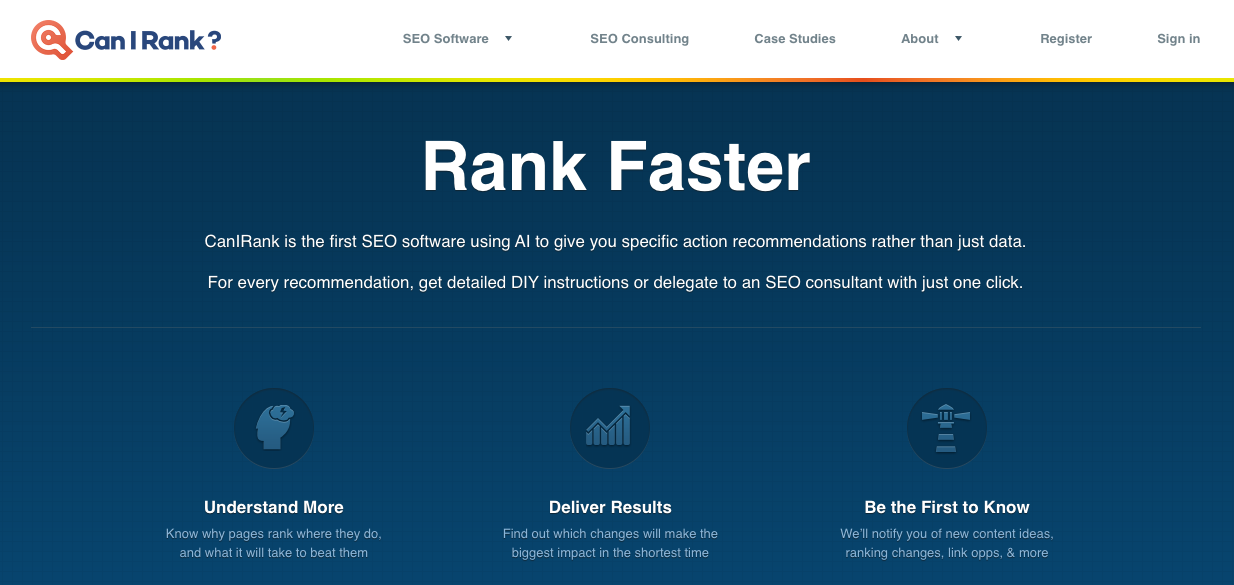
As the name implies, CanIRank helps you determine if you can rank on the first page of search engines for a particular keyword.
Unlike other tools that merely provide data about how competitive keywords are, CanIRank lets you know the probability that you’ll rank for a search term and uses AI to give you suggestions on how to better target keywords.
CanIRank provides great competitive analysis data and actionable steps to get your site ranking higher with better SEO.
36. Seed Keywords
Come up with a question or topic you want to research, send it to your contacts, and have them select the keywords they would search for to get the information you want with Seed Keywords.
37. Exploding Topics
Similar to Google Trends, Exploding Topics will help uncover topics that are about to become popularly searched before they become popularly searched!
38. Ubersuggest
 Screenshot by Ubersuggest, May 2024
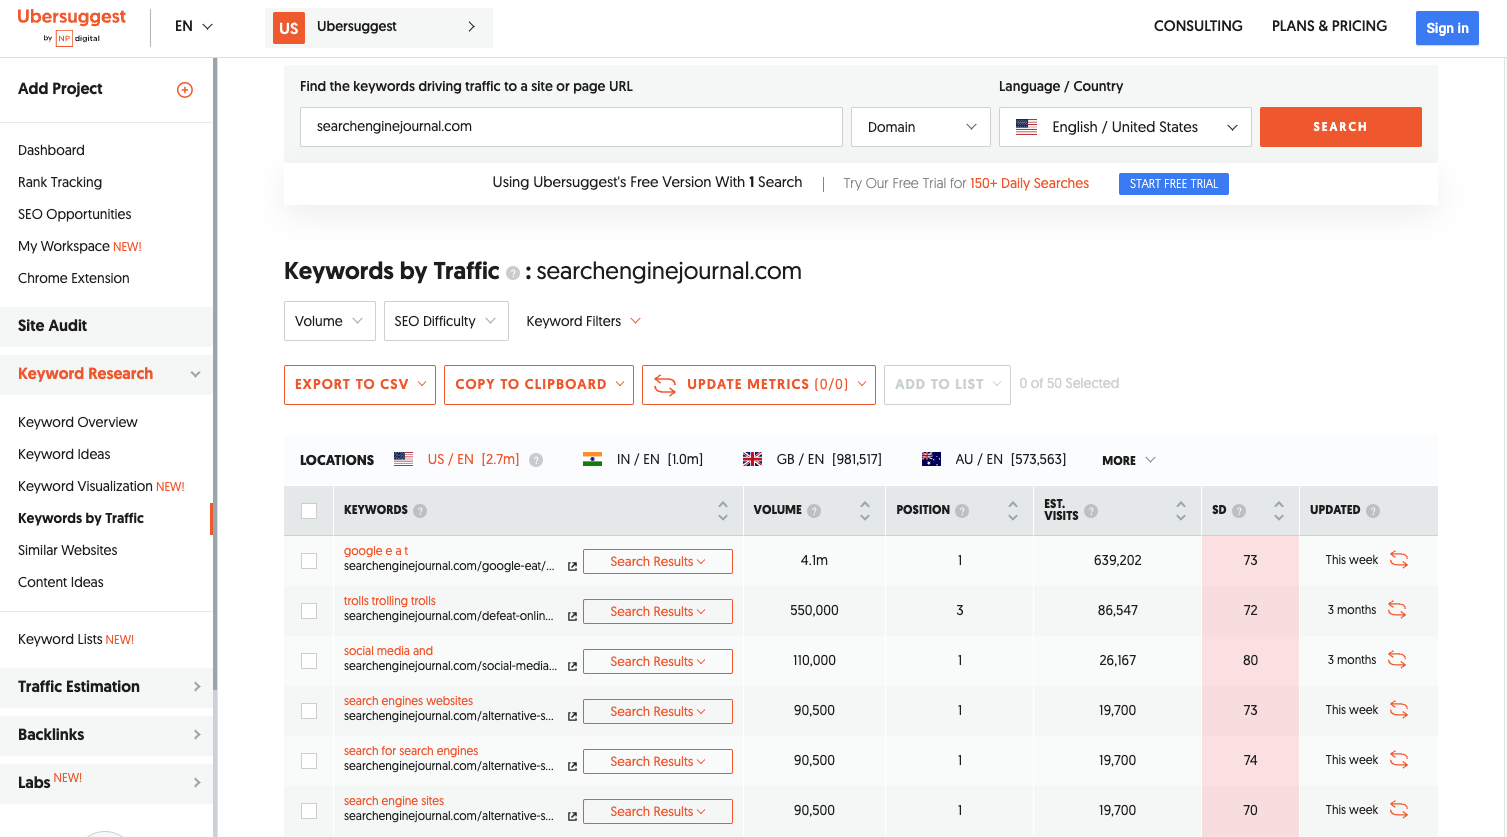
Ubersuggest is a simple keyword research tool that scrapes data from Google’s Keyword Planner for keyword ideas based on a keyword you provide.
The tool also returns handy data for each keyword, including the search volume, CPC, and level of competition.
An excellent feature of Ubersuggest is its ability to filter out keywords you’re not interested in from search results.
The tool has recently added a feature where you can type in a competitor’s domain to get better keyword ideas.
39. Keys4Up
Get the related keywords, also known as semantically linked keywords, for any search with Keys4Up.
40. Wordtracker Scout
Wordtracker Scout will help discover what keywords people search for when they’re ready to make a purchase.
41. KWFinder
With KWFinder, you can discover long-tail keywords – those more specific, less frequently used keywords that yield higher results because of how specific they are.
42. Keywords People Use
Get into the minds of your audience by discovering the exact phrases and questions they use.
This tool helps you align your content with real user searches, making your site more visible and relevant.
Free Link Tools
43. Disavow Tool
Use Google’s Disavow Tool to free yourself from toxic backlinks.
44. Moz Link Explorer
See the backlink profile and domain authority of any URL with Link Explorer.
45. Link Miner
Discover if a given URL has any broken links and discover the metrics of those links, including both search and social data with the Link Miner extension.
46. Backlink Checker
Use this Backlink Checker to discover all the backlink data about a particular URL.
See the number of referring domains, the number of backlinks, the domain and URL rating, and its Ahrefs Rank, a domain’s position in Ahrefs’s list of most powerful sites.
47. The Anchor Text Suggestion Tool By Outreach Labs
Discover the best anchor text to use for any URL with this Anchor Text Suggestion Tool.
48. SendPulse
SendPulse allows for the configuration of chains of emails, notifications, and SMS messages based on user actions, variables, or events.
49. Scraper
This Chrome extension lets you scrape data from any URL and export the info into a spreadsheet.
50. Help A Reporter (HARO)
Help A Reporter is a resource that connects journalists and experts who act as sources for stories.
51. Streak
Convert your Gmail inbox into customer relationship management (CRM) software with this free extension.
Local SEO
52. Google Business Profile
Connect with customers across Google Search and Google Maps using a free Google Business Profile.
53. Whitespark Google Review Link Generator
Use this tool to find your Google Review listing and generate a shortened link to your page.
54. Local Search Results Checker
Conduct local searches using Google Search or Google Maps with Brightlocal’s Local Search Results Checker.
55. Moz Local Check Business Listing
Confirm that your company’s details appear correctly on various directories with Moz’s Local Business Checker.
56. Whitespark Local Citation Finder
Track your citations, discover new opportunities, and get the citations your competitors have with this Local Citation Finder.
57. Review Handout Generator
Print instructions on how to leave a Google review via desktop or mobile device for your business with Whitespark’s Review Handout Generator.
58. Fakespot Review Checker
This Chrome extension lets you know if the product you’re about to buy comes from a reputable seller and, if not, provides an alternative.
59. Mobile SERP Test
See your local SERPS on various mobile devices with Mobile SERP Test from Mobile Moxie.
Mobile SEO Tools
60. WebPageTest
 Screenshot by author, March 2024
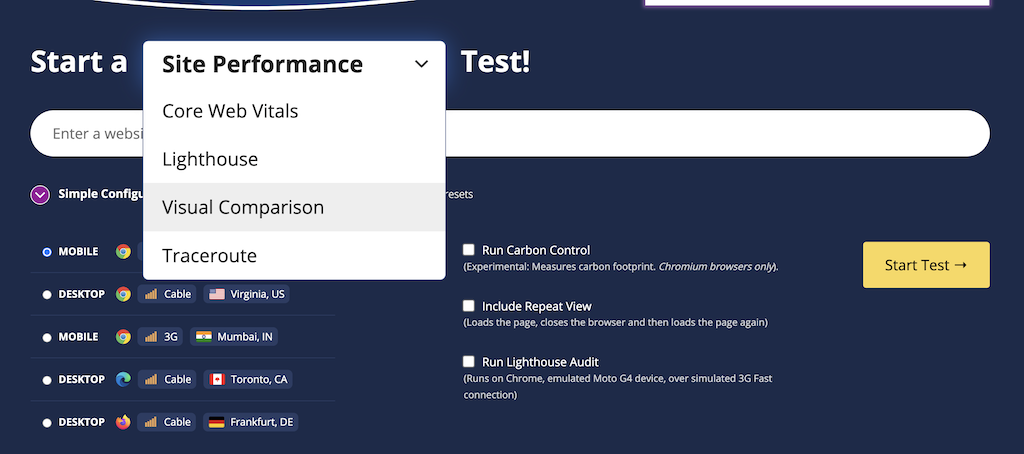
Get visual insights for Core Web Vitals, including the primary image responsible for low LCP scores, scripts responsible for render-blocking, and .gif examples of cumulative layout shifts from the WebPageTest.
61. Merkle Mobile-First Index Checker
See how your website stacks up relative to SEO best practices, depending on whether it’s your desktop or mobile version, with Mobile-First Index Checker.
62. Google Page Speed Insights
Test your website’s mobile-friendliness with Google’s Page Speed Insights tool.
63. GTMetrix
See how quickly your website loads with GTMetrix.
Discover what’s keeping it from loading as fast as possible, and see what steps to take to optimize load speed.
64. Cloudflare
A free content delivery network (CDN) is a network of servers that speeds up content loading by using the server closest to the person doing the loading.
65. Reddico SERP Speed Test
Reddico’s SERP Speed Test tool allows you to compare your page speed at keyword level with the rest of the pages ranking on page 1.
The best part? Most countries are supported – simply choose your local from the drop-down.
Free Multi-Tools
66. Semrush Free Account
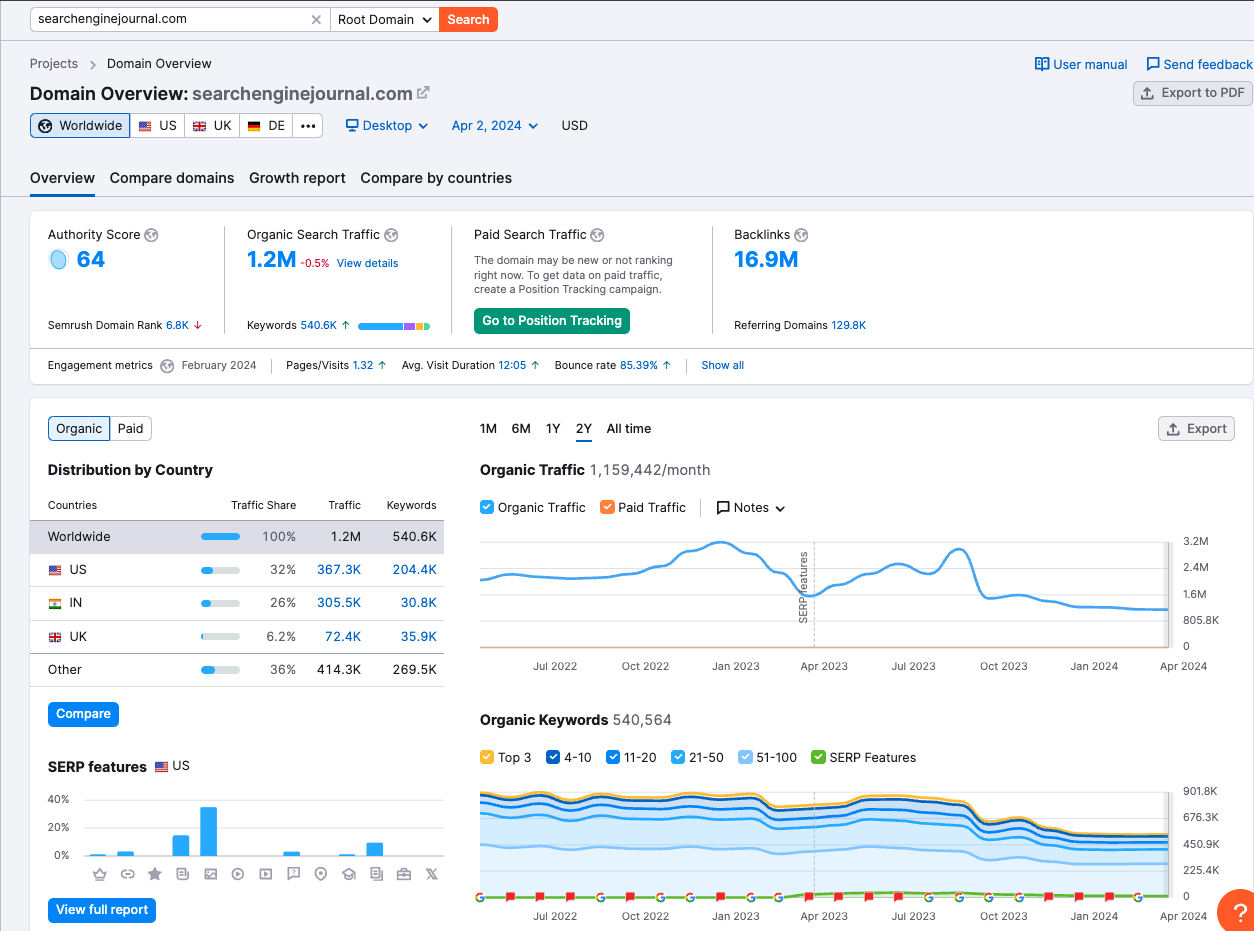 Screenshot from Semrush, March 2024
Semrush is an excellent keyword research SEO tool that, among other things, makes it easy to find out what keywords any page on the web is ranking for.
It provides detailed information about those keywords, including their position in SERPs, the URLs to which they drive traffic, and the traffic trends over the past 12 months.
With this feature-packed tool, you can easily find out what keywords your competitors are ranking for and craft great content around those terms and phrases.
Semrush also offers more features and unlimited access with various paid plans.
While they’re not cheap, you can get started with a 14-day free trial to test the premium features. Or follow the company’s guide on how to use features with a free account.
67. Chrome DevTools
Edit pages in real-time using tools that are built into Google Chrome DevTools.
Diagnose problems as you encounter them.
68. Marketing Miner
Get SERP data, ranking, tool reports, and competitive analysis all in the form of convenient reports with Marketing Miner.
69. MozBar
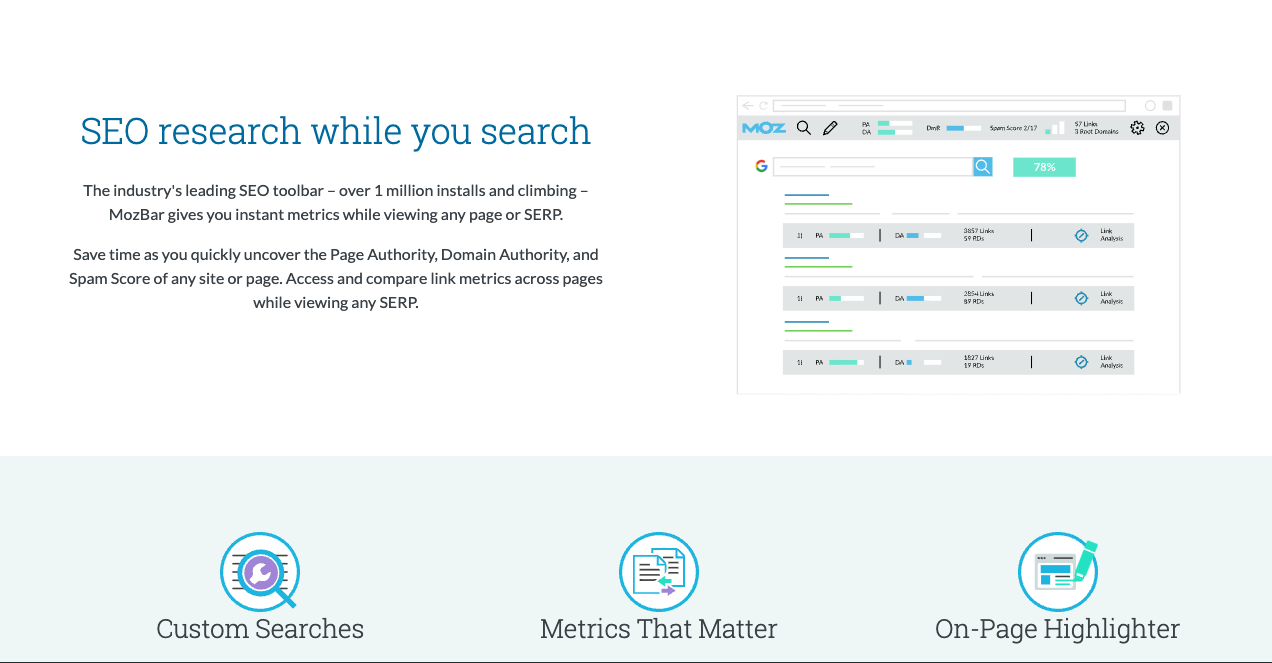 Screenshot from Mozbar, March 2024
MozBar is a free SEO toolbar that works with the Chrome browser. It provides easy access to advanced metrics on webpages and SERPs.
With MozBar and a free Moz account, you can easily access the Page and Domain Authority scores of any page or site.
The Page Analysis feature lets you explore elements on any page (e.g., markup, page title, general attributes, link metrics).
You can find keywords on the page you’re viewing, highlight and differentiate links, and compare the link metrics of different sites in SERPs.
If you need to do detailed SEO research on the go, MozBar is one of the best options.
You can unlock even more advanced features, such as Page Optimization and Keyword Difficulty, with a MozPro subscription.
70. SEO Minion
Conduct on-page SEO analysis, check for broken links, get a SERP preview, and more with this Chrome extension.
71. SEOquake
See SEO metrics and conduct an SEO audit with this Chrome extension.
72. Sheets For Marketers
Learn how to automate tasks in Google Sheets and discover the best automation templates and tools via this curated list.
73. Sheet Consolidator
Create workbooks using CSV exports with a table of contents and enabled hyperlinks using this simple Excel Sheet Consolidator tool.
74. Google Search Console
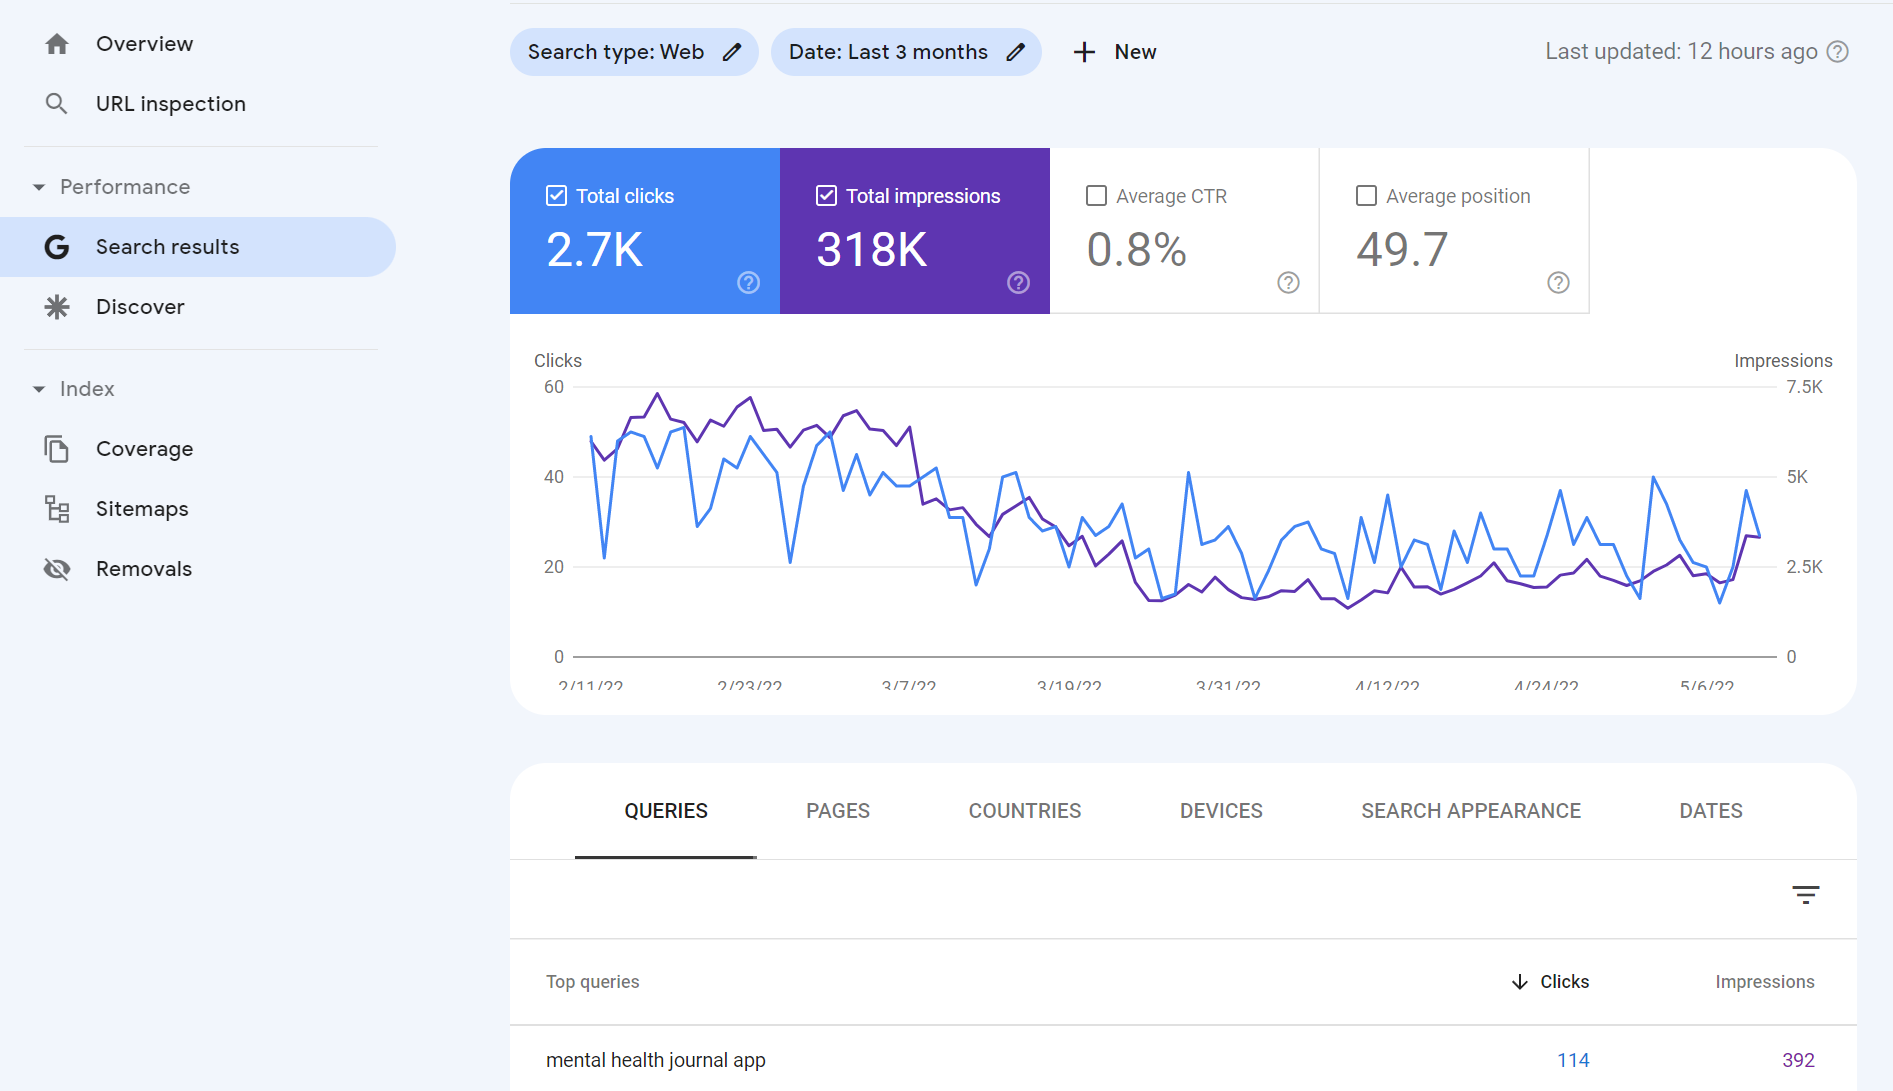 Screenshot by author, May 2022
This list wouldn’t be complete without a mention of Google Search Console.
Aside from the fact that the data comes from Google, Google Search Console is rich with insights related to:
- Keyword and URL performance.
- Indexation issues.
- Mobile usability.
- Sitemap status.
- And much more!
75. Small SEO Tools
A suite of tools to make it easier to create content, including a plagiarism checker, article rewriter, grammar check, word counter, spell checker, paraphrasing tool, and more.
76. Internet Marketing Ninjas
From social tools and schema generator tools to webmaster tools and web design tools, check out the free suite of tools from Internet Marketing Ninjas.
77. Ahref’s SEO Toolbar
Get SEO metrics and SERP details from Ahrefs free Chrome or Firefox extension.
78. Bing Webmaster Tools
Featuring keyword reports, keyword research, crawling dates, and more.
Unlike Google Analytics, Bing Webmaster Tools only focuses on organic search. It’s a must-have for anyone who wants to be ranked on Bing.
79. Woorank
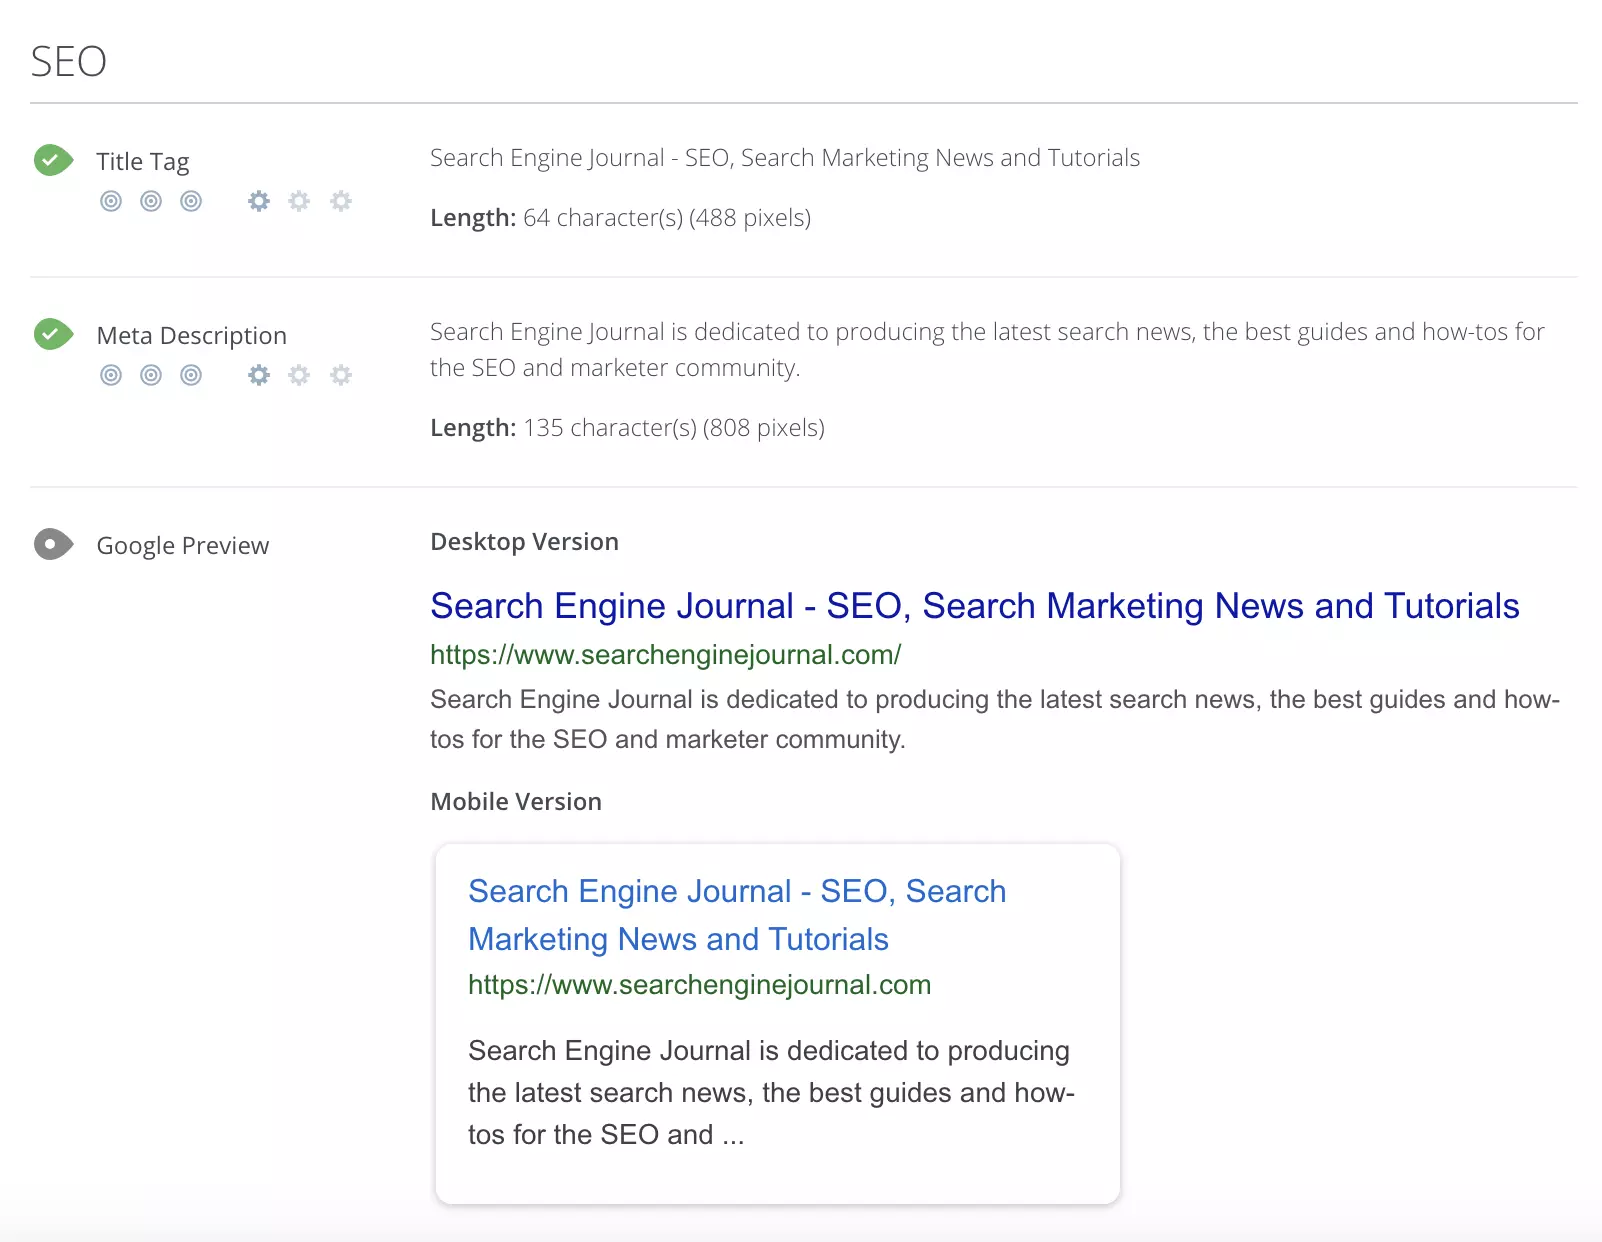 Screenshot by author, May 2022
Woorank is a handy website analyzer that provides useful insights that can help you improve your site’s SEO.
It generates an SEO score for your site and an actionable “Marketing Checklist,” which outlines steps you can take to fix any problems with your site’s SEO.
Another cool feature of this free tool is the social shareability pane. This section provides social network data such as the number of likes, shares, comments, backlinks, and bookmarks across popular social networks.
Woorank also has a great mobile section where you can find information on how your pages render on mobile devices and how quickly they load.
80. SEObility
Find a suite of SEO tools that includes a site auditor, a SERP tracker, a backlink tracker, and more with SEObility.
81. Dareboost
This tool will provide you with an audit of your technical SEO, content, and website’s popularity.
You can also find out which keywords you should add to your pages.
82. Siteliner
Discover duplicate content, broken links, and page authority, and get both an XML sitemap and a detailed report of key site information with Siteliner.
83. InLinks
InLinks is about enhancing your content’s SEO by understanding and optimizing for the context of your topics, not just keywords.
It’s like having an SEO coach who helps you make your content more relevant and engaging through internal linking recommendations, AI content generation, content brief automation, and more.
On-Page SEO
84. Named Entities Indexing Checker
Part of InLinks, this indexing checker tool checks how well search engines understand the named entities (people, places, things) in your content.
Ensuring your content’s context is spot-on for better SEO performance is crucial.
85. JSON Crack
While more technical, this online JSON tool can help SEO professionals work with JSON, a common data format, making it easier to analyze and utilize structured data for SEO purposes.
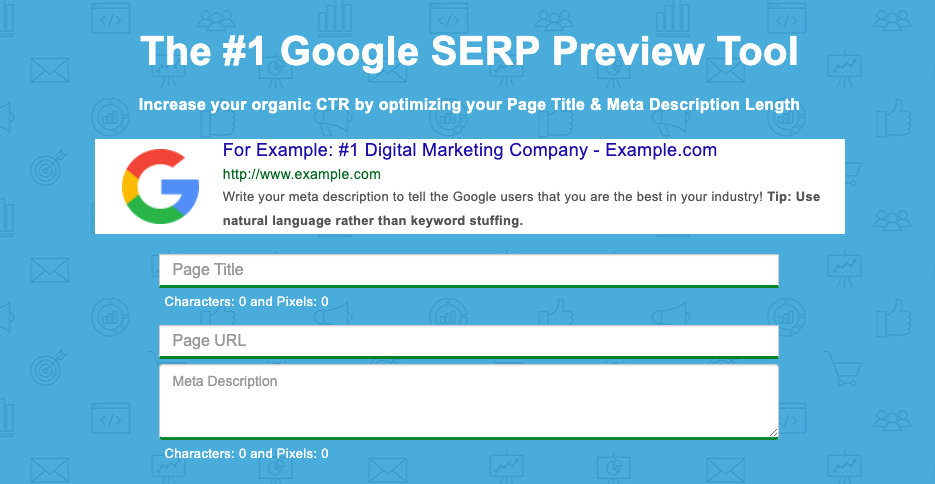
86. Counting Characters Google SERP Tool
 Screenshot by author, May 2024
While counting characters has been a long-standing approach to evaluating meta description and title tag length, the reality is Google doesn’t count the meta title and description in the number of characters. It uses pixels instead.
The Counting Characters tool will provide both the character count and the pixel count to ensure you are creating meta tags that are not cut off by an ellipsis – represented by (…).
87. Natural Language API Demo
Use machine learning to determine the sentiment of text with the Natural Language API Demo.
New customers get $300 in free credits to spend on Natural Language. Use this data to improve your product or site design.
88. Rich Results Test
The Rich Results Test will discover if your website can support rich results, which is when your Google result includes non-textual elements like images.
89. Structured Markup Validator
Google’s structured data tool no longer exists. The Schema Markup Validator is the recommended alternative.
90. Ryte Structured Data Helper
The Ryte Structured Data Helper will provide you with a handy overview, showing you how to quickly and clearly validate your page’s Schema markup.
91. Google Tag Manager
Google Tag Manager allows you to manage your website tags without editing any code!
92. View Rendered Source
See how your browser renders a page with this Chrome extension, including modifications made by JavaScript.
Differences between raw and rendered versions are shown line-by-line.
93. Higher Visibility Google SERP Snippet Optimization Tool
Find out what your SERP snippet will look like with Higher Visibility’s Google SERP Snippet Optimization Tool.
94. Merkle’s Schema Markup Generator
Merkle’s Schema Markup Generator tool will help create JSON-LD markups for articles, breadcrumbs, events, FAQ pages, and how-to guides.
95. Animalz Revive
Find out which of your pages needs an update or an upgrade with Animalz Revive.
You can see the traffic for your pages, including the percentage of traffic your page lost since its peak.
96. Copyscape Free Comparison Tool
Copyscape’s Comparison Tool will help you check the percentage of shared text between two different pages to weed out plagiarism.
97. Internal Linking Tool
An internal linking tool to help you weave a web of internal links on your website, boosting your SEO by making your site more navigable and interconnected. Think of it as laying down a network of roads within your website, guiding visitors and search engines alike.
SEO Research Tools
98. Hunter
Hunter will help find all the important email addresses associated with a given domain.
99. SimilarWeb
Conduct competitor analysis with SimilarWeb that shows you a given domain’s traffic, top pages, engagement, marketing channels, and more.
100. Wappalyzer
Wappalyzer will help you determine if a given website is using a CMS, CRM, ecommerce platform, advertising networks, marketing tools, or analytics.
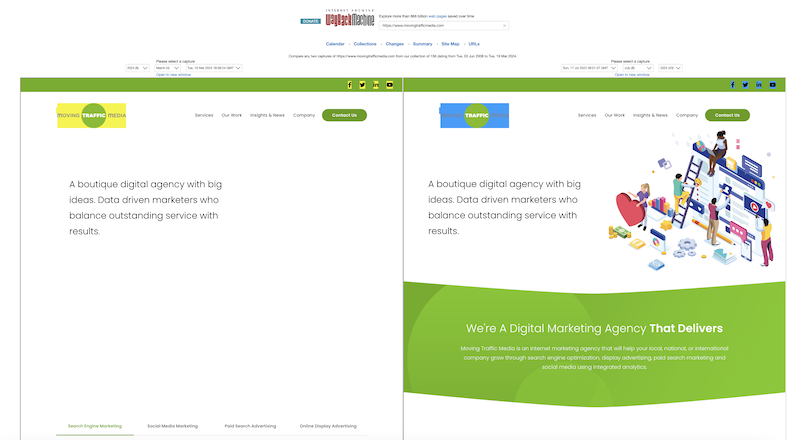
101. Wayback Machine
See a website throughout time, including pages that are no longer on the web with the Wayback Machine.
Bonus* check out the Compare tool to visualize how a page has changed based on specific timestamps.
 Screenshot by author, March 2024
102. SEO Explorer
SEO Explorer is a free tool for keyword and link research.
103. RedditInsights.ai
This is a cool tool for peering into the vast world of Reddit to uncover trends and topics.
Understanding what’s buzzing on Reddit can guide content creation, helping you tap into what your audience is interested in to inform your keyword and content strategy.
104. Thruuu Page Comparison Tool
Dive into side-by-side SEO comparisons of different web pages with the Thruuu Page Comparison Tool.
You can use this to help you understand how to optimize your own content.
Free Rank Checking Tools
105. Ahref’s SERP Checker
See the domains that place in the top 10 for any given keyword in 243 countries, and get robust analytics from Ahref’s SERP Checker.
106. SERPROBOT
Find a dedicated SERP tracking tool with the appropriately named SERPROBOT.
Set up automatic alerts, choose the frequency with which your SERP is checked, and get visual representations of changes.
107. Bulk Google Rank Checker
See your website’s SERPs for various keywords en mass with the Bulk Google Rank Checker.
Free Site Speed Tools
108. Lighthouse
This is Google’s open-source site speed utility. Lighthouse provides audits of performance, accessibility, web apps, SEO, and more.
109. WebpageTest
WebpageTest conducts site speed tests from different locations using different browsers.
110. Web Vitals
This GitHub extension measures Core Web Vitals, providing instant feedback on loading, interactivity, and layout shift metrics.
Here is an additional list of plugins to improve site speed.
WordPress SEO Tools
WordPress is a robust SEO-friendly CMS platform with numerous plugin options available to improve SEO.
While this post isn’t a WordPress-specific list of plugins, it is worth mentioning a handful of key plugins worth considering.
111. RankMath
A newer SEO suite for WordPress, RankMath has 15 modules and provides SEO guidance using 30 different types of improvements.
112. Yoast SEO
Yoast SEO is the most installed SEO suite for WordPress, with regular updates and new tools.
113. Ahrefs WordPress SEO Plugin
The Ahrefs WordPress SEO plugin will provide you with content audits, backlink checking, and tools to monitor and grow your organic traffic.
Here are additional lists of Google Analytics plugins and plugins to improve site speed.
Free AI SEO Tools
Last but not least, we cannot ignore AI.
For better or worse, artificial intelligence has completely shaken up the digital world. While it should never replace your current SEO activities, it can certainly enhance them.
Here are some free AI SEO tools; we’ll also explain how to use them.
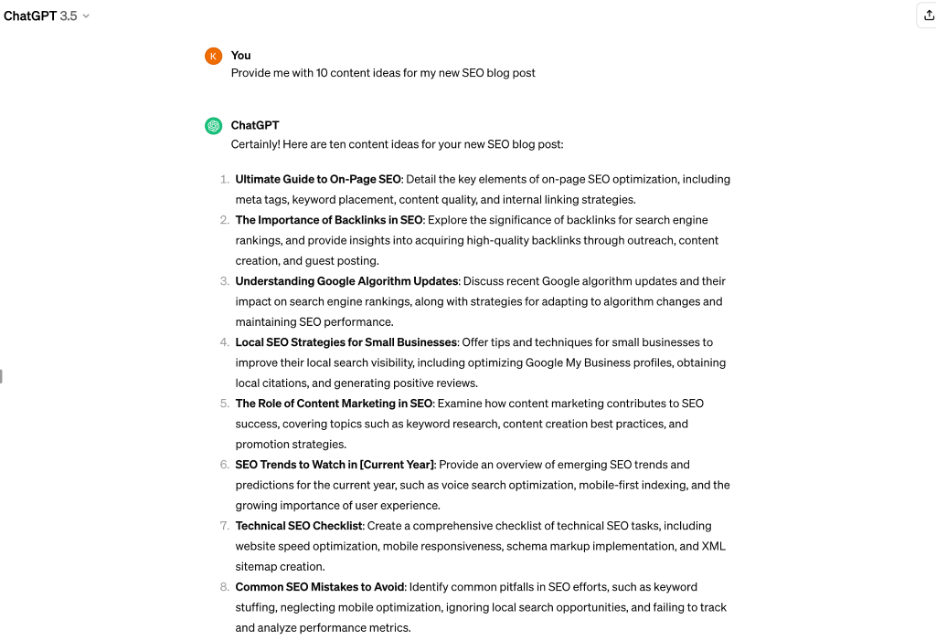
114. OpenAI Chat (ChatGPT)
 Screenshot by author, March 2024
Perhaps the most famous AI tool out there, ChatGPT can be a great help in your SEO efforts.
You can ask for advice, generate content ideas, and even get help with keyword research. It’s like having an SEO buddy you can brainstorm with anytime.
While the Premium ChatGPT, i.e., ChatGPT 4, is paid, ChatGPT 3.5 is free of charge.
115. AIRPM for ChatGPT
Think of AIPRM as your personal assistant to supercharge ChatGPT’s capabilities.
It helps you craft prompts that get straight to the point, whether you’re looking for keyword suggestions, content ideas, or SEO strategies, making your interactions with ChatGPT even more fruitful.
116. SEO.AI
This innovative tool leverages AI to analyze your content’s alignment with SEO best practices and offers suggestions for improvement.
It can provide insights into keyword optimization, readability, and other on-page SEO factors, helping you refine your content to better match search engine algorithms and user expectations.
You can get 10 content audits free!
Time to Take Your SEO Efforts To New Heights
In today’s digital landscape, standing out is not just about having a great website; it’s about making sure it’s seen.
With well over 100 free SEO tools at your disposal, the power to elevate your online presence is literally at your fingertips.
We’ll leave you with some parting tips to help you while using these free SEO tools:
- Start with a goal – Have a clear objective before diving into the sea of tools. Are you looking to increase traffic, enhance user engagement, or improve your search engine rankings? Knowing your goal will help you select the right tools and focus your efforts effectively.
- Experiment and explore – Don’t hesitate to try different tools to see which ones resonate with your workflow and provide the most valuable insights. What works for one site might not work for another, so exploration is key.
- Integrate SEO into your routine – Make SEO a regular part of your content creation and website maintenance routine. It’s not a one-off task but a continuous effort that pays dividends over time.
- Stay updated – The world of SEO is dynamic, with search engines constantly updating their algorithms. Keep abreast of the latest trends and adjust your strategies accordingly to maintain and enhance your site’s visibility.
- Use data wisely – Leverage the data and insights from these tools to make informed decisions. But remember, data is most powerful when combined with creativity and a deep understanding of your audience.
- Patience is key – SEO results don’t happen overnight. Be patient, keep refining your strategies, and the results will come.
So, whether you’re a seasoned SEO strategist or just starting, the wealth of free tools available means there’s no excuse not to optimize your site.
Dive in, explore, and watch as your website climbs the ranks, attracting more visitors and turning clicks into customers.
More Resources:
Featured Image: EtiAmmos/Shutterstock
SEO
What Is Social Listening And How To Get Started

Most marketers now understand the value of social media as a marketing tool – and countless companies have now established their own presence across a variety of social platforms.
But while the importance of creating content and building an audience is well understood, many organizations are lacking when it comes to another key strength of social media: social listening.
Social listening is a strategic approach that can help your brand tap into the incredible breadth and depth of social media to hone in on what your target audience is saying and feeling – and why.
By investing in social listening, you can gain a deeper understanding of conversations happening around not just your brand but your broader industry, and extract meaningful insights to inform multiple areas of your business.
In this article, we’ll explore what social listening is, why it’s crucial for businesses today, and the tools that exist to help you do it before diving into tips for getting started with your social listening strategy.
Let’s get started.
What Is Social Listening?
Social listening is the practice of tracking conversations on social media that are related to your brand, analyzing them, and extracting insights to help inform your future marketing efforts.
These conversations can include anything from direct mentions of your brand or product to discussions around your industry, competitors, relevant keywords, or other topics that might be tangential to your business.
The idea of social listening is that you’re really getting to know your audience by sitting back and listening in to what they talk about – what their gripes are, what they’re interested in, what’s getting them excited right now, and much more.
Gathering this data and then examining it can help you in a number of ways, from uncovering useful product development insights to inspiring new content ideas or better ways to serve your customers.
Here are some of the things you can achieve through social listening:
- Tracking mentions of your brand, products, or services across social platforms.
- Evaluating public perception and sentiment towards your brand by assessing whether mentions are positive, negative, or neutral.
- Spotting trends that are emerging among your target market by noting common themes, topics, or keywords in conversations.
- Gaining a better understanding of your audience, including who they are, where they spend time online, what they want, and how your brand can connect with them.
As such, social listening isn’t just a powerful tool for marketing, but can also be leveraged to improve customer engagement and service, product development, and other areas of your business.
What’s The Difference Between Social Listening And Social Monitoring?
If you’re finding yourself a little confused about the difference between social listening and social monitoring, you’re not alone! The terms are often used interchangeably – when, in reality, they have different scopes and objectives.
Generally speaking, social monitoring is narrower and more focused on your brand specifically, while social listening takes more of a big-picture approach to gaining insights.
If social monitoring is about seeking out brand mentions and conversations to hear what people are saying, social listening is diving even deeper to understand why they’re saying those things.
Social monitoring typically involves tracking social activity directly related to your brand so that you can stay abreast of what’s happening at the moment and tackle any pressing issues.
In this regard, it’s often leveraged as a component of a company’s customer support program to help respond to queries, answer questions, and remedy complaints in a timely manner.
It can also help to identify trending topics or industry moments that might apply to your brand. Basically, social monitoring is all about being aware of what’s happening around your brand on social media so you can respond quickly.
Social listening does all of this, but also takes things a few steps further, expanding the scope of what you’re tracking and focusing on obtaining insights to help with brand strategy, content planning, and decision-making.
Where social monitoring might focus on mentions of your brand, social listening goes beyond that to explore broader consumer behavior and emerging industry trends, and make qualitative analyses of the conversations that are happening in those areas.
One analogy I’ve encountered that I find helpful for understanding the difference between the two: If social monitoring is akin to tending your own backyard, social listening is like taking a walk through your neighborhood and eavesdropping on conversations to better understand what your neighbors are interested in and concerned about.
While we are focused on social listening in this particular article, both social monitoring and social listening are important parts of an effective marketing strategy.
Why Is Social Listening Important?
As we’ve touched on, successful social listening can benefit many areas of your business – from your marketing to your product and your customer support. And all of this means it can have a big impact on your bottom line.
Let’s look closer at just some of the reasons why social listening is an important tool in your business’s arsenal.
Reputation Management
Social listening can help you get a sense of how your audience – and the general public – feels about your brand, products, messaging, or services.
By understanding both the positive and negative sentiments around your brand and where they come from, you can work to fill the gaps and improve perceptions of your company.
Understanding Your Audience
On that note, social listening is a great way to learn more about your audience – from your current customers to your prospects and beyond.
It offers a looking glass into what your target consumer is thinking about, their opinions, pain points, desires, etc. With this information, you have the power to customize your content, message, and products to serve their needs better.
Market Analysis
Social listening is a powerful tool for unearthing insights into your industry – trends, consumer behaviors, opportunities, etc. This is the kind of information that you can use to get ahead of your competitors and deliver the ultimate customer experience.
Competitive Insights
Speaking of competitors, social listening enables you to keep a watchful eye on your competitors and learn from their successes and failures.
You can use active listening to determine how your target market perceives your competitors and apply your findings to differentiate yourself from the pack.
Crisis Management
Let’s face it: Crises happen, no matter what your business or industry. But social listening can help you identify crises before they hit a boiling point, and address them in a timely manner.
Content Strategy
Want to know what content types and formats resonate best with your audience? Try social listening! Once you have the necessary insights, you’ll be able to create more engaging content.
Lead Generation
Social listening can drive lead generation in a number of ways.
You can use it as a tool to discover prospects who are interested in your industry, product niche, or topics related to your business.
Beyond this, by improving your content strategy, reputation, products, customer experience, and more using your social listening insights, you will ultimately boost more leads to your business.
Social Listening Tools
Given that social listening requires pulling data from millions of posts across social media and analyzing it, we would recommend using a tool to help with your efforts.
Here are a few popular social listening tools.
Hootsuite
Known for its social management features, Hootsuite also offers a comprehensive suite of capabilities to help with your social listening efforts.
The platform allows you to create custom streams to track hashtags, keywords, or mentions across a range of social platforms. You can use these to spot conversations in real-time and engage with them.
Using some of Hootsuite’s tools and integrations, you can also do things like track brand sentiment, listen into Reddit conversations, access consumer research, and more.
Pricing:
- 30-day free trial.
- Paid plans start at $99/month for the Professional tier and 249/month for the Team tier (billed annually).
- Hootsuite offers an Enterprise tier with custom pricing.
Sprout Social
Sprout Social is another leader in the social media management space that is super useful for social listening.
With Sprout Social’s Smart Inbox, you can pull all your mentions, comments, and DMs from across your social platforms into one single feed – helping you keep on top of what’s happening.
Other key features include audience analysis, campaign analysis, crisis management, competitor comparison, influencer recognition, sentiment research, and much more.
Pricing:
- 30-day free trial.
- Paid plans start at $249/month for the Standard tier, $399/month for the Professional tier, and $499/month for the Advanced tier (billed annually).
- Sprout Social offers an Enterprise tier with custom pricing.
Brandwatch
Brandwatch is a strong social listening and analytics platform that can help you track and analyze conversations online. It pulls data from 100 million sources, ensuring you’re not missing anything.
The Brandwatch tool will sift through brand mentions in real-time to analyze sentiment and perception, saving you a ton of time and manual effort.
Other key features include AI alerts for unusual mentions activity, conversation translation across multiple languages, tons of historical data, and more.
Pricing:
- Book a meeting with the Brandwatch team to learn more about pricing.
Meltwater
Meltwater’s social listening tool monitors data from a ton of different feeds, from Facebook to Instagram, Twitch, Reddit, YouTube, and many more. It can even recognize when your brand is talked about in a podcast!
Key features include topic and conversation trends analysis, custom dashboard and report building, consumer segmentation and behavior analysis, crisis management, and more.
Pricing:
- Contact the Meltwater team for pricing details.
Talkwalker
Another top name in the social listening space, Talkwalker monitors 150 million websites and 10+ social networks to power your real-time listening experience.
It offers AI-powered sentiment analysis in over 127 languages, notifications for any atypical activity, issue detection, conversation clustering, and much more.
Pricing:
- Contact the Talkwalker team for pricing.
6 Tips For Building A Social Listening Strategy
Now that you understand what social listening is and why it’s important – as well as a few of the tools you can use to power your social listening program – it’s time to start considering your strategy.
Here are six steps we recommend when building out your social listening strategy.
1. Define Your Goals & Objectives
As with any big project, your first step before starting should be to set clear goals for what you want to achieve.
Why are you doing this, and what is the desired result? Sit down with your team and talk through these points in order to align with your objectives.
You might have one key objective or several. Some potential options could be:
- Improve your company’s customer service and support.
- Gain insights to help inform product development and enhance product offerings.
- Track brand sentiment across current and potential customers.
- Develop a deeper understanding of the competitive landscape in your industry, and how your competitors are performing with social audiences.
- Stay on top of industry events and trends so you can spot content gaps and opportunities ahead of time.
Whatever your goals are, make sure you have them set from the beginning so you have clarity as you move forward.
2. Pick Your Tool Of Choice
While social listening can technically be done manually, it will never be as comprehensive as what you can get from leveraging a tool or platform.
Social media listening tools, like the ones we highlighted above, are able to synthesize data from millions of sources at once – not to mention their abilities to analyze sentiment, identify trends, spot activity, and more.
So, while they typically come with a price tag, the good ones are worth their weight in gold.
Do your research and choose a tool that aligns with your objectives and your team’s budget.
Look for something that monitors many different touchpoints, offers comprehensive analytics, is customizable, and integrates with your existing tech stack (if necessary).
3. Identify Target Keywords And Topics
This step is crucial: Take the time to define the keywords, topics, and hashtags that you want to “listen in” to – as these will provide the basis for your listening efforts.
Be sure to include keywords and themes that are relevant to your brand but also your industry, so that you get information that’s most useful to you. You could also discuss any keywords or topics you might want to exclude and why.
These might evolve or change over time, and that’s okay – this is about setting up a well-considered and focused foundation based on what matters most right now, and what will help you achieve your goals.
4. Decide On Your Workflow
Who will be responsible for monitoring your social listening data? Who should be responding to relevant mentions? Whose job is it to analyze the data and report on learnings and progress?
These are all things you should consider early on so that you can develop a clear workflow that outlines responsibilities.
By establishing the process early on, you’ll make sure that your efforts are not in vain and that you’re able to really put your data to use.
One recommendation: Make sure that somebody is regularly monitoring conversations and engaging where necessary. You should be keeping a keen eye on your listening activity – and automated alerts can be very helpful here.
5. Adapt As Needed
As part of the workflow we just discussed, somebody (or several people) should be responsible for routinely analyzing the data you’re collecting – as, unfortunately, it won’t analyze itself.
Set up a consistent process for diving into your data, extracting insights, and then acting on them.
There’s no point in allocating resources to a social listening program if you’re not using the learnings to benefit your business.
So, be sure to adapt your content strategy, marketing efforts, customer service, and so on based on what the insights are telling you.
6. Don’t Forget Measurement
We all know the importance of social media measurement – and this extends to your social listening efforts.
As time goes on, continue to measure the success of your efforts against the goals and objectives you set out for yourself.
This will help you evaluate the impact of your social listening, and whether there are areas you should pivot or refine based on the data you’re seeing.
You can also track social engagement metrics over time to see if your learnings have provided a boost in your social performance as a whole.
In Conclusion
With millions of conversations happening all around us on social media, any brand that isn’t engaging in social listening is missing a major opportunity.
By taking the time to proactively (and attentively) listen to your audience and target consumers, understand them better, and put their feedback to use, you can drive considerable success for your business.
So, take some of the advice we’ve shared here and start building out your social listening strategy today!
More resources:
Featured Image: batjaket/Shutterstock
FAQ
What is the significance of social listening for modern businesses?
Social listening plays a pivotal role for modern businesses by offering critical insights into audience behavior, industry trends, and brand perception. By analyzing conversations on social media related to their brand or market, companies can adequately respond to customer feedback, adapt their marketing strategies, and anticipate consumer needs. It not only aids in shaping product development and content strategy but also enhances customer service, reputation management, and competitive analysis. This strategic approach empowers businesses to make informed decisions based on the direct sentiments and unfiltered conversations of their target audience.
Can you differentiate between social monitoring and social listening?
Social monitoring and social listening are distinct yet complementary components of a comprehensive social media strategy. Social monitoring is more tactical, focusing on tracking and responding to direct brand mentions, queries, and specific conversations related to immediate issues. Its objective is to maintain awareness of what’s currently being said about a brand and to participate in these conversations promptly. Social listening, on the other hand, employs a broader, more strategic approach. It goes beyond mere tracking, analyzing the underlying sentiments, causes, and implications of social discourse to extract actionable insights. This process not only involves engagement but also a deep analysis of consumer behavior patterns and industry trends for a long-term strategy formulation.
Which social listening tools are recommended for businesses to utilize?
For businesses looking to execute an effective social listening strategy, a variety of tools are available that can help streamline the process. These include:
- Hootsuite: Offers custom streams to monitor social conversations and sentiment, alongside integrations for broader consumer research.
- Sprout Social: Features a Smart Inbox to consolidate social interactions for monitoring. It also provides tools for audience and competitor analysis.
- Brandwatch: Analyzes brand mentions from an extensive range of sources, offering AI-powered sentiment analysis and trend spotting.
- Meltwater: Monitors various feeds, from mainstream social media to Reddit and podcasts, enabling comprehensive analysis.
- Talkwalker: Provides monitoring and analytical capabilities over a broad spectrum of online platforms, backed by AI sentiment analysis.
Businesses should select a tool that aligns with their specific needs and objectives, focusing on features like comprehensive analytics, broad monitoring capabilities, and the ability to integrate with existing technological infrastructure.
-
SEARCHENGINES7 days ago
Daily Search Forum Recap: April 29, 2024
-
SEARCHENGINES6 days ago
Daily Search Forum Recap: April 30, 2024
-

 MARKETING5 days ago
How To Develop a Great Creative Brief and Get On-Target Content
-

 SEO7 days ago
Google’s John Mueller On Website Recovery After Core Updates
-

 SEO5 days ago
Why Big Companies Make Bad Content
-

 WORDPRESS6 days ago
13 Best Fun WordPress Plugins You’re Missing Out On
-

 SEO5 days ago
How To Drive Pipeline With A Silo-Free Strategy
-

 SEO6 days ago
OpenAI To Show Content & Links In Response To Queries


