MARKETING
New Report Looks at Social Platform Performance Benchmarks by Industry
When analyzing your social media performance metrics, you need a level of context to make sense of the numbers and ascertain where you can improve and what’s already working. Comparing the data against your own past stats is the best way to do this, and ensure that you’re aligning with your broader business goals, but it can also be helpful to benchmark your performance against others in your industry, providing further insight into where you’re at, and what you should expect.
That’s where this report comes in. This week, RivalIQ has released the latest version of its annual Social Media Industry Benchmark Report, for which they’ve gathered data on the social platform performance of more than 2,000 brands, incorporating some 5 million posts, tweets and updates.
The full report includes a heap of industry-specific insights, including popular hashtags and specific posting data, but in this post, we’re going to take a look at the overall trends for Facebook, Instagram ad Twitter to get an idea of where “good performance” on each currently stands.
First off on Facebook – according to RivalIQ’s data, the average Facebook Page engagement rate remained flat from its 2019 report at 0.09%

That’s not exactly inspiring – brand engagement rates on Facebook have remained fairly low, overall, for some time, though RivalIQ does note that the “Higher Education”, “Influencers”, and “Sports Teams” categories did see relative increases over the last year.
Of course, most Facebook Page managers would be aware of this, and there are other benefits to Facebook activity beyond organic engagement. But it’s worth noting the comparative benchmarks when analyzing your own Facebook Page performance.
In terms of posing frequency, RivalIQ found that the average Facebook posts per day across all sectors decreased by about 14% in 2019.

It’s difficult to say what would have lead to that decrease – brands seeing less response? Not wanting to flood News Feeds? It’s worth noting that, in the past, Facebook has advised that brands should:
“Post frequently – Don’t worry about over-posting. The goal of News Feed is to show each person the most relevant story so not all of your posts are guaranteed to show in their Feeds.”
So if over-posting is a concern, that’s likely outweighed by the algorithm anyway. But maybe brands are simply making other platforms a bigger focus, and that’s lead to a slightly lower average posting frequency on The Social Network.
Which leads us onto Instagram. The trending platform of the moment, Instagram, and Instagram Stories in particular, seems to be where brands are increasingly turning.
So, what’s the average engagement rate for brands on Insta?

Overall, the engagement rate for brands on Instagram has dropped – as per RivalIQ:
“Every industry in our study took a hit on Instagram this year, and the all-industry median decreased by 23% from 1.60% to 1.22%.”
That’s likely due to that increased focus – with more brands now competing for attention on the platform, everyone takes a bit of a hit. Still, 1.22% is a lot higher than Facebook, pointing to the ongoing opportunity of Instagram for engagement.
In terms of posting frequency, RivalIQ notes that the median posting frequency across all industries declined by 5% in 2019.

Not a huge reduction, but brands are not ramping up their Instagram activity in response to increased usage. This also doesn’t incorporate Stories data, where, as noted, more businesses are now looking.
On Twitter, the data suggests that average tweet engagement has also dipped just slightly, down from 0.48% in its last report.

As per RivalIQ:
“Twitter engagement remained consistent for the third year in a row, with Higher Ed and Alcohol staying ahead and Media pulling up the rear because of their high-frequency posting.”
It’s interesting to note the relative variance by sector, and to get some idea of what average tweet performance actually looks like. Maybe your business is doing better than you thought – and maybe, Twitter is a relatively good performer for you, based on the data.
Of course, as with all platforms, there are additional benefits to maintaining a consistent Twitter presence, but having some perspective on this element can be helpful in understanding your results.
In terms of tweets per day, tweeting frequency declined by about 10% this year.

This isn’t a major surprise – with Twitter’s algorithm now highlighting tweets of interest to each individual user, that’s lessened the impetus to tweet so often, to a degree, while in some ways it also acts as a disincentive to such, as your tweets from the previous day can get clustered together in the listing, and potentially overwhelm followers.
Twitter’s also not driving as much referral traffic as it once was, which is also somewhat reflected in the engagement stats. That’s seen some brands re-asses the amount of time they’re spending on the platform. Overall, tweet engagement is up year over year, according to the platform’s official stats, but the re-focus on conversations has seemingly impacted brand tweet engagement, at least to some degree,
There’s a heap more insight in RivalIQ’s full report, including industry-specific data and insights to help improve your strategy.
You can check out the full 2020 Social Benchmarks report here.
MARKETING
18 Events and Conferences for Black Entrepreneurs in 2024

Welcome to Breaking the Blueprint — a blog series that dives into the unique business challenges and opportunities of underrepresented business owners and entrepreneurs. Learn how they’ve grown or scaled their businesses, explored entrepreneurial ventures within their companies, or created side hustles, and how their stories can inspire and inform your own success.
It can feel isolating if you’re the only one in the room who looks like you.
MARKETING
IAB Podcast Upfront highlights rebounding audiences and increased innovation
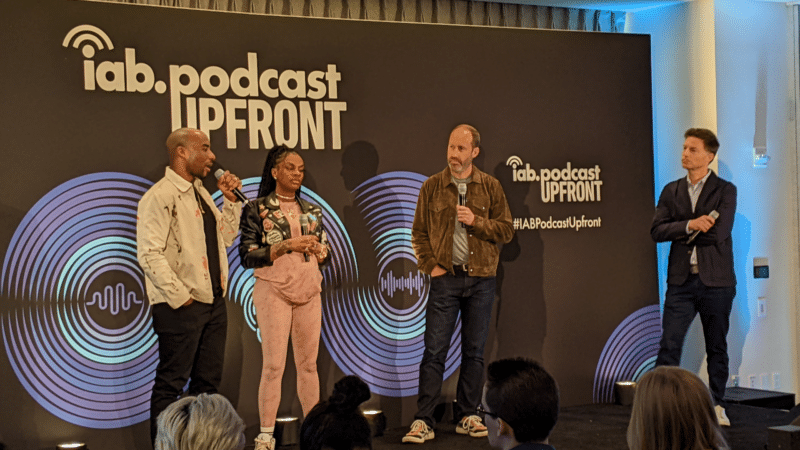
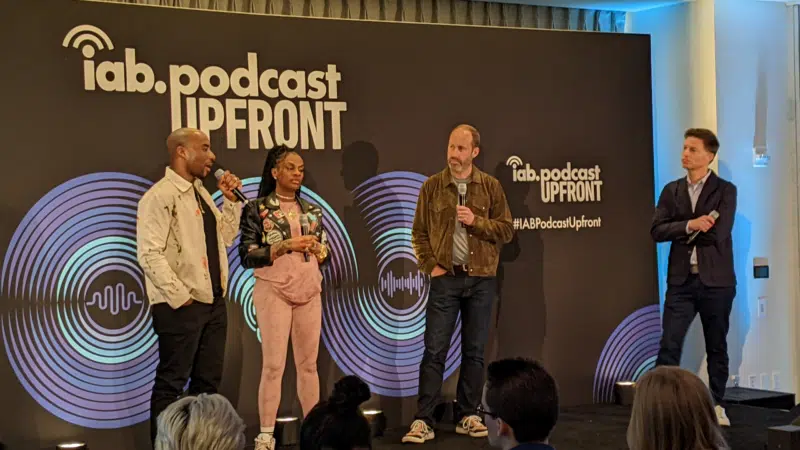
Podcasts are bouncing back from last year’s slowdown with digital audio publishers, tech partners and brands innovating to build deep relationships with listeners.
At the IAB Podcast Upfront in New York this week, hit shows and successful brand placements were lauded. In addition to the excitement generated by stars like Jon Stewart and Charlamagne tha God, the numbers gauging the industry also showed promise.
U.S. podcast revenue is expected to grow 12% to reach $2 billion — up from 5% growth last year — according to a new IAB/PwC study. Podcasts are projected to reach $2.6 billion by 2026.
The growth is fueled by engaging content and the ability to measure its impact. Adtech is stepping in to measure, prove return on spend and manage brand safety in gripping, sometimes contentious, environments.
“As audio continues to evolve and gain traction, you can expect to hear new innovations around data, measurement, attribution and, crucially, about the ability to assess podcasting’s contribution to KPIs in comparison to other channels in the media mix,” said IAB CEO David Cohen, in his opening remarks.
Comedy and sports leading the way
Podcasting’s slowed growth in 2023 was indicative of lower ad budgets overall as advertisers braced for economic headwinds, according to Matt Shapo, director, Media Center for IAB, in his keynote. The drought is largely over. Data from media analytics firm Guideline found podcast gross media spend up 21.7% in Q1 2024 over Q1 2023. Monthly U.S. podcast listeners now number 135 million, averaging 8.3 podcast episodes per week, according to Edison Research.
Comedy overtook sports and news to become the top podcast category, according to the new IAB report, “U.S. Podcast Advertising Revenue Study: 2023 Revenue & 2024-2026 Growth Projects.” Comedy podcasts gained nearly 300 new advertisers in Q4 2023.
Sports defended second place among popular genres in the report. Announcements from the stage largely followed these preferences.
Jon Stewart, who recently returned to “The Daily Show” to host Mondays, announced a new podcast, “The Weekly Show with Jon Stewart,” via video message at the Upfront. The podcast will start next month and is part of Paramount Audio’s roster, which has a strong sports lineup thanks to its association with CBS Sports.
Reaching underserved groups and tastes
IHeartMedia toasted its partnership with radio and TV host Charlamagne tha God. Charlamagne’s The Black Effect is the largest podcast network in the U.S. for and by black creators. Comedian Jess Hilarious spoke about becoming the newest co-host of the long-running “The Breakfast Club” earlier this year, and doing it while pregnant.
The company also announced a new partnership with Hello Sunshine, a media company founded by Oscar-winner Reese Witherspoon. One resulting podcast, “The Bright Side,” is hosted by journalists Danielle Robay and Simone Boyce. The inspiration for the show was to tell positive stories as a counterweight to negativity in the culture.
With such a large population listening to podcasts, advertisers can now benefit from reaching specific groups catered to by fine-tuned creators and topics. As the top U.S. audio network, iHeartMedia touted its reach of 276 million broadcast listeners.
Connecting advertisers with the right audience
Through its acquisition of technology, including audio adtech company Triton Digital in 2021, as well as data partnerships, iHeartMedia claims a targetable audience of 34 million podcast listeners through its podcast network, and a broader audio audience of 226 million for advertisers, using first- and third-party data.
“A more diverse audience is tuning in, creating more opportunities for more genres to reach consumers — from true crime to business to history to science and culture, there is content for everyone,” Cohen said.
The IAB study found that the top individual advertiser categories in 2023 were Arts, Entertainment and Media (14%), Financial Services (13%), CPG (12%) and Retail (11%). The largest segment of advertisers was Other (27%), which means many podcast advertisers have distinct products and services and are looking to connect with similarly personalized content.
Acast, the top global podcast network, founded in Stockholm a decade ago, boasts 125,000 shows and 400 million monthly listeners. The company acquired podcast database Podchaser in 2022 to gain insights on 4.5 million podcasts (at the time) with over 1.7 billion data points.
Measurement and brand safety
Technology is catching up to the sheer volume of content in the digital audio space. Measurement company Adelaide developed its standard unit of attention, the AU, to predict how effective ad placements will be in an “apples to apples” way across channels. This method is used by The Coca-Cola Company, NBA and AB InBev, among other big advertisers.
In a study with National Public Media, which includes NPR radio and popular podcasts like the “Tiny Desk” concert series, Adelaide found that NPR, on average, scored 10% higher than Adelaide’s Podcast AU Benchmarks, correlating to full-funnel outcomes. NPR listeners weren’t just clicking through to advertisers’ sites, they were considering making a purchase.
Advertisers can also get deep insights on ad effectiveness through Wondery’s premium podcasts — the company was acquired by Amazon in 2020. Ads on its podcasts can now be managed through the Amazon DSP, and measurement of purchases resulting from ads will soon be available.
The podcast landscape is growing rapidly, and advertisers are understandably concerned about involving their brands with potentially controversial content. AI company Seekr develops large language models (LLMs) to analyze online content, including the context around what’s being said on a podcast. It offers a civility rating that determines if a podcast mentioning “shootings,” for instance, is speaking responsibly and civilly about the topic. In doing so, Seekr adds a layer of confidence for advertisers who would otherwise pass over an opportunity to reach an engaged audience on a topic that means a lot to them. Seekr recently partnered with ad agency Oxford Road to bring more confidence to clients.
“When we move beyond the top 100 podcasts, it becomes infinitely more challenging for these long tails of podcasts to be discovered and monetized,” said Pat LaCroix, EVP, strategic partnerships at Seekr. “Media has a trust problem. We’re living in a time of content fragmentation, political polarization and misinformation. This is all leading to a complex and challenging environment for brands to navigate, especially in a channel where brand safety tools have been in the infancy stage.”
Dig deeper: 10 top marketing podcasts for 2024
MARKETING
Foundations of Agency Success: Simplifying Operations for Growth

Why do we read books like Traction, Scaling Up, and the E-Myth and still struggle with implementing systems, defining processes, and training people in our agency?
Those are incredibly comprehensive methodologies. And yet digital agencies still suffer from feast or famine months, inconsistent results and timelines on projects, quality control, revisions, and much more. It’s not because they aren’t excellent at what they do. I
t’s not because there isn’t value in their service. It’s often because they haven’t defined the three most important elements of delivery: the how, the when, and the why.
Complicating our operations early on can lead to a ton of failure in implementing them. Business owners overcomplicate their own processes, hesitate to write things down, and then there’s a ton of operational drag in the company.
Couple that with split attention and paper-thin resources and you have yourself an agency that spends most of its time putting out fires, reacting to problems with clients, and generally building a culture of “the Founder/Creative Director/Leader will fix it” mentality.
Before we chat through how truly simple this can all be, let’s first go back to the beginning.
When we start our companies, we’re told to hustle. And hustle hard. We’re coached that it takes a ton of effort to create momentum, close deals, hire people, and manage projects. And that is all true. There is a ton of work that goes into getting a business up and running.


The challenge is that we all adopt this habit of burning the candle at both ends and the middle all for the sake of growing the business. And we bring that habit into the next stage of growth when our business needs… you guessed it… exactly the opposite.
In Mike Michalowitz’s book, Profit First he opens by insisting the reader understand and accept a fundamental truth: our business is a cash-eating monster. The truth is, our business is also a time-eating monster. And it’s only when we realize that as long as we keep feeding it our time and our resources, it’ll gobble everything up leaving you with nothing in your pocket and a ton of confusion around why you can’t grow.
Truth is, financial problems are easy compared to operational problems. Money is everywhere. You can go get a loan or go create more revenue by providing value easily. What’s harder is taking that money and creating systems that produce profitably. Next level is taking that money, creating profit and time freedom.
In my bestselling book, The Sabbatical Method, I teach owners how to fundamentally peel back the time they spend in their company, doing everything, and how it can save owners a lot of money, time, and headaches by professionalizing their operations.
The tough part about being a digital agency owner is that you likely started your business because you were great at something. Building websites, creating Search Engine Optimization strategies, or running paid media campaigns. And then you ended up running a company. Those are two very different things.


How to Get Out of Your Own Way and Create Some Simple Structure for Your Agency…
- Start Working Less
I know this sounds really brash and counterintuitive, but I’ve seen it work wonders for clients and colleagues alike. I often say you can’t see the label from inside the bottle and I’ve found no truer statement when it comes to things like planning, vision, direction, and operations creation.
Owners who stay in the weeds of their business while trying to build the structure are like hunters in the jungle hacking through the brush with a machete, getting nowhere with really sore arms. Instead, define your work day, create those boundaries of involvement, stop working weekends, nights and jumping over people’s heads to solve problems.
It’ll help you get another vantage point on your company and your team can build some autonomy in the meantime.
- Master the Art of Knowledge Transfer
There are two ways to impart knowledge on others: apprenticeship and writing something down. Apprenticeship began as a lifelong relationship and often knowledge was only retained by ONE person who would carry on your method.
Writing things down used to be limited (before the printing press) to whoever held the pages.
We’re fortunate that today, we have many ways of imparting knowledge to our team. And creating this habit early on can save a business from being dependent on any one person who has a bunch of “how” and “when” up in their noggin.
While you’re taking some time to get out of the day-to-day, start writing things down and recording your screen (use a tool like loom.com) while you’re answering questions.


Deposit those teachings into a company knowledge base, a central location for company resources. Some of the most scaleable and sellable companies I’ve ever worked with had this habit down pat.
- Define Your Processes
Lean in. No fancy tool or software is going to save your company. Every team I’ve ever worked with who came to me with a half-built project management tool suffered immensely from not first defining their process. This isn’t easy to do, but it can be simple.
The thing that hangs up most teams to dry is simply making decisions. If you can decide how you do something, when you do it and why it’s happening that way, you’ve already won. I know exactly what you’re thinking: our process changes all the time, per client, per engagement, etc. That’s fine.
Small businesses should be finding better, more efficient ways to do things all the time. Developing your processes and creating a maintenance effort to keep them accurate and updated is going to be a liferaft in choppy seas. You’ll be able to cling to it when the agency gets busy.
“I’m so busy, how can I possibly work less and make time for this?”


You can’t afford not to do this work. Burning the candle at both ends and the middle will catch up eventually and in some form or another. Whether it’s burnout, clients churning out of the company, a team member leaving, some huge, unexpected tax bill.
I’ve heard all the stories and they all suck. It’s easier than ever to start a business and it’s harder than ever to keep one. This work might not be sexy, but it gives us the freedom we craved when we began our companies.
Start small and simple and watch your company become more predictable and your team more efficient.
-

 PPC6 days ago
How the TikTok Algorithm Works in 2024 (+9 Ways to Go Viral)
-
 SEO5 days ago
How to Use Keywords for SEO: The Complete Beginner’s Guide
-
 SEO7 days ago
Blog Post Checklist: Check All Prior to Hitting “Publish”
-
 MARKETING6 days ago
How To Protect Your People and Brand
-

 SEARCHENGINES7 days ago
Google Started Enforcing The Site Reputation Abuse Policy
-

 PPC7 days ago
How to Craft Compelling Google Ads for eCommerce
-
 MARKETING7 days ago
Elevating Women in SEO for a More Inclusive Industry
-

 PPC7 days ago
How to Brainstorm Business Ideas: 9 Fool-Proof Approaches


