SEO
A Practical Guide To Multi-touch Attribution

The customer journey involves multiple interactions between the customer and the merchant or service provider.
We call each interaction in the customer journey a touch point.
According to Salesforce.com, it takes, on average, six to eight touches to generate a lead in the B2B space.
The number of touchpoints is even higher for a customer purchase.
Multi-touch attribution is the mechanism to evaluate each touch point’s contribution toward conversion and gives the appropriate credits to every touch point involved in the customer journey.
Conducting a multi-touch attribution analysis can help marketers understand the customer journey and identify opportunities to further optimize the conversion paths.
In this article, you will learn the basics of multi-touch attribution, and the steps of conducting multi-touch attribution analysis with easily accessible tools.
What To Consider Before Conducting Multi-Touch Attribution Analysis
Define The Business Objective
What do you want to achieve from the multi-touch attribution analysis?
Do you want to evaluate the return on investment (ROI) of a particular marketing channel, understand your customer’s journey, or identify critical pages on your website for A/B testing?
Different business objectives may require different attribution analysis approaches.
Defining what you want to achieve from the beginning helps you get the results faster.
Define Conversion
Conversion is the desired action you want your customers to take.
For ecommerce sites, it’s usually making a purchase, defined by the order completion event.
For other industries, it may be an account sign-up or a subscription.
Different types of conversion likely have different conversion paths.
If you want to perform multi-touch attribution on multiple desired actions, I would recommend separating them into different analyses to avoid confusion.
Define Touch Point
Touch point could be any interaction between your brand and your customers.
If this is your first time running a multi-touch attribution analysis, I would recommend defining it as a visit to your website from a particular marketing channel. Channel-based attribution is easy to conduct, and it could give you an overview of the customer journey.
If you want to understand how your customers interact with your website, I would recommend defining touchpoints based on pageviews on your website.
If you want to include interactions outside of the website, such as mobile app installation, email open, or social engagement, you can incorporate those events in your touch point definition, as long as you have the data.
Regardless of your touch point definition, the attribution mechanism is the same. The more granular the touch points are defined, the more detailed the attribution analysis is.
In this guide, we’ll focus on channel-based and pageview-based attribution.
You’ll learn about how to use Google Analytics and another open-source tool to conduct those attribution analyses.
An Introduction To Multi-Touch Attribution Models
The ways of crediting touch points for their contributions to conversion are called attribution models.
The simplest attribution model is to give all the credit to either the first touch point, for bringing in the customer initially, or the last touch point, for driving the conversion.
These two models are called the first-touch attribution model and the last-touch attribution model, respectively.
Obviously, neither the first-touch nor the last-touch attribution model is “fair” to the rest of the touch points.
Then, how about allocating credit evenly across all touch points involved in converting a customer? That sounds reasonable – and this is exactly how the linear attribution model works.
However, allocating credit evenly across all touch points assumes the touch points are equally important, which doesn’t seem “fair”, either.
Some argue the touch points near the end of the conversion paths are more important, while others are in favor of the opposite. As a result, we have the position-based attribution model that allows marketers to give different weights to touchpoints based on their locations in the conversion paths.
All the models mentioned above are under the category of heuristic, or rule-based, attribution models.
In addition to heuristic models, we have another model category called data-driven attribution, which is now the default model used in Google Analytics.
What Is Data-Driven Attribution?
How is data-driven attribution different from the heuristic attribution models?
Here are some highlights of the differences:
- In a heuristic model, the rule of attribution is predetermined. Regardless of first-touch, last-touch, linear, or position-based model, the attribution rules are set in advance and then applied to the data. In a data-driven attribution model, the attribution rule is created based on historical data, and therefore, it is unique for each scenario.
- A heuristic model looks at only the paths that lead to a conversion and ignores the non-converting paths. A data-driven model uses data from both converting and non-converting paths.
- A heuristic model attributes conversions to a channel based on how many touches a touch point has with respect to the attribution rules. In a data-driven model, the attribution is made based on the effect of the touches of each touch point.
How To Evaluate The Effect Of A Touch Point
A common algorithm used by data-driven attribution is called Markov Chain. At the heart of the Markov Chain algorithm is a concept called the Removal Effect.
The Removal Effect, as the name suggests, is the impact on conversion rate when a touch point is removed from the pathing data.
This article will not go into the mathematical details of the Markov Chain algorithm.
Below is an example illustrating how the algorithm attributes conversion to each touch point.
The Removal Effect
Assuming we have a scenario where there are 100 conversions from 1,000 visitors coming to a website via 3 channels, Channel A, B, & C. In this case, the conversion rate is 10%.
Intuitively, if a certain channel is removed from the conversion paths, those paths involving that particular channel will be “cut off” and end with fewer conversions overall.
If the conversion rate is lowered to 5%, 2%, and 1% when Channels A, B, & C are removed from the data, respectively, we can calculate the Removal Effect as the percentage decrease of the conversion rate when a particular channel is removed using the formula:
Then, the last step is attributing conversions to each channel based on the share of the Removal Effect of each channel. Here is the attribution result:
| Channel | Removal Effect | Share of Removal Effect | Attributed Conversions |
| A | 1 – (5% / 10%) = 0.5 | 0.5 / (0.5 + 0.8 + 0.9) = 0.23 | 100 * 0.23 = 23 |
| B | 1 – (2% / 10%) = 0.8 | 0.8 / (0.5 + 0.8 + 0.9) = 0.36 | 100 * 0.36 = 36 |
| C | 1 – (1% / 10%) = 0.9 | 0.9 / (0.5 + 0.8 + 0.9) = 0.41 | 100 * 0.41 = 41 |
In a nutshell, data-driven attribution does not rely on the number or position of the touch points but on the impact of those touch points on conversion as the basis of attribution.
Multi-Touch Attribution With Google Analytics
Enough of theories, let’s look at how we can use the ubiquitous Google Analytics to conduct multi-touch attribution analysis.
As Google will stop supporting Universal Analytics (UA) from July 2023, this tutorial will be based on Google Analytics 4 (GA4) and we’ll use Google’s Merchandise Store demo account as an example.
In GA4, the attribution reports are under Advertising Snapshot as shown below on the left navigation menu.
After landing on the Advertising Snapshot page, the first step is selecting an appropriate conversion event.
GA4, by default, includes all conversion events for its attribution reports.
To avoid confusion, I highly recommend you pick only one conversion event (“purchase” in the below example) for the analysis.
 Screenshot from GA4, November 2022
Understand The Conversion Paths In GA4
Under the Attribution section on the left navigation bar, you can open the Conversion Paths report.
Scroll down to the conversion path table, which shows all the paths leading to conversion.
At the top of this table, you can find the average number of days and number of touch points that lead to conversions.
 Screenshot from GA4, November 2022
In this example, you can see that Google customers take, on average, almost 9 days and 6 visits before making a purchase on its Merchandise Store.
Find Each Channel’s Contribution In GA4
Next, click the All Channels report under the Performance section on the left navigation bar.
In this report, you can find the attributed conversions for each channel of your selected conversion event – “purchase”, in this case.
 Screenshot from GA4, November 2022
Now, you know Organic Search, together with Direct and Email, drove most of the purchases on Google’s Merchandise Store.
Examine Results From Different Attribution Models In GA4
By default, GA4 uses the data-driven attribution model to determine how many credits each channel receives. However, you can examine how different attribution models assign credits for each channel.
Click Model Comparison under the Attribution section on the left navigation bar.
For example, comparing the data-driven attribution model with the first touch attribution model (aka “first click model” in the below figure), you can see more conversions are attributed to Organic Search under the first click model (735) than the data-driven model (646.80).
On the other hand, Email has more attributed conversions under the data-driven attribution model (727.82) than the first click model (552).
 Screenshot from GA4, November 2022
The data tells us that Organic Search plays an important role in bringing potential customers to the store, but it needs help from other channels to convert visitors (i.e., for customers to make actual purchases).
On the other hand, Email, by nature, interacts with visitors who have visited the site before and helps to convert returning visitors who initially came to the site from other channels.
Which Attribution Model Is The Best?
A common question, when it comes to attribution model comparison, is which attribution model is the best. I’d argue this is the wrong question for marketers to ask.
The truth is that no one model is absolutely better than the others as each model illustrates one aspect of the customer journey. Marketers should embrace multiple models as they see fit.
From Channel-Based To Pageview-Based Attribution
Google Analytics is easy to use, but it works well for channel-based attribution.
If you want to further understand how customers navigate through your website before converting, and what pages influence their decisions, you need to conduct attribution analysis on pageviews.
While Google Analytics doesn’t support pageview-based attribution, there are other tools you can use.
We recently performed such a pageview-based attribution analysis on AdRoll’s website and I’d be happy to share with you the steps we went through and what we learned.
Gather Pageview Sequence Data
The first and most challenging step is gathering data on the sequence of pageviews for each visitor on your website.
Most web analytics systems record this data in some form. If your analytics system doesn’t provide a way to extract the data from the user interface, you may need to pull the data from the system’s database.
Similar to the steps we went through on GA4, the first step is defining the conversion. With pageview-based attribution analysis, you also need to identify the pages that are part of the conversion process.
As an example, for an ecommerce site with online purchase as the conversion event, the shopping cart page, the billing page, and the order confirmation page are part of the conversion process, as every conversion goes through those pages.
You should exclude those pages from the pageview data since you don’t need an attribution analysis to tell you those pages are important for converting your customers.
The purpose of this analysis is to understand what pages your potential customers visited prior to the conversion event and how they influenced the customers’ decisions.
Prepare Your Data For Attribution Analysis
Once the data is ready, the next step is to summarize and manipulate your data into the following four-column format. Here is an example.
 Screenshot from author, November 2022
The Path column shows all the pageview sequences. You can use any unique page identifier, but I’d recommend using the url or page path because it allows you to analyze the result by page types using the url structure. “>” is a separator used in between pages.
The Total_Conversions column shows the total number of conversions a particular pageview path led to.
The Total_Conversion_Value column shows the total monetary value of the conversions from a particular pageview path. This column is optional and is mostly applicable to ecommerce sites.
The Total_Null column shows the total number of times a particular pageview path failed to convert.
Build Your Page-Level Attribution Models
To build the attribution models, we leverage the open-source library called ChannelAttribution.
While this library was originally created for use in R and Python programming languages, the authors now provide a free Web app for it, so we can use this library without writing any code.
Upon signing into the Web app, you can upload your data and start building the models.
For first-time users, I’d recommend clicking the Load Demo Data button for a trial run. Be sure to examine the parameter configuration with the demo data.
 Screenshot from author, November 2022
When you’re ready, click the Run button to create the models.
Once the models are created, you’ll be directed to the Output tab, which displays the attribution results from four different attribution models – first-touch, last-touch, linear, and data-drive (Markov Chain).
Remember to download the result data for further analysis.
For your reference, while this tool is called ChannelAttribution, it’s not limited to channel-specific data.
Since the attribution modeling mechanism is agnostic to the type of data given to it, it’d attribute conversions to channels if channel-specific data is provided, and to web pages if pageview data is provided.
Analyze Your Attribution Data
Organize Pages Into Page Groups
Depending on the number of pages on your website, it may make more sense to first analyze your attribution data by page groups rather than individual pages.
A page group can contain as few as just one page to as many pages as you want, as long as it makes sense to you.
Taking AdRoll’s website as an example, we have a Homepage group that contains just the homepage and a Blog group that contains all of our blog posts.
For ecommerce sites, you may consider grouping your pages by product categories as well.
Starting with page groups instead of individual pages allows marketers to have an overview of the attribution results across different parts of the website. You can always drill down from the page group to individual pages when needed.
Identify The Entries And Exits Of The Conversion Paths
After all the data preparation and model building, let’s get to the fun part – the analysis.
I’d suggest first identifying the pages that your potential customers enter your website and the pages that direct them to convert by examining the patterns of the first-touch and last-touch attribution models.
Pages with particularly high first-touch and last-touch attribution values are the starting points and endpoints, respectively, of the conversion paths. These are what I call gateway pages.
Make sure these pages are optimized for conversion.
Keep in mind that this type of gateway page may not have very high traffic volume.
For example, as a SaaS platform, AdRoll’s pricing page doesn’t have high traffic volume compared to some other pages on the website but it’s the page many visitors visited before converting.
Find Other Pages With Strong Influence On Customers’ Decisions
After the gateway pages, the next step is to find out what other pages have a high influence on your customers’ decisions.
For this analysis, we look for non-gateway pages with high attribution value under the Markov Chain models.
Taking the group of product feature pages on AdRoll.com as an example, the pattern of their attribution value across the four models (shown below) shows they have the highest attribution value under the Markov Chain model, followed by the linear model.
This is an indication that they are visited in the middle of the conversion paths and played an important role in influencing customers’ decisions.
 Image from author, November 2022
These types of pages are also prime candidates for conversion rate optimization (CRO).
Making them easier to be discovered by your website visitors and their content more convincing would help lift your conversion rate.
To Recap
Multi-touch attribution allows a company to understand the contribution of various marketing channels and identify opportunities to further optimize the conversion paths.
Start simply with Google Analytics for channel-based attribution. Then, dig deeper into a customer’s pathway to conversion with pageview-based attribution.
Don’t worry about picking the best attribution model.
Leverage multiple attribution models, as each attribution model shows different aspects of the customer journey.
More resources:
Featured Image: Black Salmon/Shutterstock
SEO
Why Google Can’t Tell You About Every Ranking Drop

In a recent Twitter exchange, Google’s Search Liaison, Danny Sullivan, provided insight into how the search engine handles algorithmic spam actions and ranking drops.
The discussion was sparked by a website owner’s complaint about a significant traffic loss and the inability to request a manual review.
Sullivan clarified that a site could be affected by an algorithmic spam action or simply not ranking well due to other factors.
He emphasized that many sites experiencing ranking drops mistakenly attribute it to an algorithmic spam action when that may not be the case.
“I’ve looked at many sites where people have complained about losing rankings and decide they have a algorithmic spam action against them, but they don’t. “
Sullivan’s full statement will help you understand Google’s transparency challenges.
Additionally, he explains why the desire for manual review to override automated rankings may be misguided.
Two different things. A site could have an algorithmic spam action. A site could be not ranking well because other systems that *are not about spam* just don’t see it as helpful.
I’ve looked at many sites where people have complained about losing rankings and decide they have a…
— Google SearchLiaison (@searchliaison) May 13, 2024
Challenges In Transparency & Manual Intervention
Sullivan acknowledged the idea of providing more transparency in Search Console, potentially notifying site owners of algorithmic actions similar to manual actions.
However, he highlighted two key challenges:
- Revealing algorithmic spam indicators could allow bad actors to game the system.
- Algorithmic actions are not site-specific and cannot be manually lifted.
Sullivan expressed sympathy for the frustration of not knowing the cause of a traffic drop and the inability to communicate with someone about it.
However, he cautioned against the desire for a manual intervention to override the automated systems’ rankings.
Sullivan states:
“…you don’t really want to think “Oh, I just wish I had a manual action, that would be so much easier.” You really don’t want your individual site coming the attention of our spam analysts. First, it’s not like manual actions are somehow instantly processed. Second, it’s just something we know about a site going forward, especially if it says it has change but hasn’t really.”
Determining Content Helpfulness & Reliability
Moving beyond spam, Sullivan discussed various systems that assess the helpfulness, usefulness, and reliability of individual content and sites.
He acknowledged that these systems are imperfect and some high-quality sites may not be recognized as well as they should be.
“Some of them ranking really well. But they’ve moved down a bit in small positions enough that the traffic drop is notable. They assume they have fundamental issues but don’t, really — which is why we added a whole section about this to our debugging traffic drops page.”
Sullivan revealed ongoing discussions about providing more indicators in Search Console to help creators understand their content’s performance.
“Another thing I’ve been discussing, and I’m not alone in this, is could we do more in Search Console to show some of these indicators. This is all challenging similar to all the stuff I said about spam, about how not wanting to let the systems get gamed, and also how there’s then no button we would push that’s like “actually more useful than our automated systems think — rank it better!” But maybe there’s a way we can find to share more, in a way that helps everyone and coupled with better guidance, would help creators.”
Advocacy For Small Publishers & Positive Progress
In response to a suggestion from Brandon Saltalamacchia, founder of RetroDodo, about manually reviewing “good” sites and providing guidance, Sullivan shared his thoughts on potential solutions.
He mentioned exploring ideas such as self-declaration through structured data for small publishers and learning from that information to make positive changes.
“I have some thoughts I’ve been exploring and proposing on what we might do with small publishers and self-declaring with structured data and how we might learn from that and use that in various ways. Which is getting way ahead of myself and the usual no promises but yes, I think and hope for ways to move ahead more positively.”
Sullivan said he can’t make promises or implement changes overnight, but he expressed hope for finding ways to move forward positively.
Featured Image: Tero Vesalainen/Shutterstock
SEO
56 Google Search Statistics to Bookmark for 2024
If you’re curious about the state of Google search in 2024, look no further.
Each year we pick, vet, and categorize a list of up-to-date statistics to give you insights from trusted sources on Google search trends.
- Google has a web index of “about 400 billion documents”. (The Capitol Forum)
- Google’s search index is over 100 million gigabytes in size. (Google)
- There are an estimated 3.5 billion searches on Google each day. (Internet Live Stats)
- 61.5% of desktop searches and 34.4% of mobile searches result in no clicks. (SparkToro)
- 15% of all Google searches have never been searched before. (Google)
- 94.74% of keywords get 10 monthly searches or fewer. (Ahrefs)
- The most searched keyword in the US and globally is “YouTube,” and youtube.com gets the most traffic from Google. (Ahrefs)
- 96.55% of all pages get zero search traffic from Google. (Ahrefs)
- 50-65% of all number-one spots are dominated by featured snippets. (Authority Hacker)
- Reddit is the most popular domain for product review queries. (Detailed)
- Google is the most used search engine in the world, with a mobile market share of 95.32% and a desktop market share of 81.95%. (Statista)

- Google.com generated 84.2 billion visits a month in 2023. (Statista)
- Google generated $307.4 billion in revenue in 2023. (Alphabet Investor Relations)
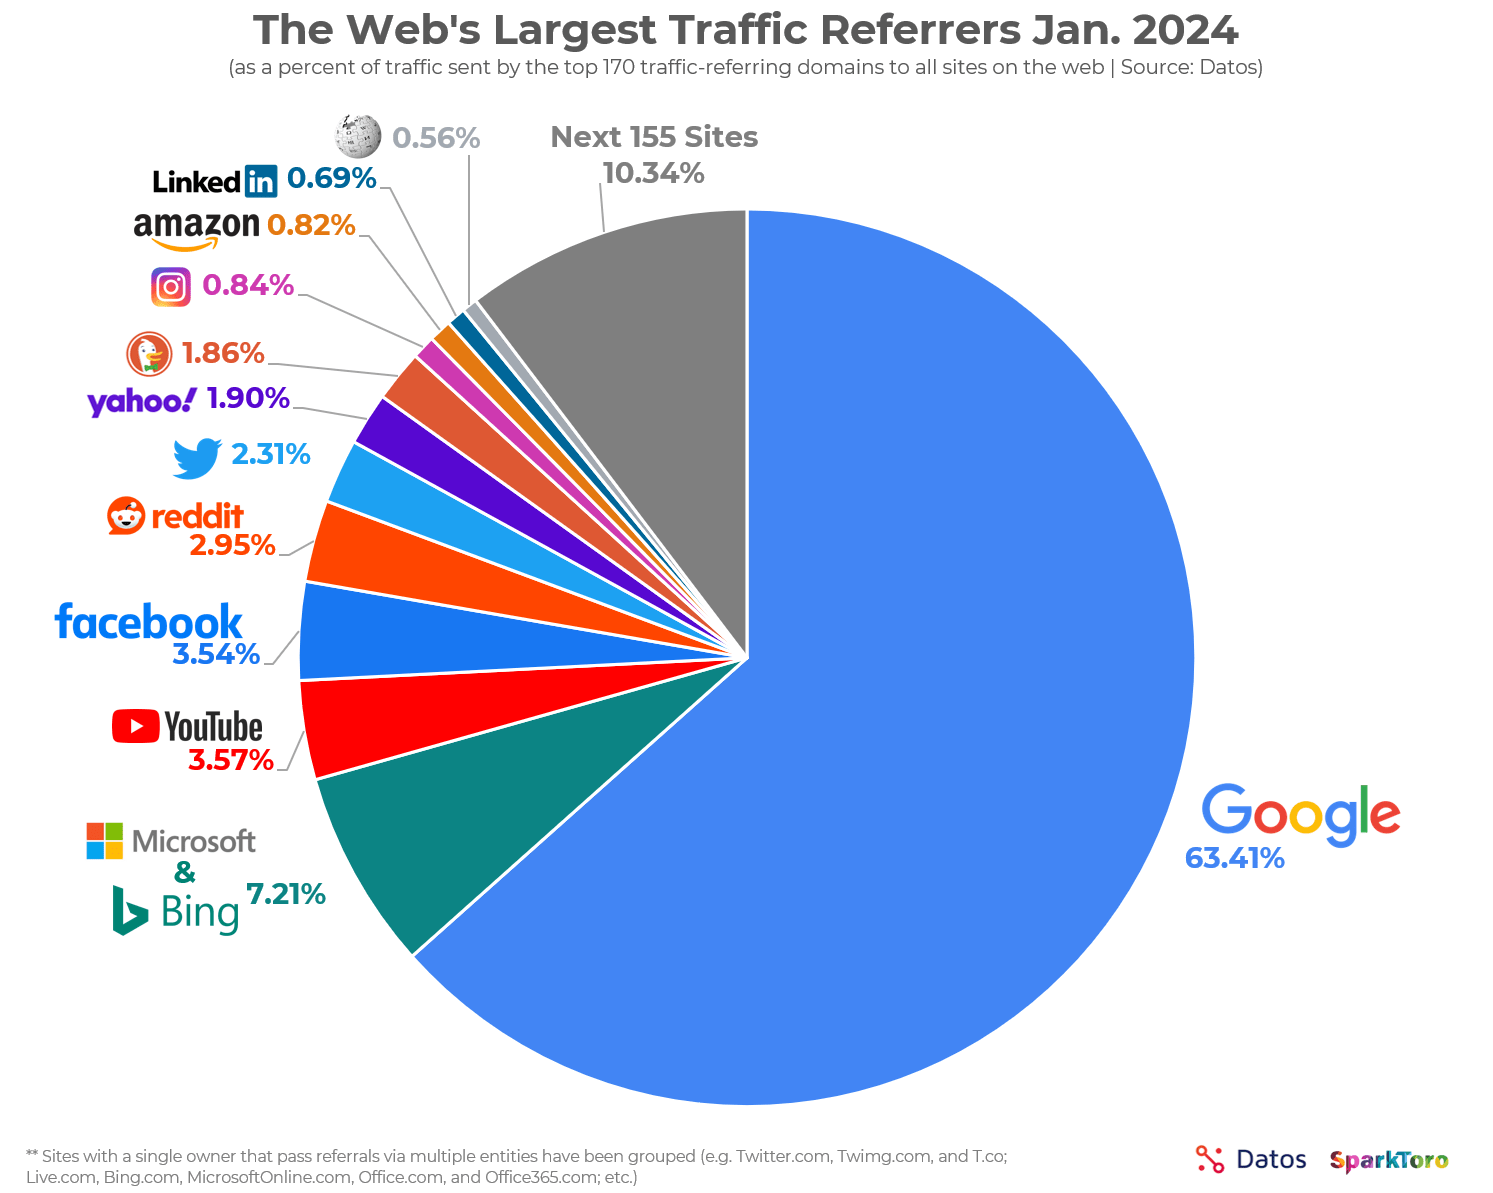
- 63.41% of all US web traffic referrals come from Google. (SparkToro)
- 92.96% of global traffic comes from Google Search, Google Images, and Google Maps. (SparkToro)
- Only 49% of Gen Z women use Google as their search engine. The rest use TikTok. (Search Engine Land)
- 58.67% of all website traffic worldwide comes from mobile phones. (Statista)
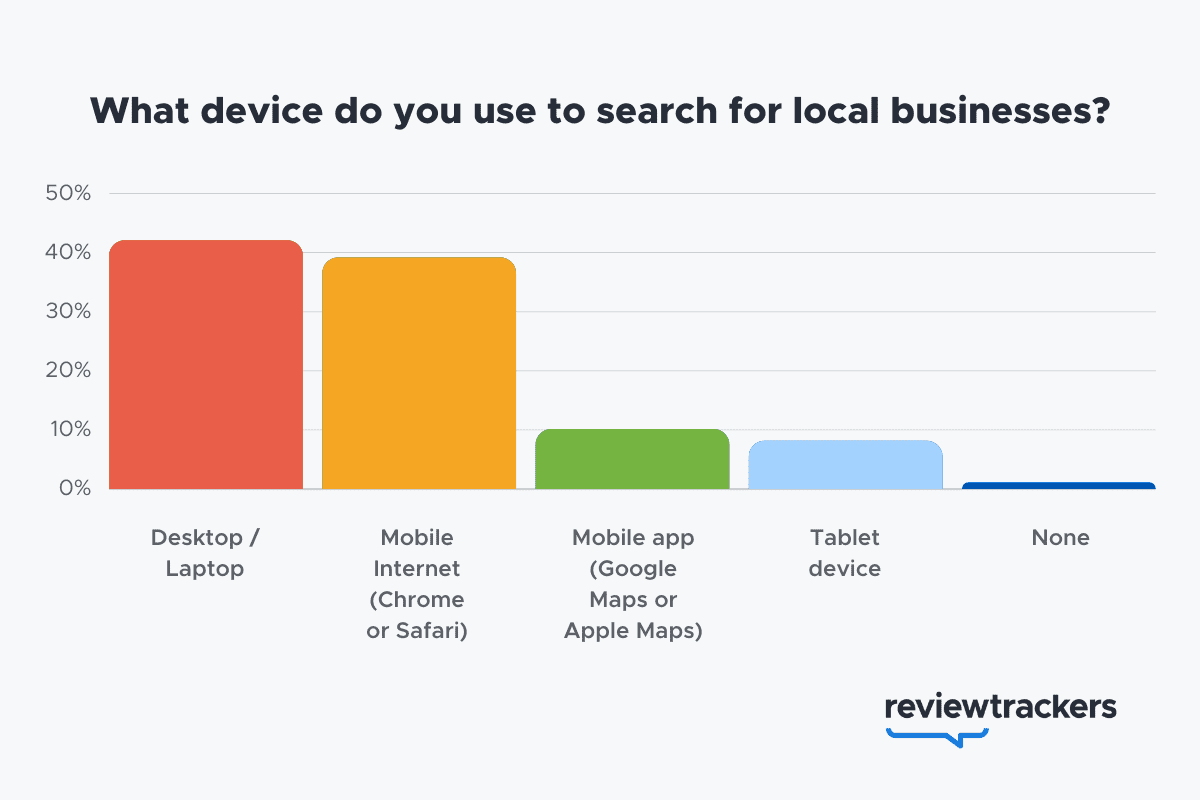
- 57% of local search queries are submitted using a mobile device or tablet. (ReviewTrackers)

- 51% of smartphone users have discovered a new company or product when conducting a search on their smartphones. (Think With Google)
- 54% of smartphone users search for business hours, and 53% search for directions to local stores. (Think With Google)
- 18% of local searches on smartphones lead to a purchase within a day vs. 7% of non-local searches. (Think With Google)
- 56% of in-store shoppers used their smartphones to shop or research items while they were in-store. (Think With Google)
- 60% of smartphone users have contacted a business directly using the search results (e.g., “click to call” option). (Think With Google)
- 63.6% of consumers say they are likely to check reviews on Google before visiting a business location. (ReviewTrackers)
- 88% of consumers would use a business that replies to all of its reviews. (BrightLocal)
- Customers are 2.7 times more likely to consider a business reputable if they find a complete Business Profile on Google Search and Maps. (Google)
- Customers are 70% more likely to visit and 50% more likely to consider purchasing from businesses with a complete Business Profile. (Google)
- 76% of people who search on their smartphones for something nearby visit a business within a day. (Think With Google)
- 28% of searches for something nearby result in a purchase. (Think With Google)
- Mobile searches for “store open near me” (such as, “grocery store open near me” have grown by over 250% in the last two years. (Think With Google)
- People use Google Lens for 12 billion visual searches a month. (Google)
- 50% of online shoppers say images helped them decide what to buy. (Think With Google)
- There are an estimated 136 billion indexed images on Google Image Search. (Photutorial)
- 15.8% of Google SERPs show images. (Moz)
- People click on 3D images almost 50% more than static ones. (Google)
- More than 800 million people use Google Discover monthly to stay updated on their interests. (Google)
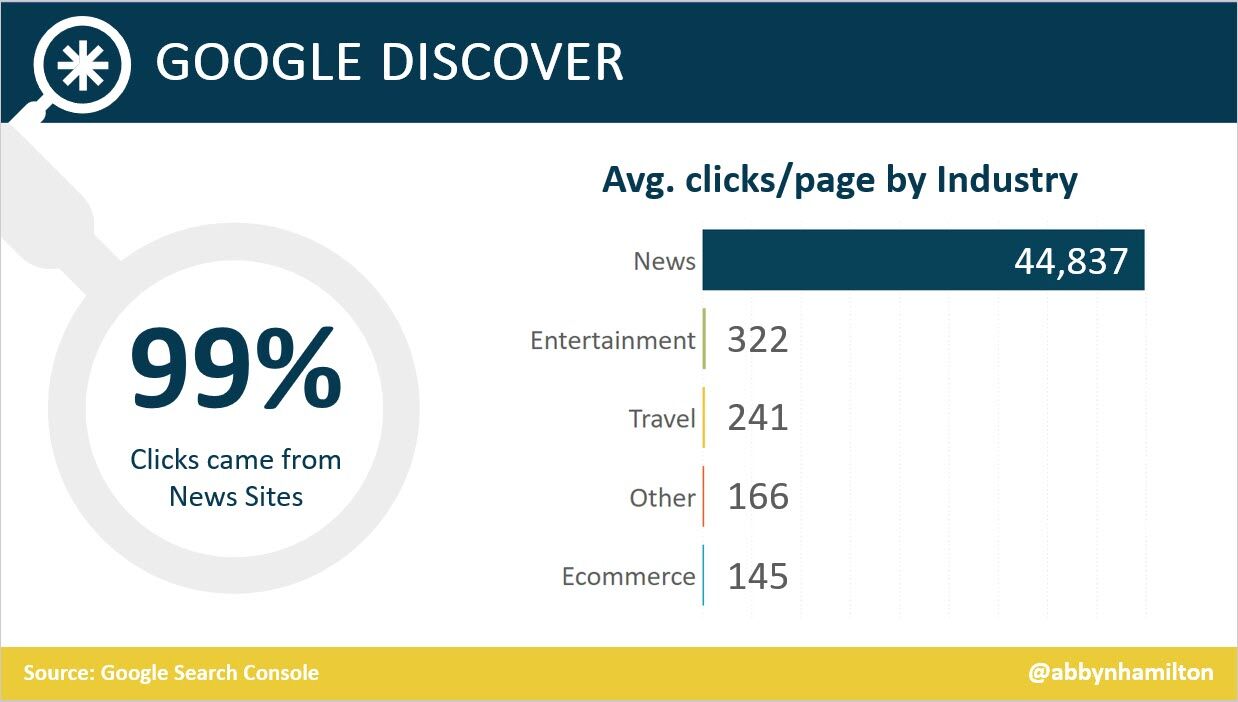
- 46% of Google Discover URLs are news sites, 44% e-commerce, 7% entertainment, and 2% travel. (Search Engine Journal)
- Even though news sites accounted for under 50% of Google Discover URLs, they received 99% of Discover clicks. (Search Engine Journal)

- Most Google Discover URLs only receive traffic for three to four days, with most of that traffic occurring one to two days after publishing. (Search Engine Journal)
- The clickthrough rate (CTR) for Google Discover is 11%. (Search Engine Journal)
- 91.45% of search volumes in Google Ads Keyword Planner are overestimates. (Ahrefs)
- For every $1 a business spends on Google Ads, they receive $8 in profit through Google Search and Ads. (Google)
- Google removed 5.5 billion ads, suspended 12.7 million advertiser accounts, restricted over 6.9 billion ads, and restricted ads from showing up on 2.1 billion publisher pages in 2023. (Google)
- The average shopping click-through rate (CTR) across all industries is 0.86% for Google Ads. (Wordstream)
- The average shopping cost per click (CPC) across all industries is $0.66 for Google Ads. (Wordstream)
- The average shopping conversion rate (CVR) across all industries is 1.91% for Google Ads. (Wordstream)
- 58% of consumers ages 25-34 use voice search daily. (UpCity)
- 16% of people use voice search for local “near me” searches. (UpCity)
- 67% of consumers say they’re very likely to use voice search when seeking information. (UpCity)
- Active users of the Google Assistant grew 4X over the past year, as of 2019. (Think With Google)
- Google Assistant hit 1 billion app installs. (Android Police)
- AI-generated answers from SGE were available for 91% of entertainment queries but only 17% of healthcare queries. (Statista)
- The AI-generated answers in Google’s Search Generative Experience (SGE) do not match any links from the top 10 Google organic search results 93.8% of the time. (Search Engine Journal)
- Google displays a Search Generative element for 86.8% of all search queries. (Authoritas)
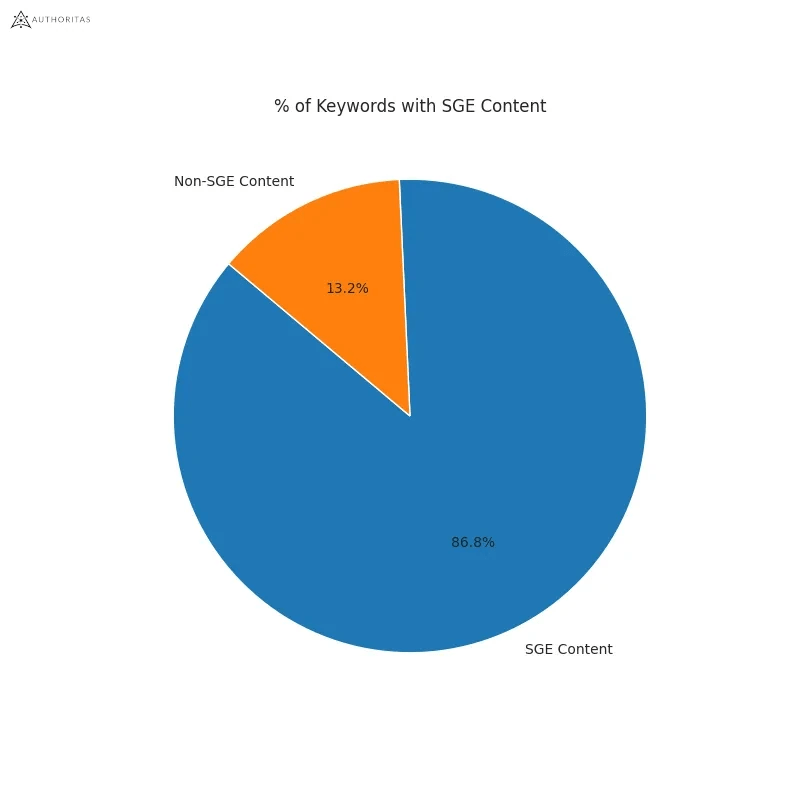

- 62% of generative links came from sources outside the top 10 ranking organic domains. Only 20.1% of generative URLs directly match an organic URL ranking on page one. (Authoritas)
- 70% of SEOs said that they were worried about the impact of SGE on organic search (Aira)
Learn more
Check out more resources on how Google works:
SEO
How To Use ChatGPT For Keyword Research

Anyone not using ChatGPT for keyword research is missing a trick.
You can save time and understand an entire topic in seconds instead of hours.
In this article, I outline my most effective ChatGPT prompts for keyword research and teach you how I put them together so that you, too, can take, edit, and enhance them even further.
But before we jump into the prompts, I want to emphasize that you shouldn’t replace keyword research tools or disregard traditional keyword research methods.
ChatGPT can make mistakes. It can even create new keywords if you give it the right prompt. For example, I asked it to provide me with a unique keyword for the topic “SEO” that had never been searched before.
“Interstellar Internet SEO: Optimizing content for the theoretical concept of an interstellar internet, considering the challenges of space-time and interplanetary communication delays.”
Although I want to jump into my LinkedIn profile and update my title to “Interstellar Internet SEO Consultant,” unfortunately, no one has searched that (and they probably never will)!
You must not blindly rely on the data you get back from ChatGPT.
What you can rely on ChatGPT for is the topic ideation stage of keyword research and inspiration.
ChatGPT is a large language model trained with massive amounts of data to accurately predict what word will come next in a sentence. However, it does not know how to do keyword research yet.
Instead, think of ChatGPT as having an expert on any topic armed with the information if you ask it the right question.
In this guide, that is exactly what I aim to teach you how to do – the most essential prompts you need to know when performing topical keyword research.
Best ChatGPT Keyword Research Prompts
The following ChatGPT keyword research prompts can be used on any niche, even a topic to which you are brand new.
For this demonstration, let’s use the topic of “SEO” to demonstrate these prompts.
Generating Keyword Ideas Based On A Topic
What Are The {X} Most Popular Sub-topics Related To {Topic}?
The first prompt is to give you an idea of the niche.
As shown above, ChatGPT did a great job understanding and breaking down SEO into three pillars: on-page, off-page & technical.
The key to the following prompt is to take one of the topics ChatGPT has given and query the sub-topics.
What Are The {X} Most Popular Sub-topics Related To {Sub-topic}?
For this example, let’s query, “What are the most popular sub-topics related to keyword research?”
Having done keyword research for over 10 years, I would expect it to output information related to keyword research metrics, the types of keywords, and intent.
Let’s see.
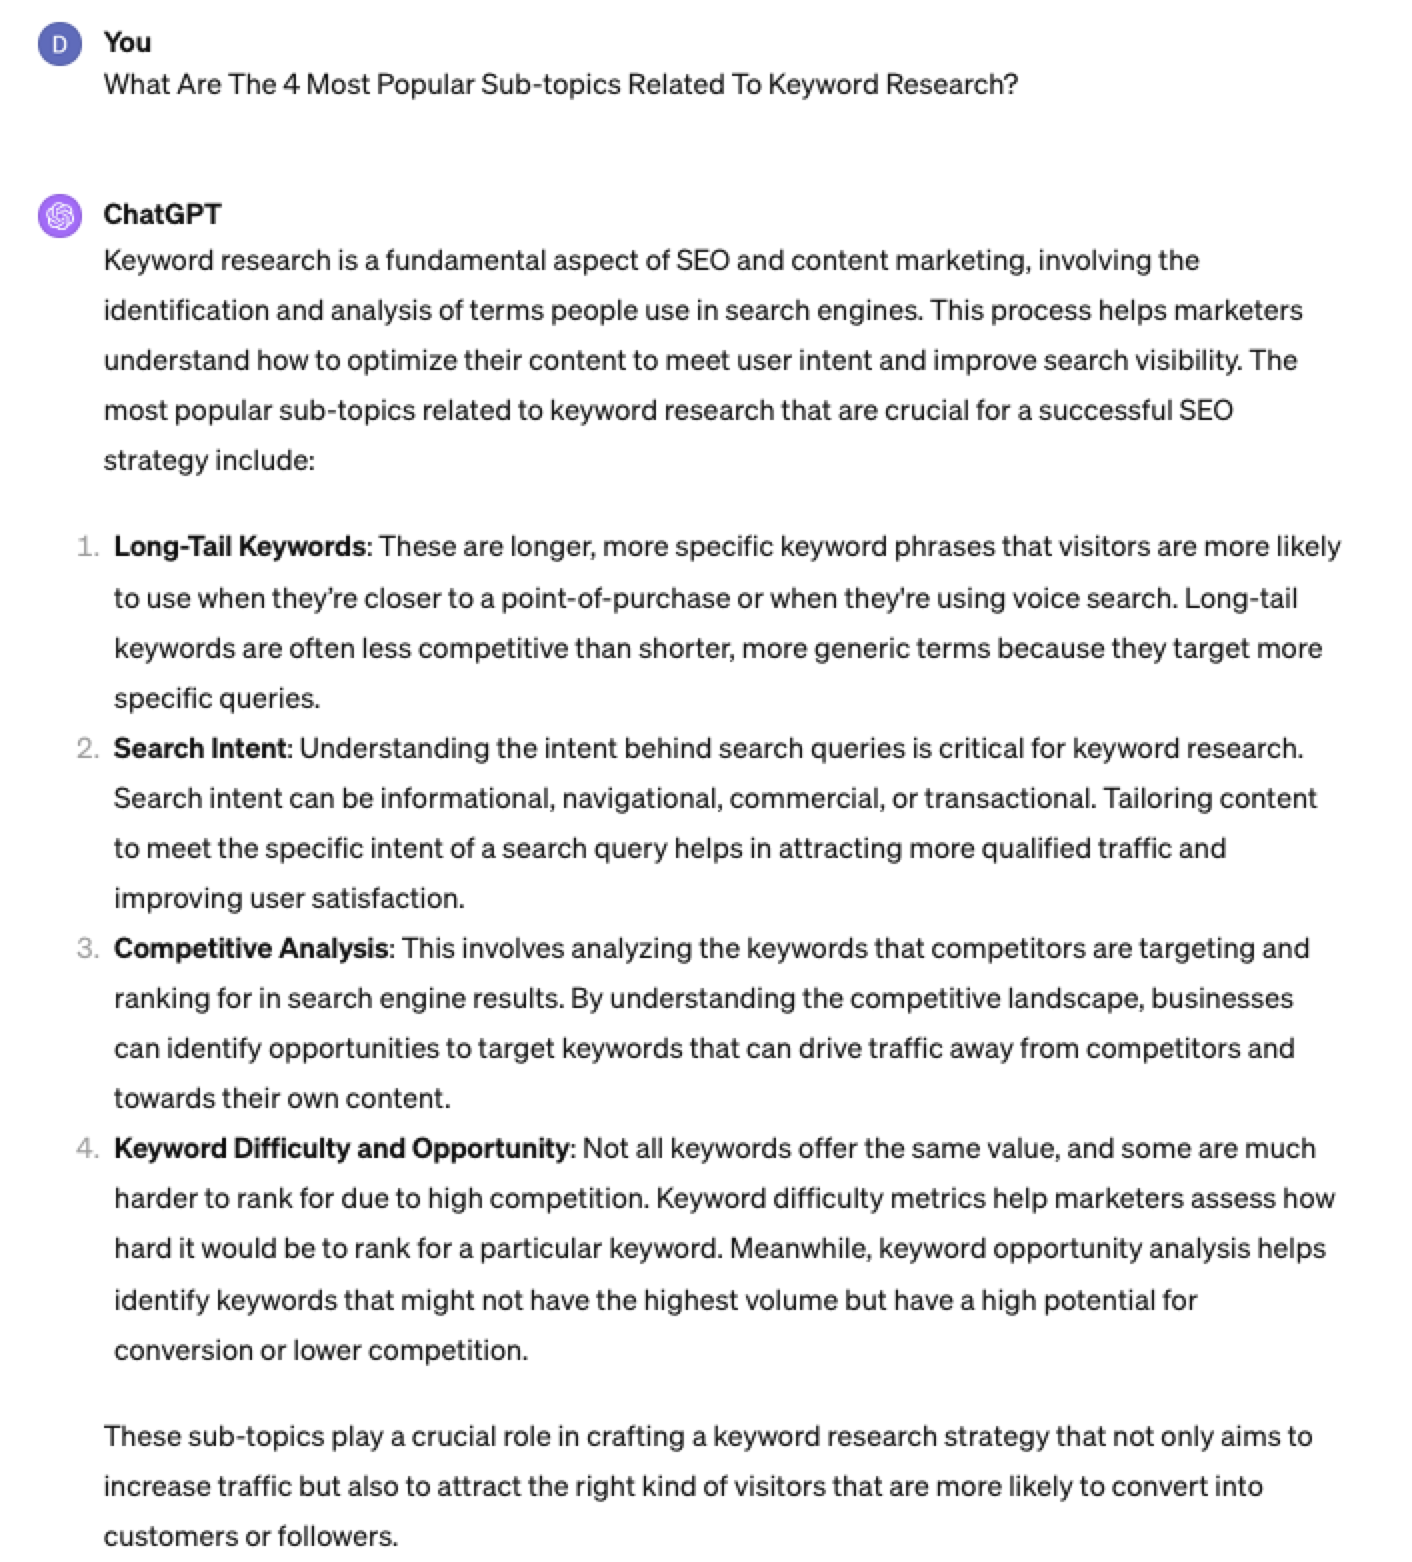 Screenshot from ChatGPT 4, April 2024
Again, right on the money.
To get the keywords you want without having ChatGPT describe each answer, use the prompt “list without description.”
Here is an example of that.
List Without Description The Top {X} Most Popular Keywords For The Topic Of {X}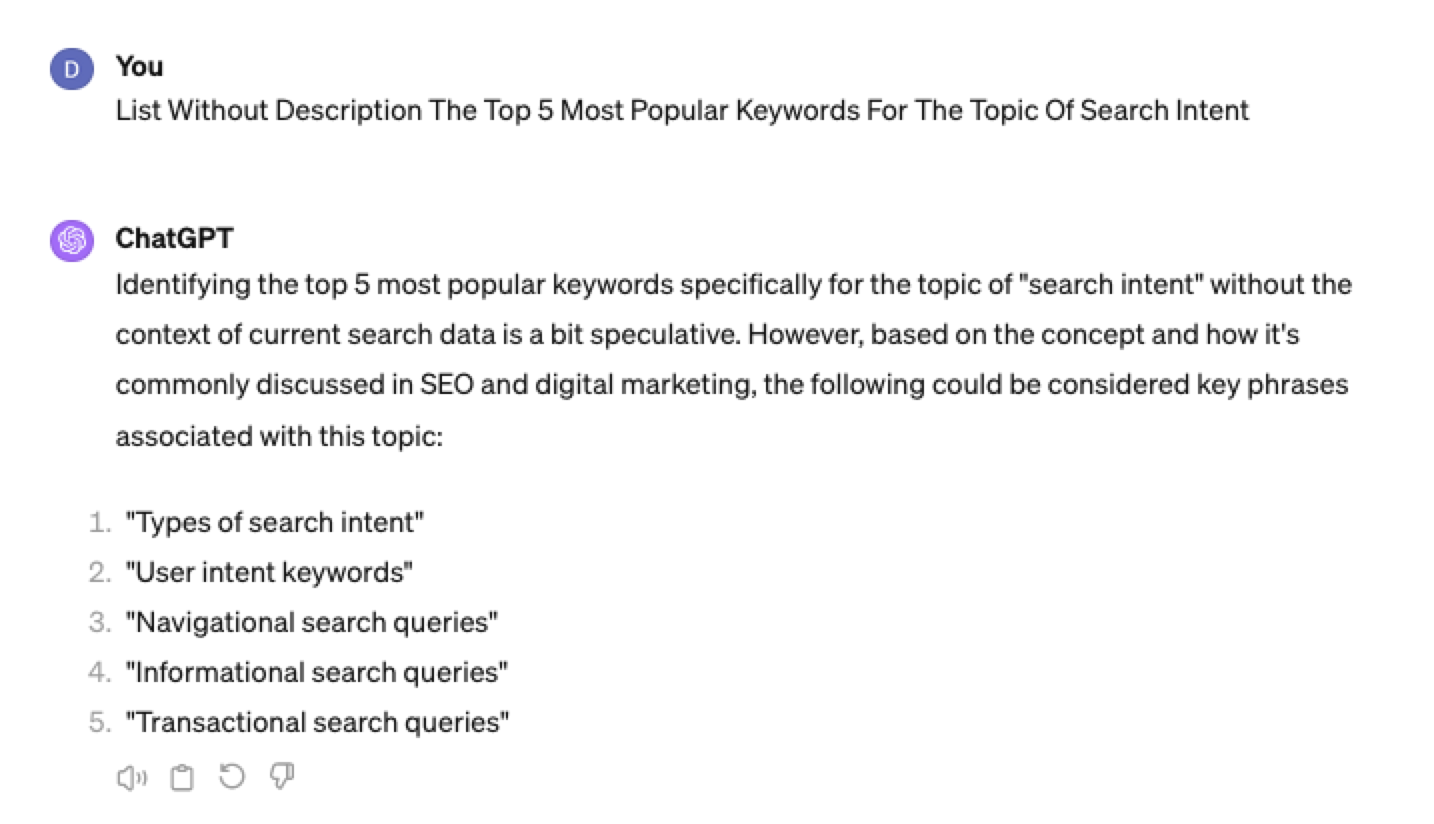
You can even branch these keywords out further into their long-tail.
Example prompt:
List Without Description The Top {X} Most Popular Long-tail Keywords For The Topic “{X}”
 Screenshot ChatGPT 4,April 2024
List Without Description The Top Semantically Related Keywords And Entities For The Topic {X}
You can even ask ChatGPT what any topic’s semantically related keywords and entities are!
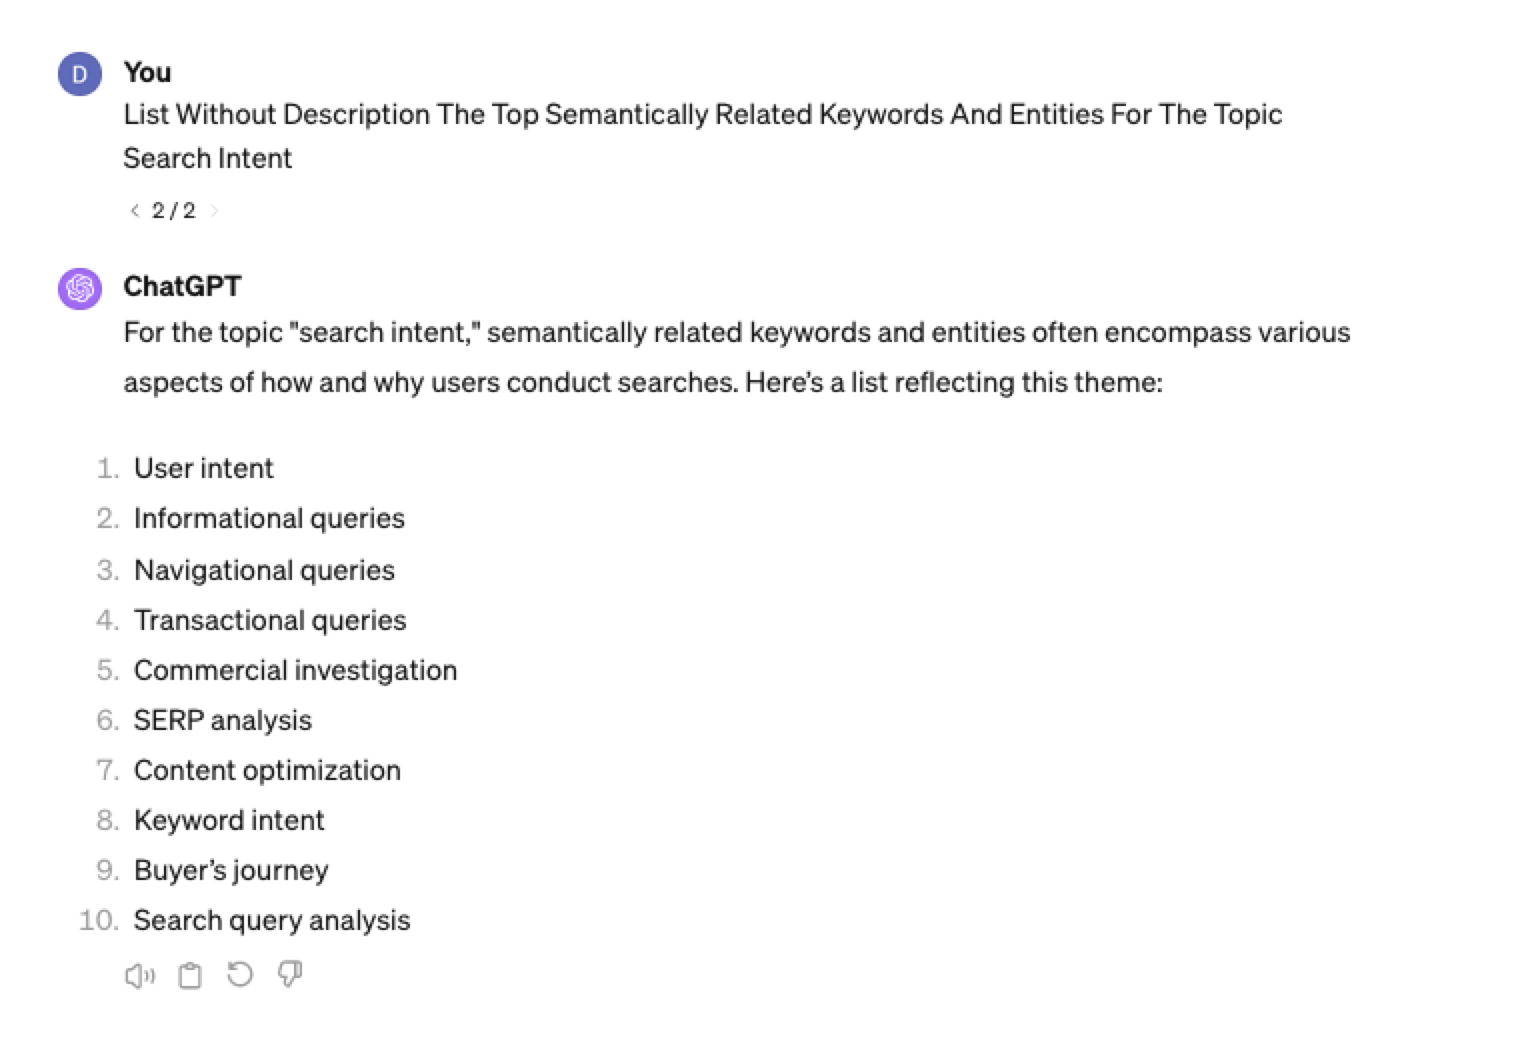 Screenshot ChatGPT 4, April 2024
Tip: The Onion Method Of Prompting ChatGPT
When you are happy with a series of prompts, add them all to one prompt. For example, so far in this article, we have asked ChatGPT the following:
- What are the four most popular sub-topics related to SEO?
- What are the four most popular sub-topics related to keyword research
- List without description the top five most popular keywords for “keyword intent”?
- List without description the top five most popular long-tail keywords for the topic “keyword intent types”?
- List without description the top semantically related keywords and entities for the topic “types of keyword intent in SEO.”
Combine all five into one prompt by telling ChatGPT to perform a series of steps. Example:
“Perform the following steps in a consecutive order Step 1, Step 2, Step 3, Step 4, and Step 5”
Example:
“Perform the following steps in a consecutive order Step 1, Step 2, Step 3, Step 4 and Step 5. Step 1 – Generate an answer for the 3 most popular sub-topics related to {Topic}?. Step 2 – Generate 3 of the most popular sub-topics related to each answer. Step 3 – Take those answers and list without description their top 3 most popular keywords. Step 4 – For the answers given of their most popular keywords, provide 3 long-tail keywords. Step 5 – for each long-tail keyword offered in the response, a list without descriptions 3 of their top semantically related keywords and entities.”
Generating Keyword Ideas Based On A Question
Taking the steps approach from above, we can get ChatGPT to help streamline getting keyword ideas based on a question. For example, let’s ask, “What is SEO?”
“Perform the following steps in a consecutive order Step 1, Step 2, Step 3, and Step 4. Step 1 Generate 10 questions about “{Question}”?. Step 2 – Generate 5 more questions about “{Question}” that do not repeat the above. Step 3 – Generate 5 more questions about “{Question}” that do not repeat the above. Step 4 – Based on the above Steps 1,2,3 suggest a final list of questions avoiding duplicates or semantically similar questions.”
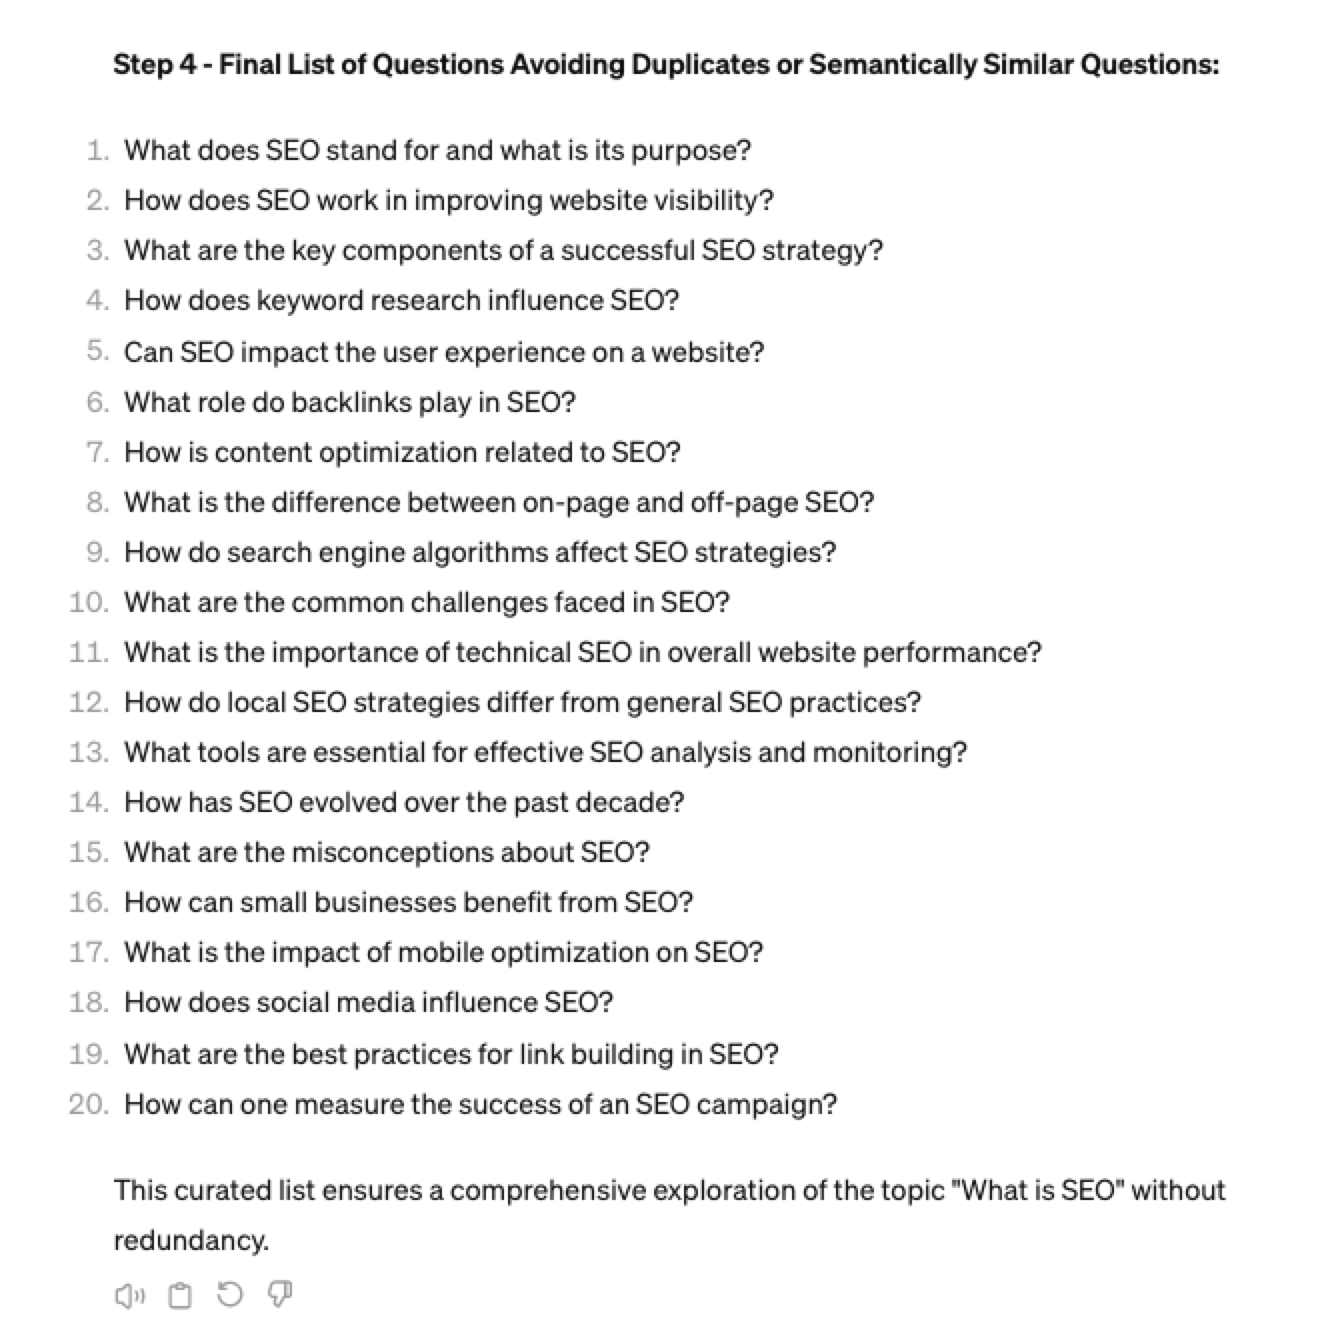 Screenshot ChatGPT 4, April 2024
Generating Keyword Ideas Using ChatGPT Based On The Alphabet Soup Method
One of my favorite methods, manually, without even using a keyword research tool, is to generate keyword research ideas from Google autocomplete, going from A to Z.
-
 Screenshot from Google autocomplete, April 2024
You can also do this using ChatGPT.
Example prompt:
“give me popular keywords that includes the keyword “SEO”, and the next letter of the word starts with a”
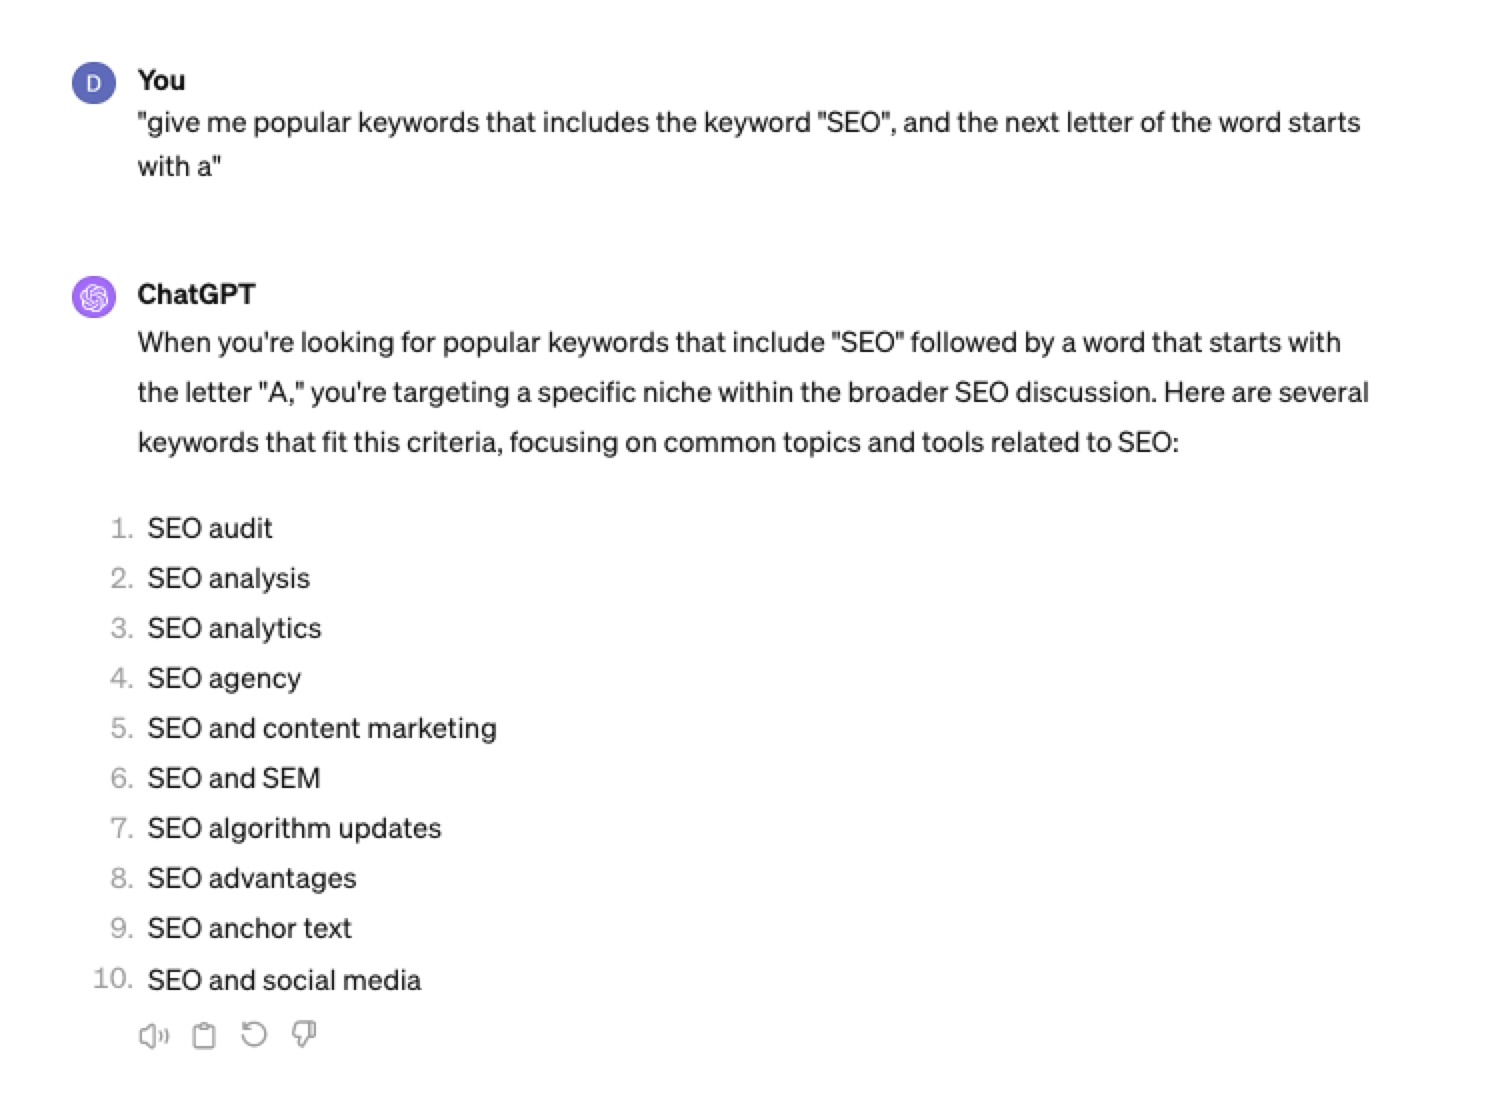 Screenshot from ChatGPT 4, April 2024
Tip: Using the onion prompting method above, we can combine all this in one prompt.
“Give me five popular keywords that include “SEO” in the word, and the following letter starts with a. Once the answer has been done, move on to giving five more popular keywords that include “SEO” for each letter of the alphabet b to z.”
Generating Keyword Ideas Based On User Personas
When it comes to keyword research, understanding user personas is essential for understanding your target audience and keeping your keyword research focused and targeted. ChatGPT may help you get an initial understanding of customer personas.
Example prompt:
“For the topic of “{Topic}” list 10 keywords each for the different types of user personas”
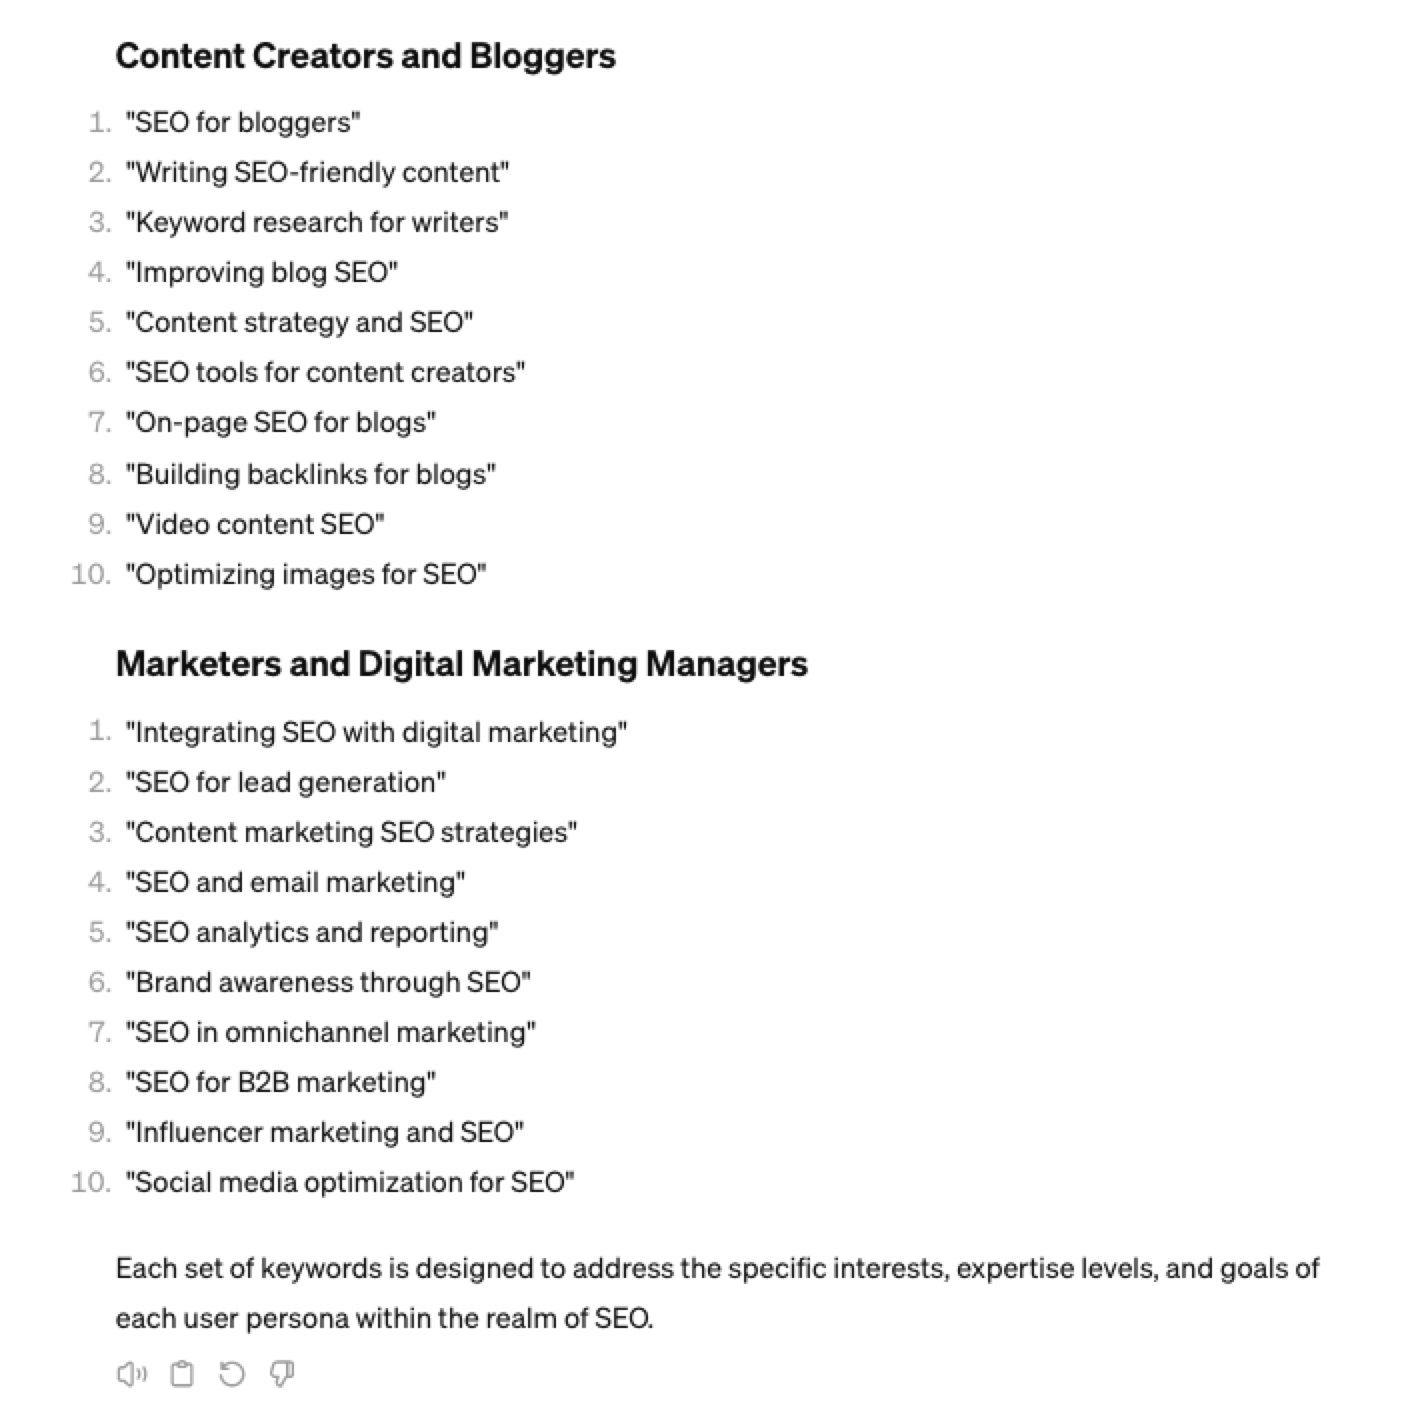 Screenshot from ChatGPT 4, April 2024
You could even go a step further and ask for questions based on those topics that those specific user personas may be searching for:
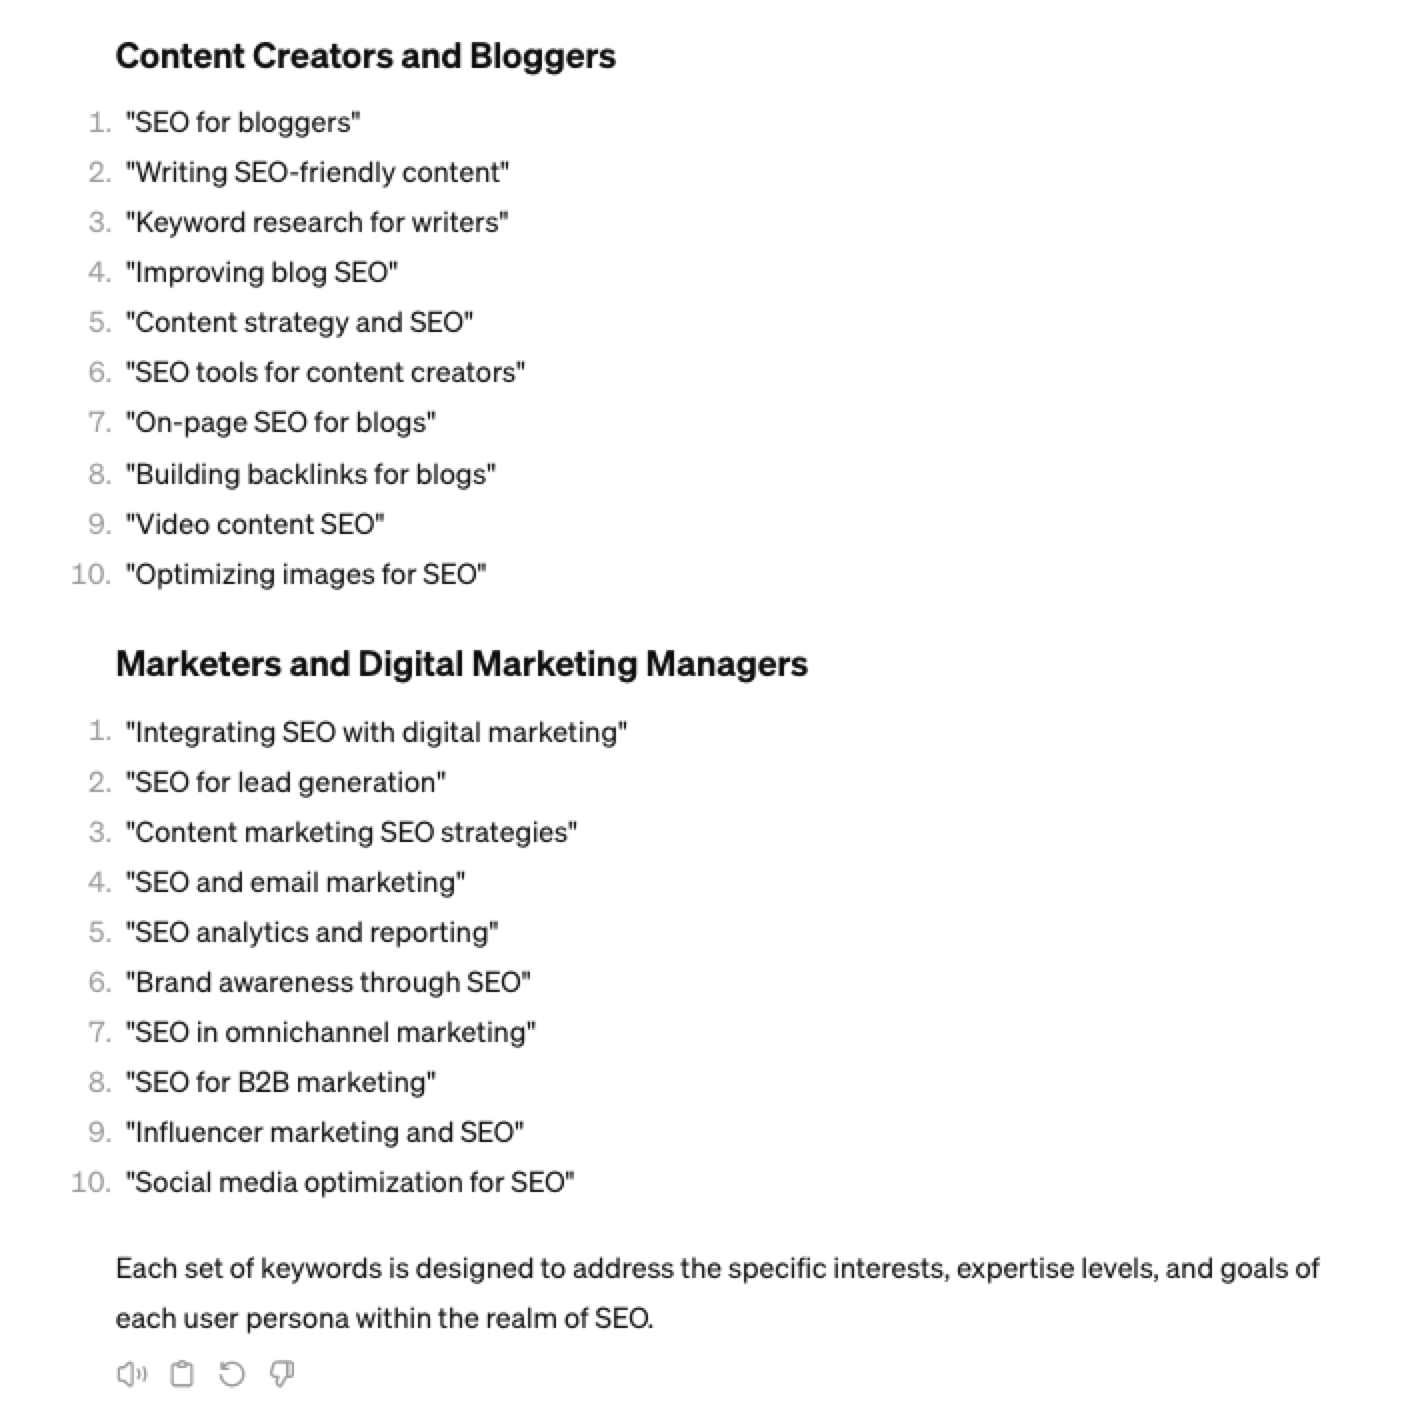 Screenshot ChatGPT 4, April 2024
As well as get the keywords to target based on those questions:
“For each question listed above for each persona, list the keywords, as well as the long-tail keywords to target, and put them in a table”
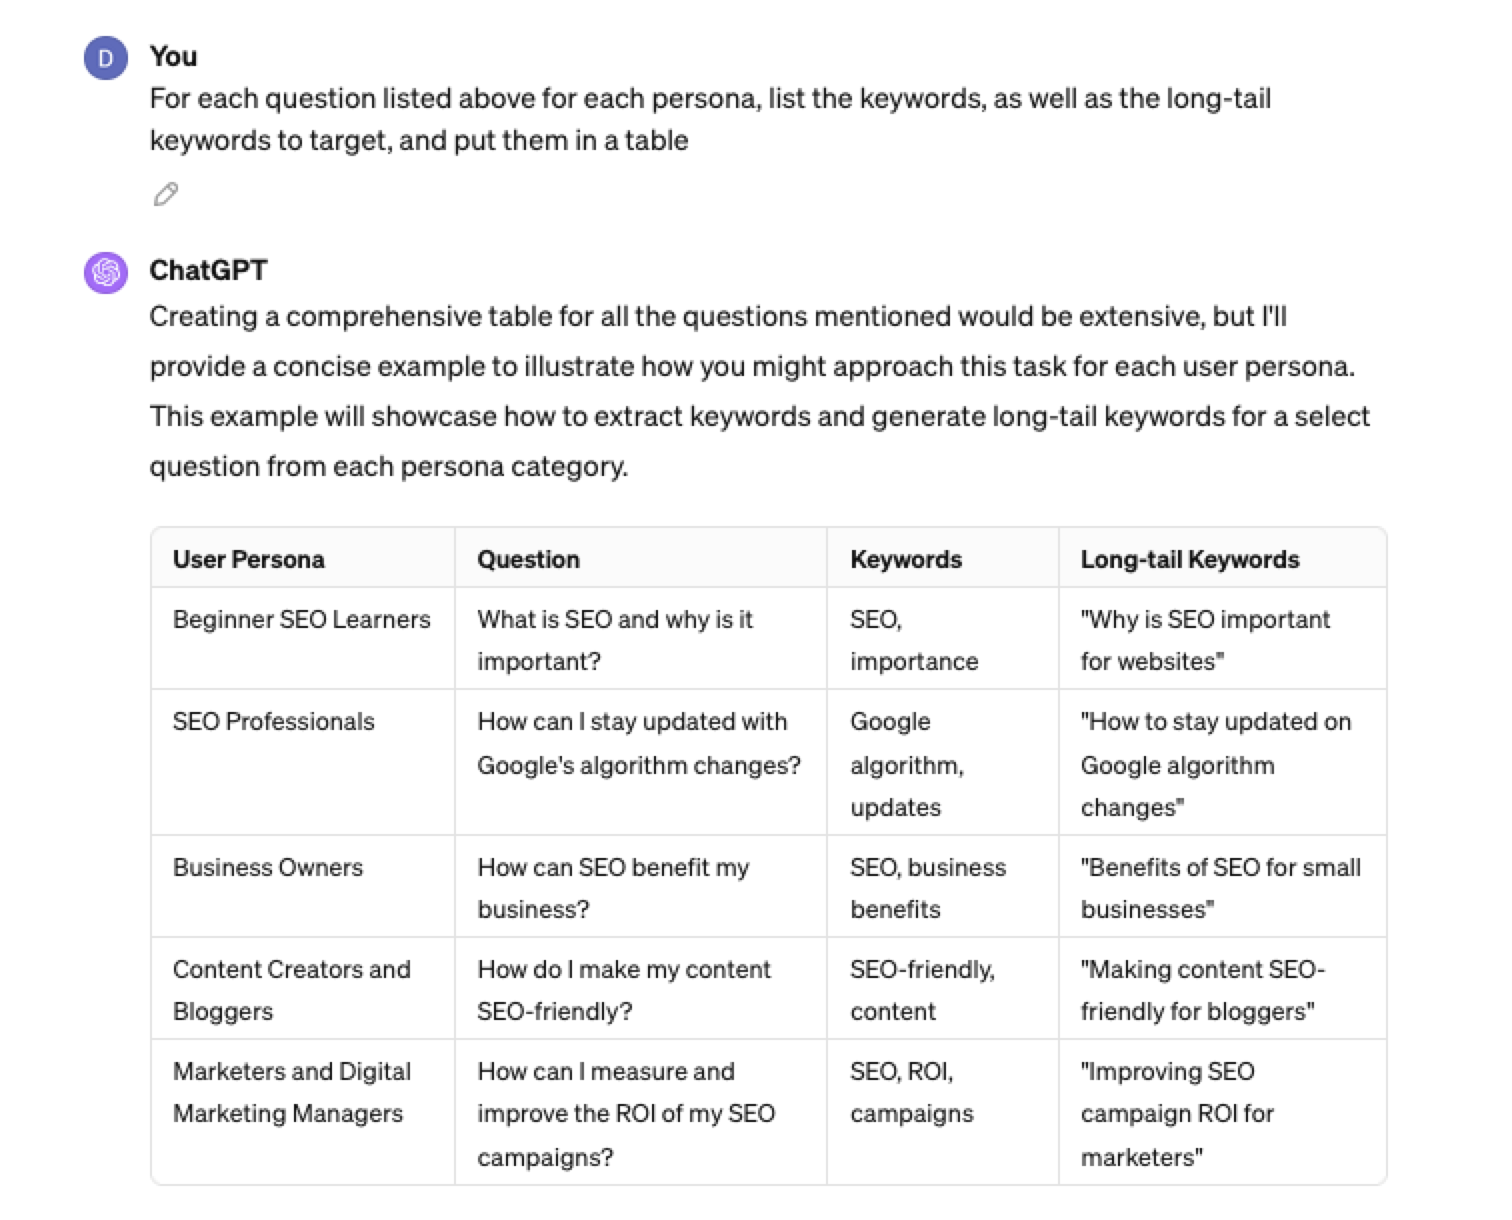 Screenshot from ChatGPT 4, April 2024
Generating Keyword Ideas Using ChatGPT Based On Searcher Intent And User Personas
Understanding the keywords your target persona may be searching is the first step to effective keyword research. The next step is to understand the search intent behind those keywords and which content format may work best.
For example, a business owner who is new to SEO or has just heard about it may be searching for “what is SEO.”
However, if they are further down the funnel and in the navigational stage, they may search for “top SEO firms.”
You can query ChatGPT to inspire you here based on any topic and your target user persona.
SEO Example:
“For the topic of “{Topic}” list 10 keywords each for the different types of searcher intent that a {Target Persona} would be searching for”
ChatGPT For Keyword Research Admin
Here is how you can best use ChatGPT for keyword research admin tasks.
Using ChatGPT As A Keyword Categorization Tool
One of the use cases for using ChatGPT is for keyword categorization.
In the past, I would have had to devise spreadsheet formulas to categorize keywords or even spend hours filtering and manually categorizing keywords.
ChatGPT can be a great companion for running a short version of this for you.
Let’s say you have done keyword research in a keyword research tool, have a list of keywords, and want to categorize them.
You could use the following prompt:
“Filter the below list of keywords into categories, target persona, searcher intent, search volume and add information to a six-column table: List of keywords – [LIST OF KEYWORDS], Keyword Search Volume [SEARCH VOLUMES] and Keyword Difficulties [KEYWORD DIFFICUTIES].”
-
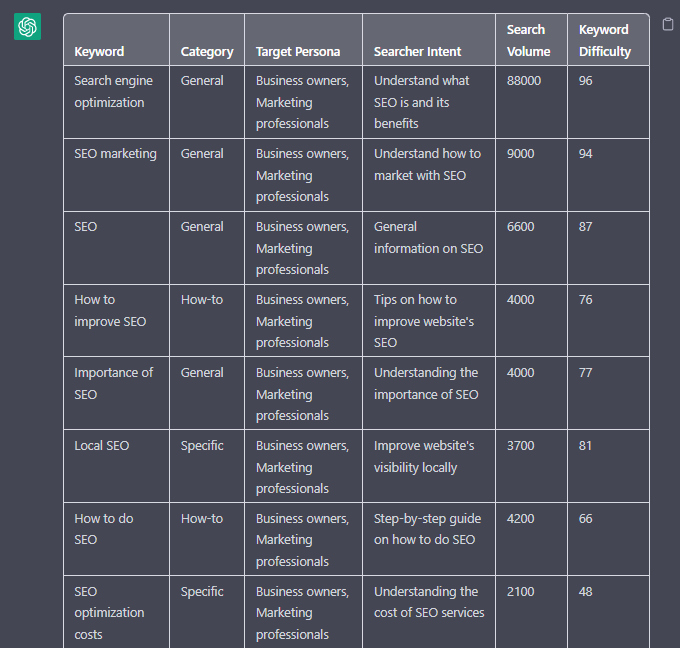 Screenshot from ChatGPT, April 2024
Tip: Add keyword metrics from the keyword research tools, as using the search volumes that a ChatGPT prompt may give you will be wildly inaccurate at best.
Using ChatGPT For Keyword Clustering
Another of ChatGPT’s use cases for keyword research is to help you cluster. Many keywords have the same intent, and by grouping related keywords, you may find that one piece of content can often target multiple keywords at once.
However, be careful not to rely only on LLM data for clustering. What ChatGPT may cluster as a similar keyword, the SERP or the user may not agree with. But it is a good starting point.
The big downside of using ChatGPT for keyword clustering is actually the amount of keyword data you can cluster based on the memory limits.
So, you may find a keyword clustering tool or script that is better for large keyword clustering tasks. But for small amounts of keywords, ChatGPT is actually quite good.
A great use small keyword clustering use case using ChatGPT is for grouping People Also Ask (PAA) questions.
Use the following prompt to group keywords based on their semantic relationships. For example:
“Organize the following keywords into groups based on their semantic relationships, and give a short name to each group: [LIST OF PAA], create a two-column table where each keyword sits on its own row.
-
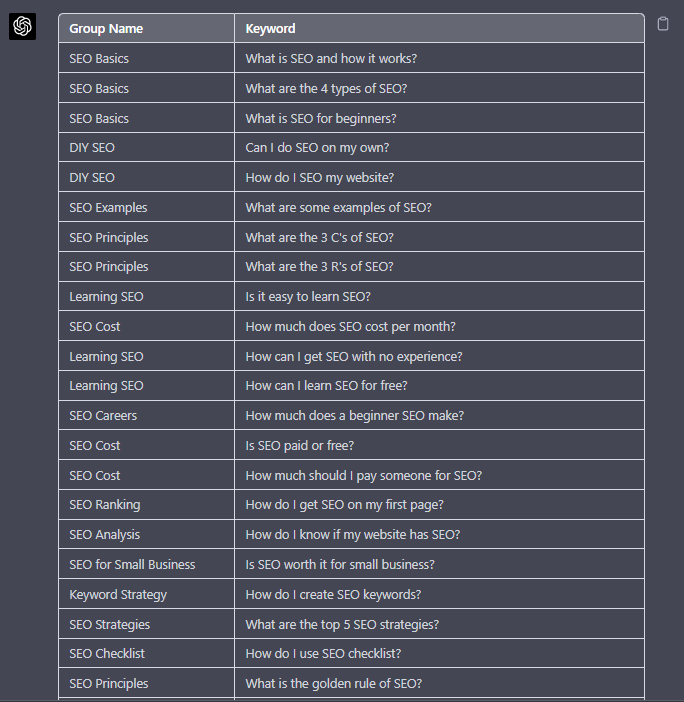 Screenshot from ChatGPT, April 2024
Using Chat GPT For Keyword Expansion By Patterns
One of my favorite methods of doing keyword research is pattern spotting.
Most seed keywords have a variable that can expand your target keywords.
Here are a few examples of patterns:
1. Question Patterns
(who, what, where, why, how, are, can, do, does, will)
“Generate [X] keywords for the topic “[Topic]” that contain any or all of the following “who, what, where, why, how, are, can, do, does, will”
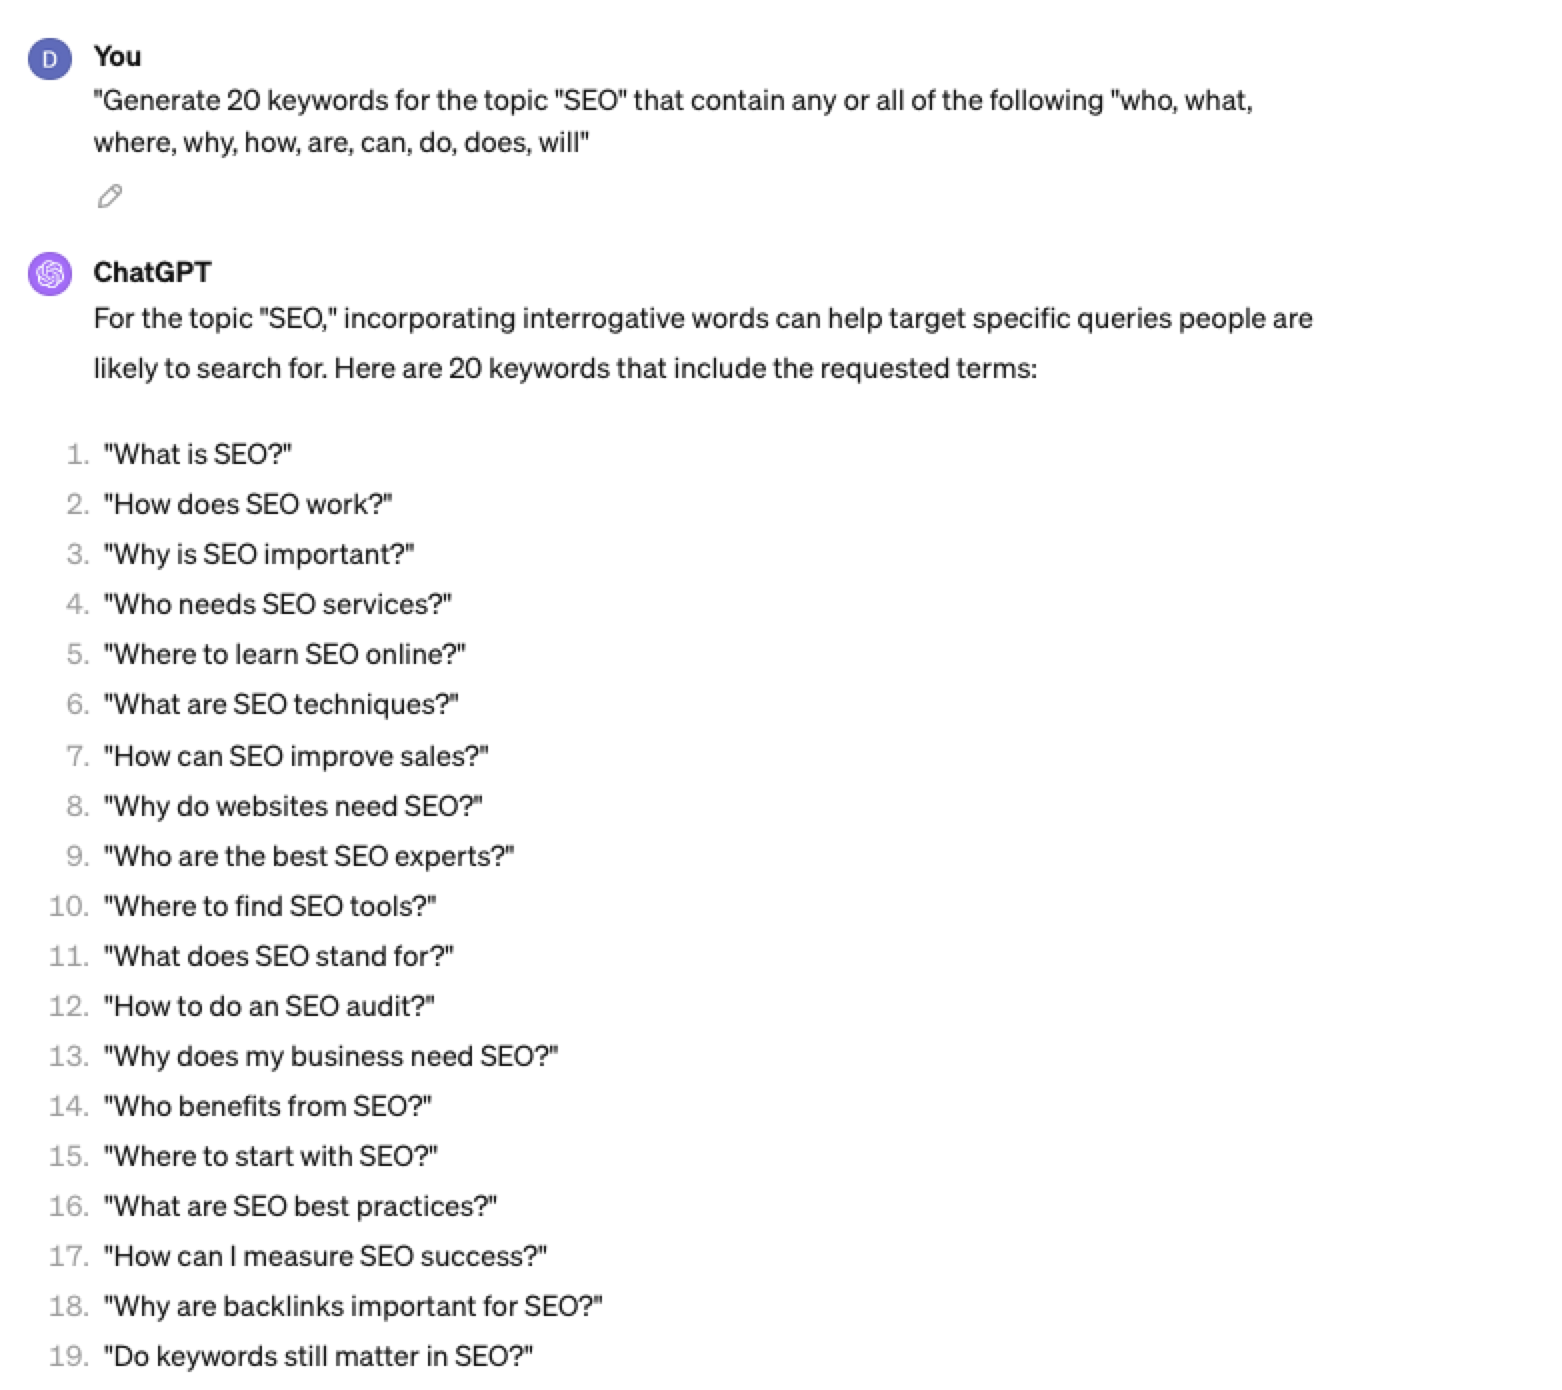 Screenshot ChatGPT 4, April 2024
2. Comparison Patterns
Example:
“Generate 50 keywords for the topic “{Topic}” that contain any or all of the following “for, vs, alternative, best, top, review”
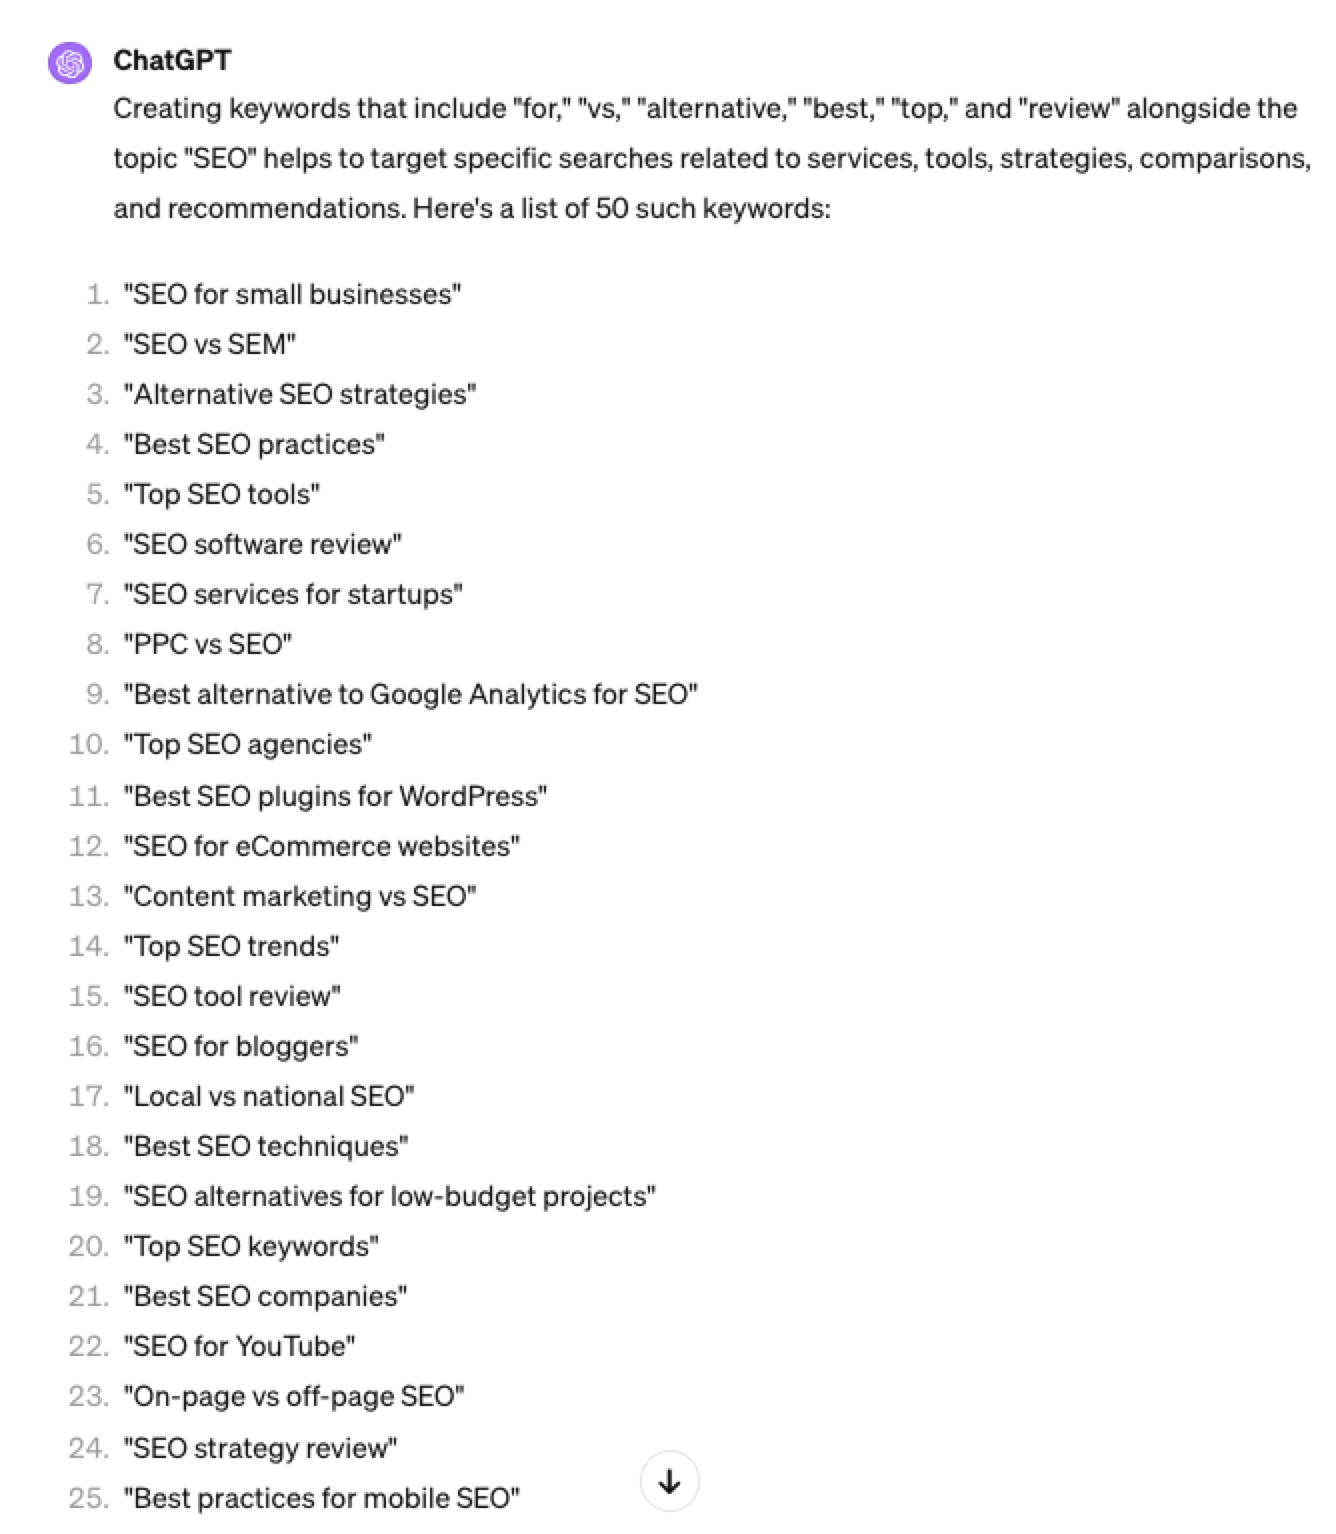 Screenshot ChatGPT 4, April 2024
3. Brand Patterns
Another one of my favorite modifiers is a keyword by brand.
We are probably all familiar with the most popular SEO brands; however, if you aren’t, you could ask your AI friend to do the heavy lifting.
Example prompt:
“For the top {Topic} brands what are the top “vs” keywords”
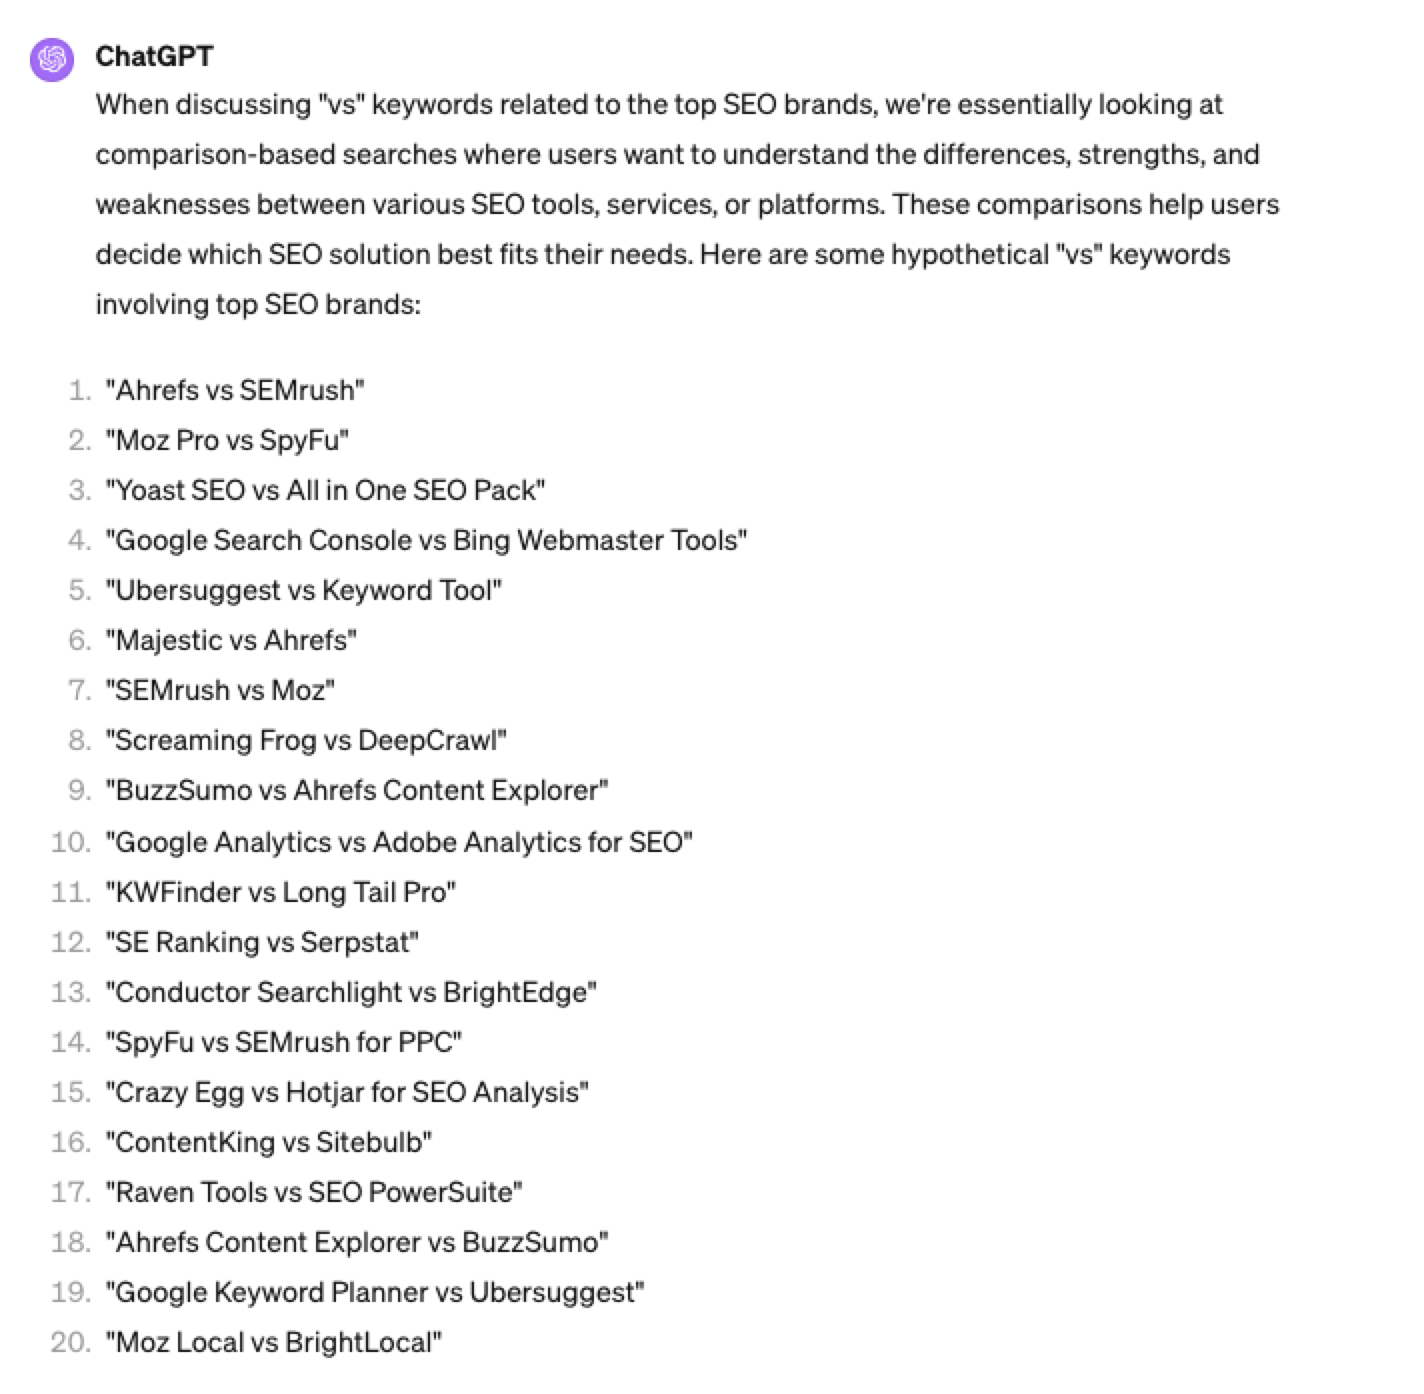 Screenshot ChatGPT 4, April 2024
4. Search Intent Patterns
One of the most common search intent patterns is “best.”
When someone is searching for a “best {topic}” keyword, they are generally searching for a comprehensive list or guide that highlights the top options, products, or services within that specific topic, along with their features, benefits, and potential drawbacks, to make an informed decision.
Example:
“For the topic of “[Topic]” what are the 20 top keywords that include “best”
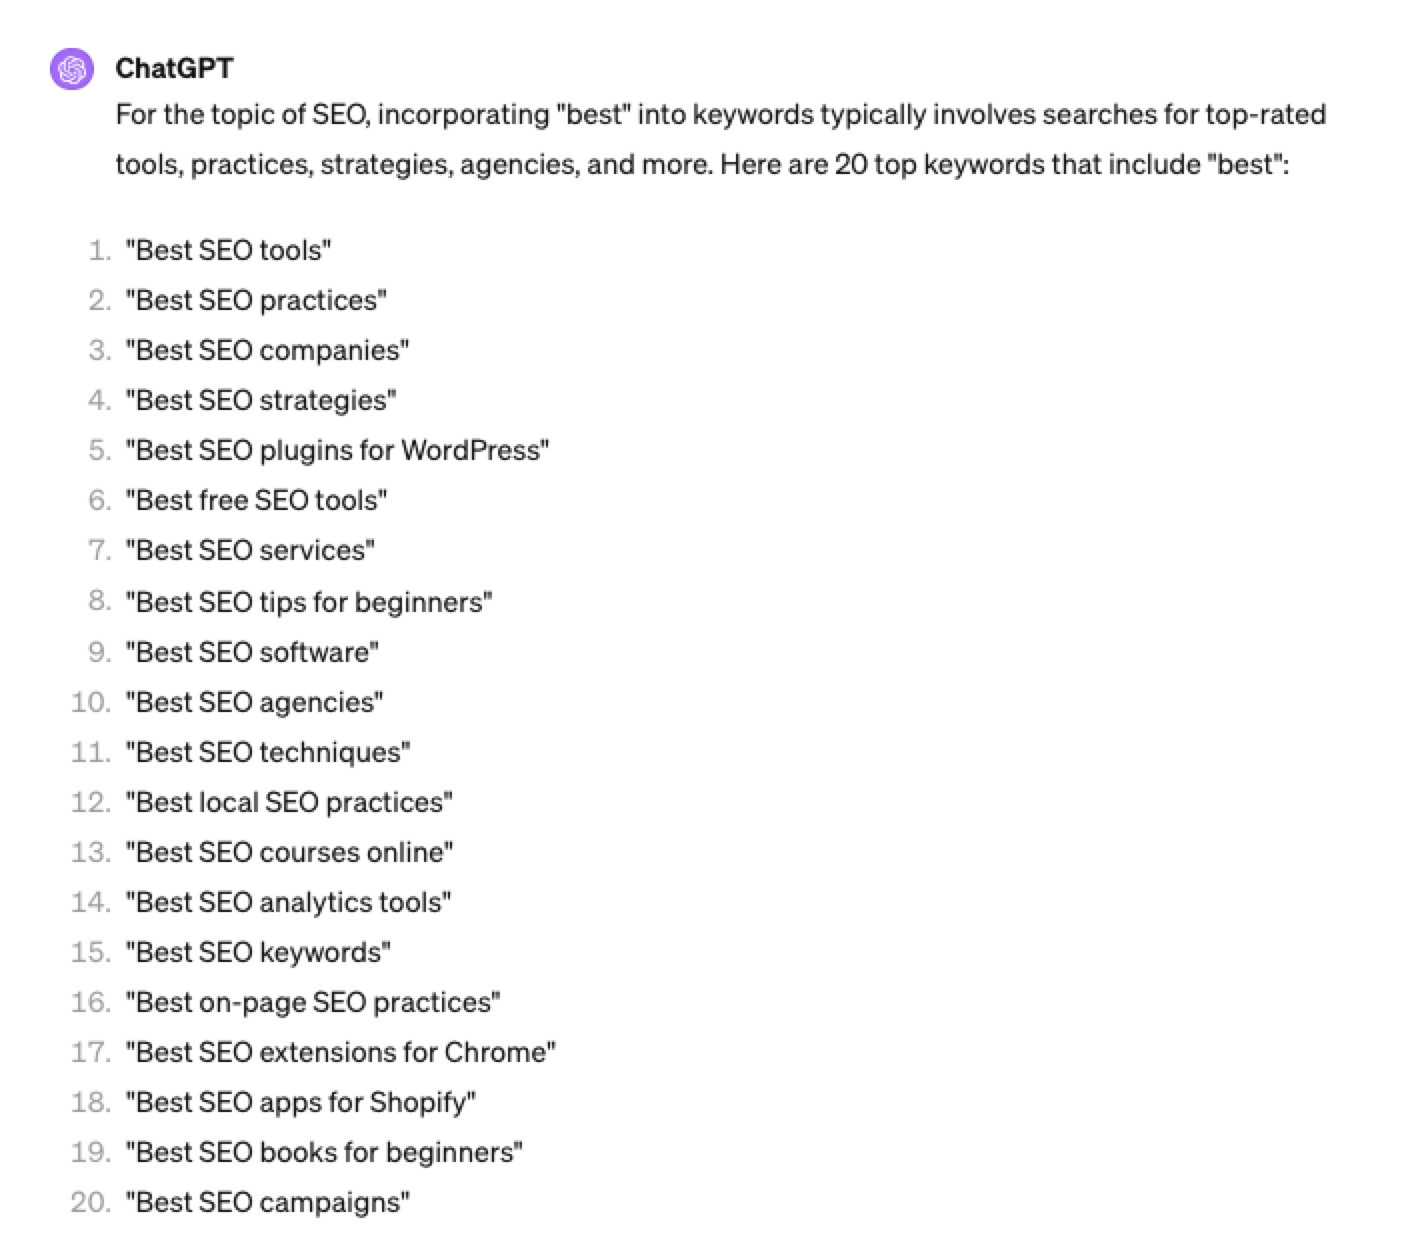 Screenshot ChatGPT 4, April 2024
Again, this guide to keyword research using ChatGPT has emphasized the ease of generating keyword research ideas by utilizing ChatGPT throughout the process.
Keyword Research Using ChatGPT Vs. Keyword Research Tools
Free Vs. Paid Keyword Research Tools
Like keyword research tools, ChatGPT has free and paid options.
However, one of the most significant drawbacks of using ChatGPT for keyword research alone is the absence of SEO metrics to help you make smarter decisions.
To improve accuracy, you could take the results it gives you and verify them with your classic keyword research tool – or vice versa, as shown above, uploading accurate data into the tool and then prompting.
However, you must consider how long it takes to type and fine-tune your prompt to get your desired data versus using the filters within popular keyword research tools.
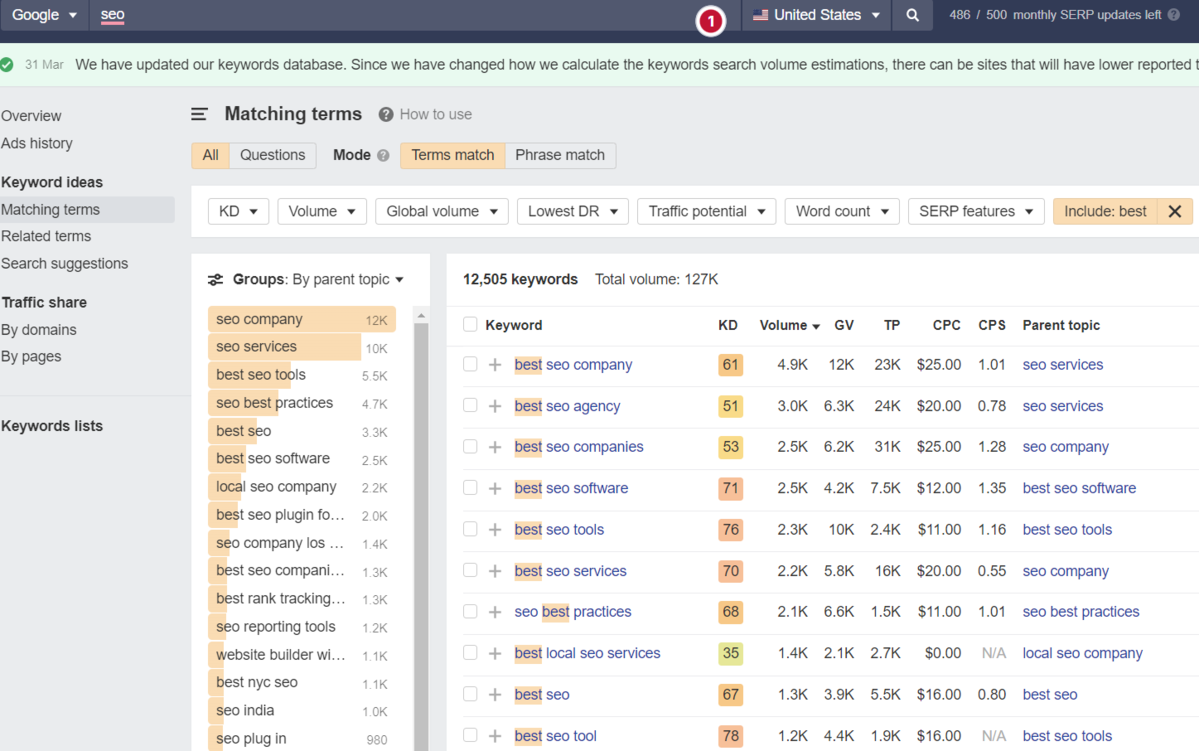
For example, if we use a popular keyword research tool using filters, you could have all of the “best” queries with all of their SEO metrics:
-
 Screenshot from Ahrefs Keyword Explorer, March 2024
And unlike ChatGPT, generally, there is no token limit; you can extract several hundred, if not thousands, of keywords at a time.
As I have mentioned multiple times throughout this piece, you cannot blindly trust the data or SEO metrics it may attempt to provide you with.
The key is to validate the keyword research with a keyword research tool.
ChatGPT For International SEO Keyword Research
ChatGPT can be a terrific multilingual keyword research assistant.
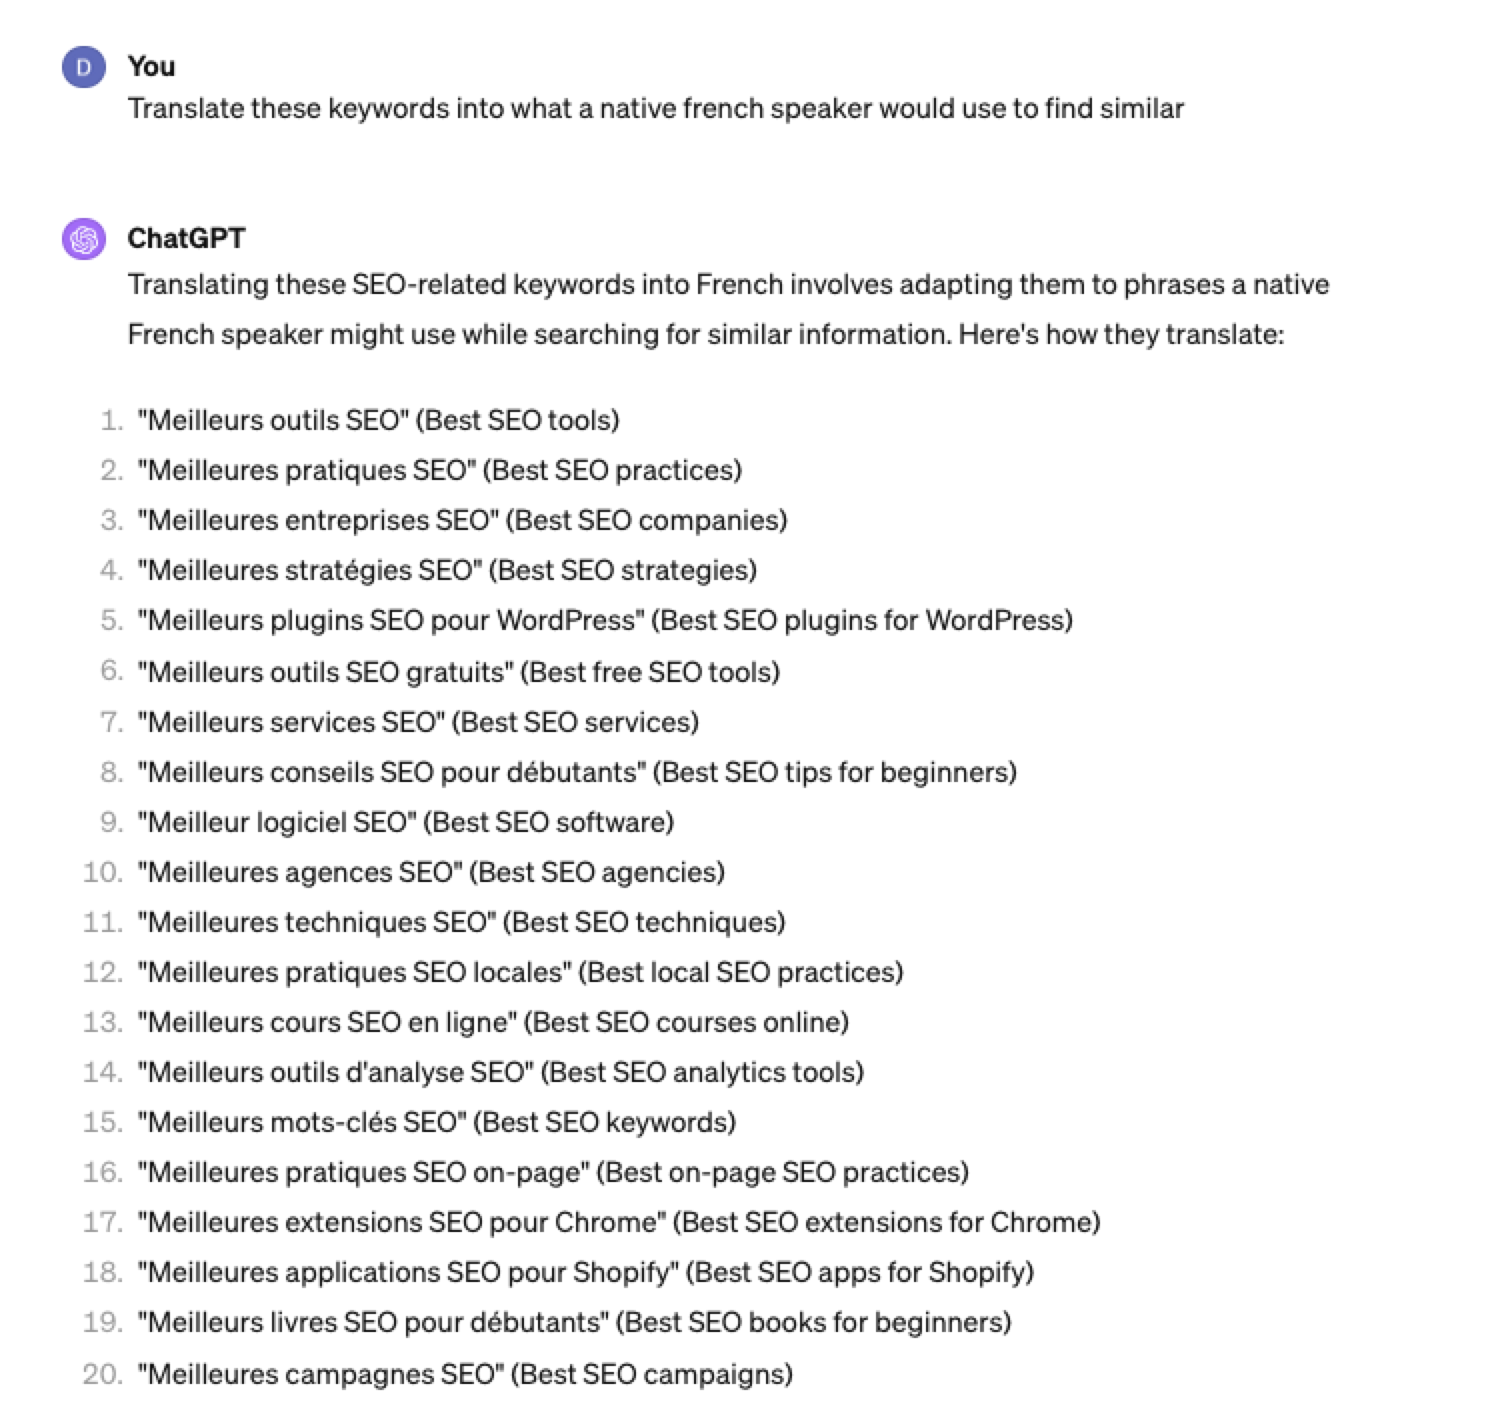
For example, if you wanted to research keywords in a foreign language such as French. You could ask ChatGPT to translate your English keywords;
 Screenshot ChatGPT 4, Apil 2024
- The key is to take the data above and paste it into a popular keyword research tool to verify.
- As you can see below, many of the keyword translations for the English keywords do not have any search volume for direct translations in French.
 Screenshot from Ahrefs Keyword Explorer, April 2024
But don’t worry, there is a workaround: If you have access to a competitor keyword research tool, you can see what webpage is ranking for that query – and then identify the top keyword for that page based on the ChatGPT translated keywords that do have search volume.
-
-
 Screenshot from Ahrefs Keyword Explorer, April 2024
Or, if you don’t have access to a paid keyword research tool, you could always take the top-performing result, extract the page copy, and then ask ChatGPT what the primary keyword for the page is.
Key Takeaway
-
ChatGPT can be an expert on any topic and an invaluable keyword research tool. However, it is another tool to add to your toolbox when doing keyword research; it does not replace traditional keyword research tools.
As shown throughout this tutorial, from making up keywords at the beginning to inaccuracies around data and translations, ChatGPT can make mistakes when used for keyword research.
You cannot blindly trust the data you get back from ChatGPT.
However, it can offer a shortcut to understanding any topic for which you need to do keyword research and, as a result, save you countless hours.
But the key is how you prompt.
The prompts I shared with you above will help you understand a topic in minutes instead of hours and allow you to better seed keywords using keyword research tools.
It can even replace mundane keyword clustering tasks that you used to do with formulas in spreadsheets or generate ideas based on keywords you give it.
Paired with traditional keyword research tools, ChatGPT for keyword research can be a powerful tool in your arsenal.
More resources:
Featured Image: Tatiana Shepeleva/Shutterstock
-

 PPC6 days ago
How the TikTok Algorithm Works in 2024 (+9 Ways to Go Viral)
-

 SEO5 days ago
How to Use Keywords for SEO: The Complete Beginner’s Guide
-

 SEO7 days ago
Blog Post Checklist: Check All Prior to Hitting “Publish”
-

 MARKETING6 days ago
How To Protect Your People and Brand
-

 PPC7 days ago
How to Brainstorm Business Ideas: 9 Fool-Proof Approaches
-

 MARKETING7 days ago
Elevating Women in SEO for a More Inclusive Industry
-

 MARKETING3 days ago
Advertising on Hulu: Ad Formats, Examples & Tips
-

 MARKETING5 days ago
The Ultimate Guide to Email Marketing




You must be logged in to post a comment Login