SEO
8 Engaging Infographic Types & How To Create Them (+ 5 Free Tools)
If done correctly, infographics are a great visual to grab the readers’ attention while effectively communicating key points you want them to focus on within your content.
There are numerous benefits to incorporating infographics that can help your marketing strategy and build brand authority.
First, it incentivizes readers to stop and focus on the information through its well-planned design highlighting key data.
It can also play a storytelling role and guide readers through a new process or viewpoint leading to your call to action.
A recent study shows that 57% of B2B marketers are incorporating infographics and charts into their marketing content.
Not only are infographics great ways to inform readers or persuade them, but they are easier to share across social media to help reach your target audience.
Generally, people like to take in bite-sized information, and this is a creative way to accomplish that.
Infographics are useful throughout many forms of marketing content, such as blog posts, webpages, landing pages, emails, and lead generators.
Anatomy Of An Infographic
Now that you know why they are so important for marketing, we’ll break down the different components of infographics, the valuable and effective types of infographics out there, and some free tools you can use to create them.
Eye-Catching Title And Subheadings
So, for the main parts of a compelling infographic, first, you have to select the topic you want to discuss.
Then, you can lay out the main topic and subtopics with their corresponding title and subheadings.
It’s crucial they are well thought out and descriptive, so you can quickly get across to your reader what you’re trying to present to them.
Background And Research
Next, you’ll need to brainstorm and gather background information or conduct research for your topic. This is a crucial part of the process since it’s the foundation of your infographic.
Make sure you’re pulling the right information to highlight for your infographic. This could include statistics, data, or important facts for the intention and retention of information for your post.
This data can come from internal information such as customer data or research you’ve already conducted, as well as quotes from thought leaders, industry experts, or any credible sources you find along your research journey. Just make sure to verify your sources.
Layout And Design
After you have all the information you need, you can select what you’d like to use and begin the layout and design. Make sure to include attention-grabbing graphics, images, or icons.
Graphics are helpful and aesthetically pleasing elements to enhance your infographics.
It’s vital to ensure that the theme is consistent, not just throughout the infographic’s layout but also within your chosen information.
Also, make sure you keep your brand elements in mind when designing your infographic.
Now, we’ll dive into some best practices for designing an infographic and then run through the different types of infographics that can help make your data shine.
Best Practices For Designing Infographics
Below are some valuable aspects to keep in mind when designing an infographic:
- Pick your target audience and tailor your infographic to that audience.
- Determine an infographic type that best suits the information.
- Choose a designer or create a wireframe.
- Select your key performance indicators.
- Marketing your infographic with appealing headlines.
- Create a good meta description or initial copy to draw people in.
- Make sure you can easily share and locate your infographic.
- Review your infographic and get feedback from team members.
Infographic Types And When to Use Them
Understanding how and when to use the following infographics can help you better engage with your readers and make sure they are focusing on the information you want them to remember.
Here are the different types of infographics you should consider:
1. Timeline
Timeline infographics are perfect for showing the different steps to planning an event, creating a storyline for a topic, or presenting a timeline of important milestones your company has hit recently.
In addition, they are great for showing critical points in work history or when you want to further discuss projections of an event.
If you’re trying to show how long a project will take, you can show when each goal or aspect of a project will be completed in a timeline infographic.
For example, you might want to use this type if you have an upcoming project and want to detail the dates for milestones along the way to represent how that project will come to fruition visually.
If you choose to create a timeline infographic, you might want to make the dates or points stand out by using different font sizes and connecting each date with a line.
In addition, you can use different colors to differentiate between the date and subtext.
2. Statistical
Statistical infographics help your readers better understand and retain specific data points or statistics that are key to the information you’re providing.
This can be helpful to highlight information to prove a point and convince your reader with quality resources.
Again, this puts the communication effort on the numbers, making them work in your favor.
If your company recently completed a study and wants to showcase the outcome or attach an infographic to a case study to quickly highlight the data, a statistical infographic could be a great way to do so.
3. Flowchart
Like the timeline infographic, a flowchart breaks down the main components of an event or project but focuses more on the actual steps or significant points along the path to completing a task.
It’s a visualized and summarized representation of key ideas. This can be useful if you are trying to simplify explaining a process and help your readers better understand each step.
If you choose a flowchart infographic, ensure that each step has cues to the next step.
For example, you can separate subtitles and content with different colors and sized fonts. This can also be helpful if you’re trying to communicate a new process within your company, need to create a how-to guide, or show a hierarchy.
4. Informational
An informational infographic could be perfect if you want to make a couple of key points pop.
It would also be helpful if you’re going to communicate an overview of an event or new idea. It’s a great way to summarize or give the main points to a more in-depth topic.
It can be helpful to include these types of infographics in a blog post to help quickly and effectively relay information to your readers where you plan on providing future content about a particular concept.
The title and subheadings are key here; they need to be descriptive and engaging if you’re explaining a complex topic.
You can help differentiate the points by putting them in blocked sections with different colors. Although, don’t go overboard, just select a couple of colors for the infographic’s theme.
5. Comparison
Comparison infographics are perfect for comparing two different products or services.
For example, you can compare your company’s product to another or describe the pros and cons of why a product would work better in one situation over another.
Comparison infographics are also great for producing a list of some of the positives and negatives of a viewpoint or if you want to compare different stances on a topic.
But, it’s important to keep the information concise so as not to overwhelm the reader with too much data.
6. List
People often create to-do or checklists in their daily life to keep track of what they want to accomplish, and this can transfer over to helpful infographics.
For example, if you want to create a summary or list of tips or main points on a topic, a list infographic can be handy.
For a list infographic, keep the information succinct and straightforward; remember this is short-form content.
Also, group related information together in the layout to avoid confusing the points.
7. Maps
Map infographics are perfect for presenting information on an accumulation of locations of a business in different geographic areas or providing a quick rundown of demographics.
You can use this infographic as a visual view of the world or a specific country or city to display important information about a region.
Suppose your company has completed a survey or study on a particular region and has valuable information and statistics they want to showcase, then this infographic could be helpful.
A company can also use this infographic to show areas they service or locations for an upcoming event.
8. Interactive
If you want to slowly bring readers through a more complex idea or process, then an interactive infographic can help you complete this task.
This infographic is excellent for guiding readers on a journey while providing smaller chunks of data at a time that they can go back and forth between on their own time.
If there are key points in the infographic that readers want to learn about first, they can select those before exploring further.
It is essential to think about the user experience here to ensure they are guided to the call to action on your infographic.
5 Free Infographic Tools
The following are some fantastic tools to make effective infographics with numerous features and customizable templates.
It’s important to find a user-friendly platform that can help you easily create influential infographics, so if you’re interested in using an infographic tool, consider these:
Takeaway
Infographics are a great creative tool for content creation and marketing.
They are a compelling way to tell a story and help your readers retain the key information you want them to for a content piece.
It’s important to take the time to choose the right infographic and focus on each phase of the design process to make sure they’re effective.
Remember to start with the goal of your infographic, and then it’ll be easier to figure out which one is best for the content and the types of graphics and design elements that would be most helpful.
This visual storytelling is one of the best ways to efficiently communicate with your readers.
More Resources:
Featured Image: alexdndz/Shutterstock
!function(f,b,e,v,n,t,s)
{if(f.fbq)return;n=f.fbq=function(){n.callMethod?
n.callMethod.apply(n,arguments):n.queue.push(arguments)};
if(!f._fbq)f._fbq=n;n.push=n;n.loaded=!0;n.version=’2.0′;
n.queue=[];t=b.createElement(e);t.async=!0;
t.src=v;s=b.getElementsByTagName(e)[0];
s.parentNode.insertBefore(t,s)}(window,document,’script’,
‘https://connect.facebook.net/en_US/fbevents.js’);
if( typeof sopp !== “undefined” && sopp === ‘yes’ ){
fbq(‘dataProcessingOptions’, [‘LDU’], 1, 1000);
}else{
fbq(‘dataProcessingOptions’, []);
}
fbq(‘init’, ‘1321385257908563’);
fbq(‘track’, ‘PageView’);
fbq(‘trackSingle’, ‘1321385257908563’, ‘ViewContent’, {
content_name: ‘5-unbeatable-types-of-infographic-free-tools-to-create-them’,
content_category: ‘creation digital-marketing-tools’
});
SEO
How To Use ChatGPT For Keyword Research

Anyone not using ChatGPT for keyword research is missing a trick.
You can save time and understand an entire topic in seconds instead of hours.
In this article, I outline my most effective ChatGPT prompts for keyword research and teach you how I put them together so that you, too, can take, edit, and enhance them even further.
But before we jump into the prompts, I want to emphasize that you shouldn’t replace keyword research tools or disregard traditional keyword research methods.
ChatGPT can make mistakes. It can even create new keywords if you give it the right prompt. For example, I asked it to provide me with a unique keyword for the topic “SEO” that had never been searched before.
“Interstellar Internet SEO: Optimizing content for the theoretical concept of an interstellar internet, considering the challenges of space-time and interplanetary communication delays.”
Although I want to jump into my LinkedIn profile and update my title to “Interstellar Internet SEO Consultant,” unfortunately, no one has searched that (and they probably never will)!
You must not blindly rely on the data you get back from ChatGPT.
What you can rely on ChatGPT for is the topic ideation stage of keyword research and inspiration.
ChatGPT is a large language model trained with massive amounts of data to accurately predict what word will come next in a sentence. However, it does not know how to do keyword research yet.
Instead, think of ChatGPT as having an expert on any topic armed with the information if you ask it the right question.
In this guide, that is exactly what I aim to teach you how to do – the most essential prompts you need to know when performing topical keyword research.
Best ChatGPT Keyword Research Prompts
The following ChatGPT keyword research prompts can be used on any niche, even a topic to which you are brand new.
For this demonstration, let’s use the topic of “SEO” to demonstrate these prompts.
Generating Keyword Ideas Based On A Topic
What Are The {X} Most Popular Sub-topics Related To {Topic}?
The first prompt is to give you an idea of the niche.
As shown above, ChatGPT did a great job understanding and breaking down SEO into three pillars: on-page, off-page & technical.
The key to the following prompt is to take one of the topics ChatGPT has given and query the sub-topics.
What Are The {X} Most Popular Sub-topics Related To {Sub-topic}?
For this example, let’s query, “What are the most popular sub-topics related to keyword research?”
Having done keyword research for over 10 years, I would expect it to output information related to keyword research metrics, the types of keywords, and intent.
Let’s see.
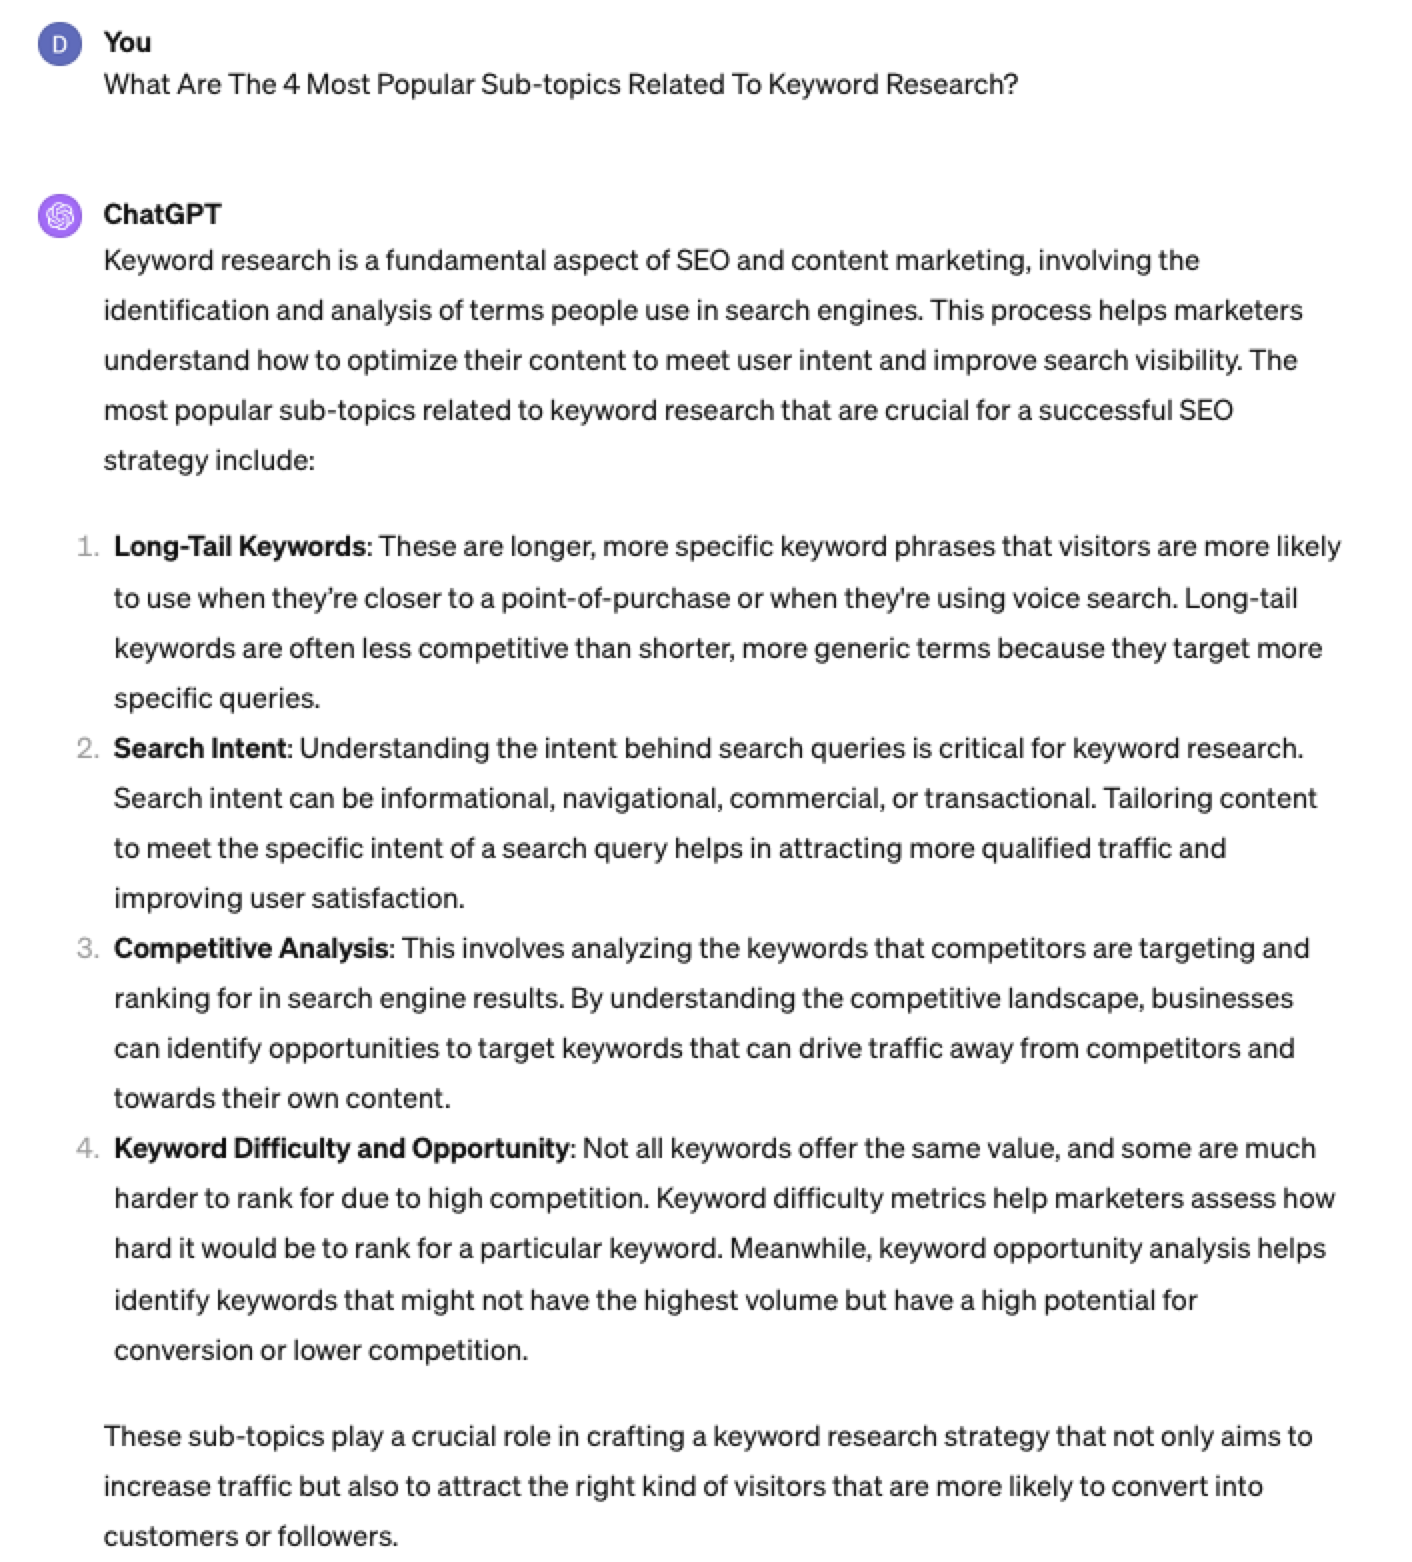 Screenshot from ChatGPT 4, April 2024
Again, right on the money.
To get the keywords you want without having ChatGPT describe each answer, use the prompt “list without description.”
Here is an example of that.
List Without Description The Top {X} Most Popular Keywords For The Topic Of {X}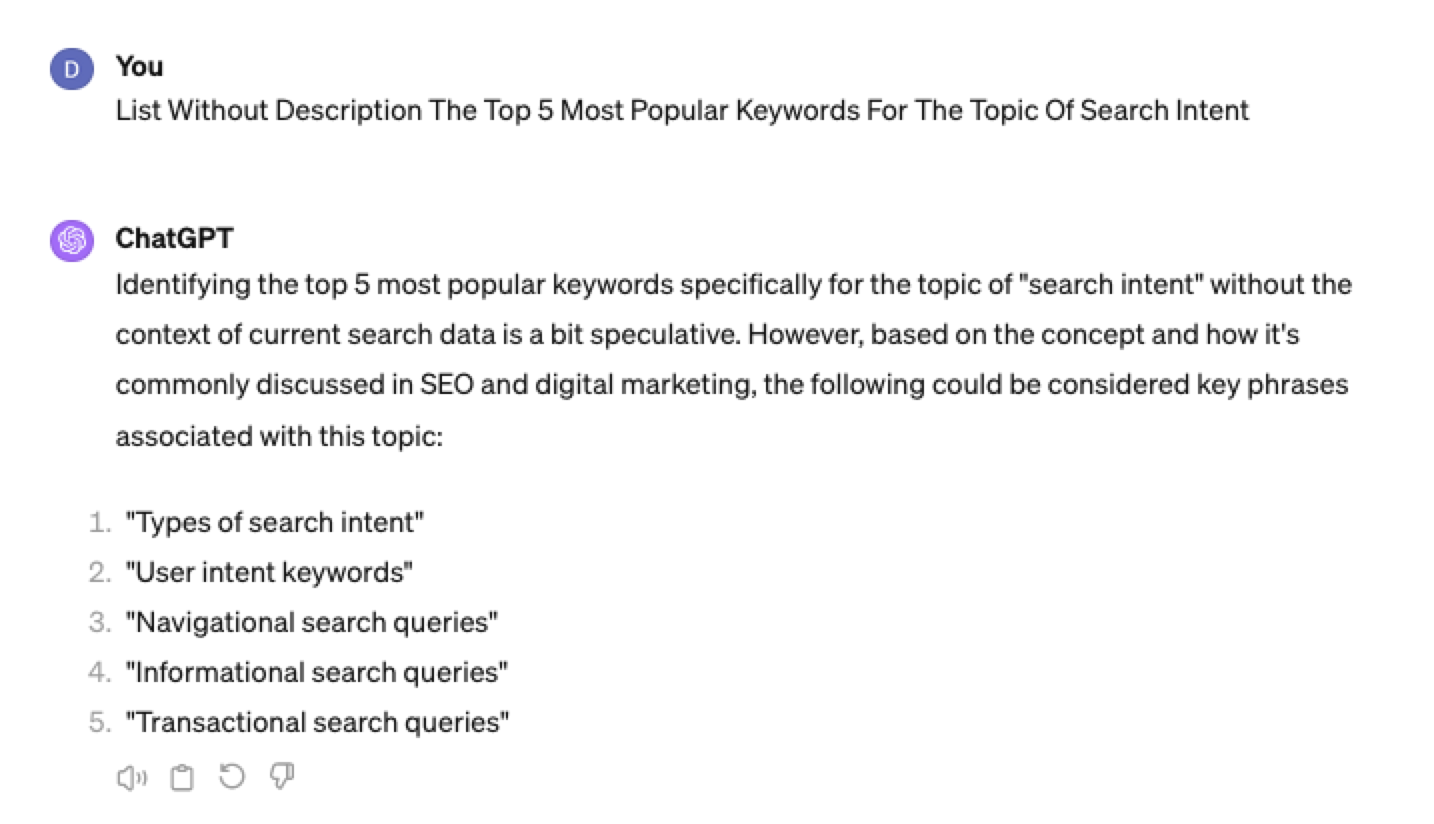
You can even branch these keywords out further into their long-tail.
Example prompt:
List Without Description The Top {X} Most Popular Long-tail Keywords For The Topic “{X}”
 Screenshot ChatGPT 4,April 2024
List Without Description The Top Semantically Related Keywords And Entities For The Topic {X}
You can even ask ChatGPT what any topic’s semantically related keywords and entities are!
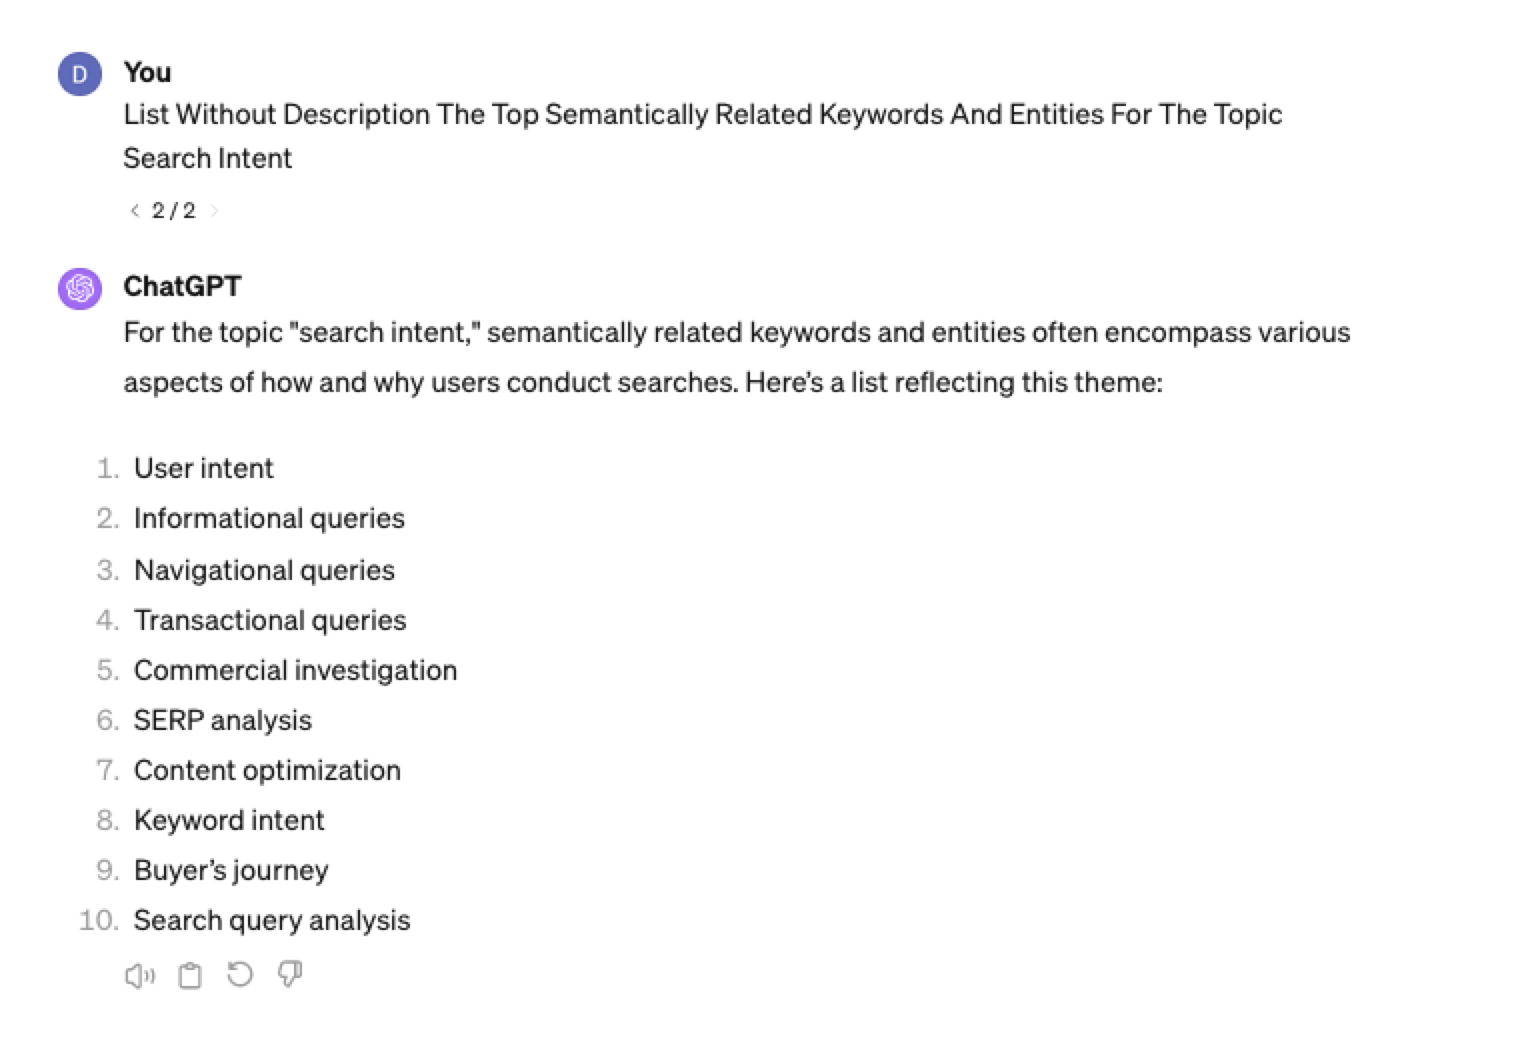 Screenshot ChatGPT 4, April 2024
Tip: The Onion Method Of Prompting ChatGPT
When you are happy with a series of prompts, add them all to one prompt. For example, so far in this article, we have asked ChatGPT the following:
- What are the four most popular sub-topics related to SEO?
- What are the four most popular sub-topics related to keyword research
- List without description the top five most popular keywords for “keyword intent”?
- List without description the top five most popular long-tail keywords for the topic “keyword intent types”?
- List without description the top semantically related keywords and entities for the topic “types of keyword intent in SEO.”
Combine all five into one prompt by telling ChatGPT to perform a series of steps. Example:
“Perform the following steps in a consecutive order Step 1, Step 2, Step 3, Step 4, and Step 5”
Example:
“Perform the following steps in a consecutive order Step 1, Step 2, Step 3, Step 4 and Step 5. Step 1 – Generate an answer for the 3 most popular sub-topics related to {Topic}?. Step 2 – Generate 3 of the most popular sub-topics related to each answer. Step 3 – Take those answers and list without description their top 3 most popular keywords. Step 4 – For the answers given of their most popular keywords, provide 3 long-tail keywords. Step 5 – for each long-tail keyword offered in the response, a list without descriptions 3 of their top semantically related keywords and entities.”
Generating Keyword Ideas Based On A Question
Taking the steps approach from above, we can get ChatGPT to help streamline getting keyword ideas based on a question. For example, let’s ask, “What is SEO?”
“Perform the following steps in a consecutive order Step 1, Step 2, Step 3, and Step 4. Step 1 Generate 10 questions about “{Question}”?. Step 2 – Generate 5 more questions about “{Question}” that do not repeat the above. Step 3 – Generate 5 more questions about “{Question}” that do not repeat the above. Step 4 – Based on the above Steps 1,2,3 suggest a final list of questions avoiding duplicates or semantically similar questions.”
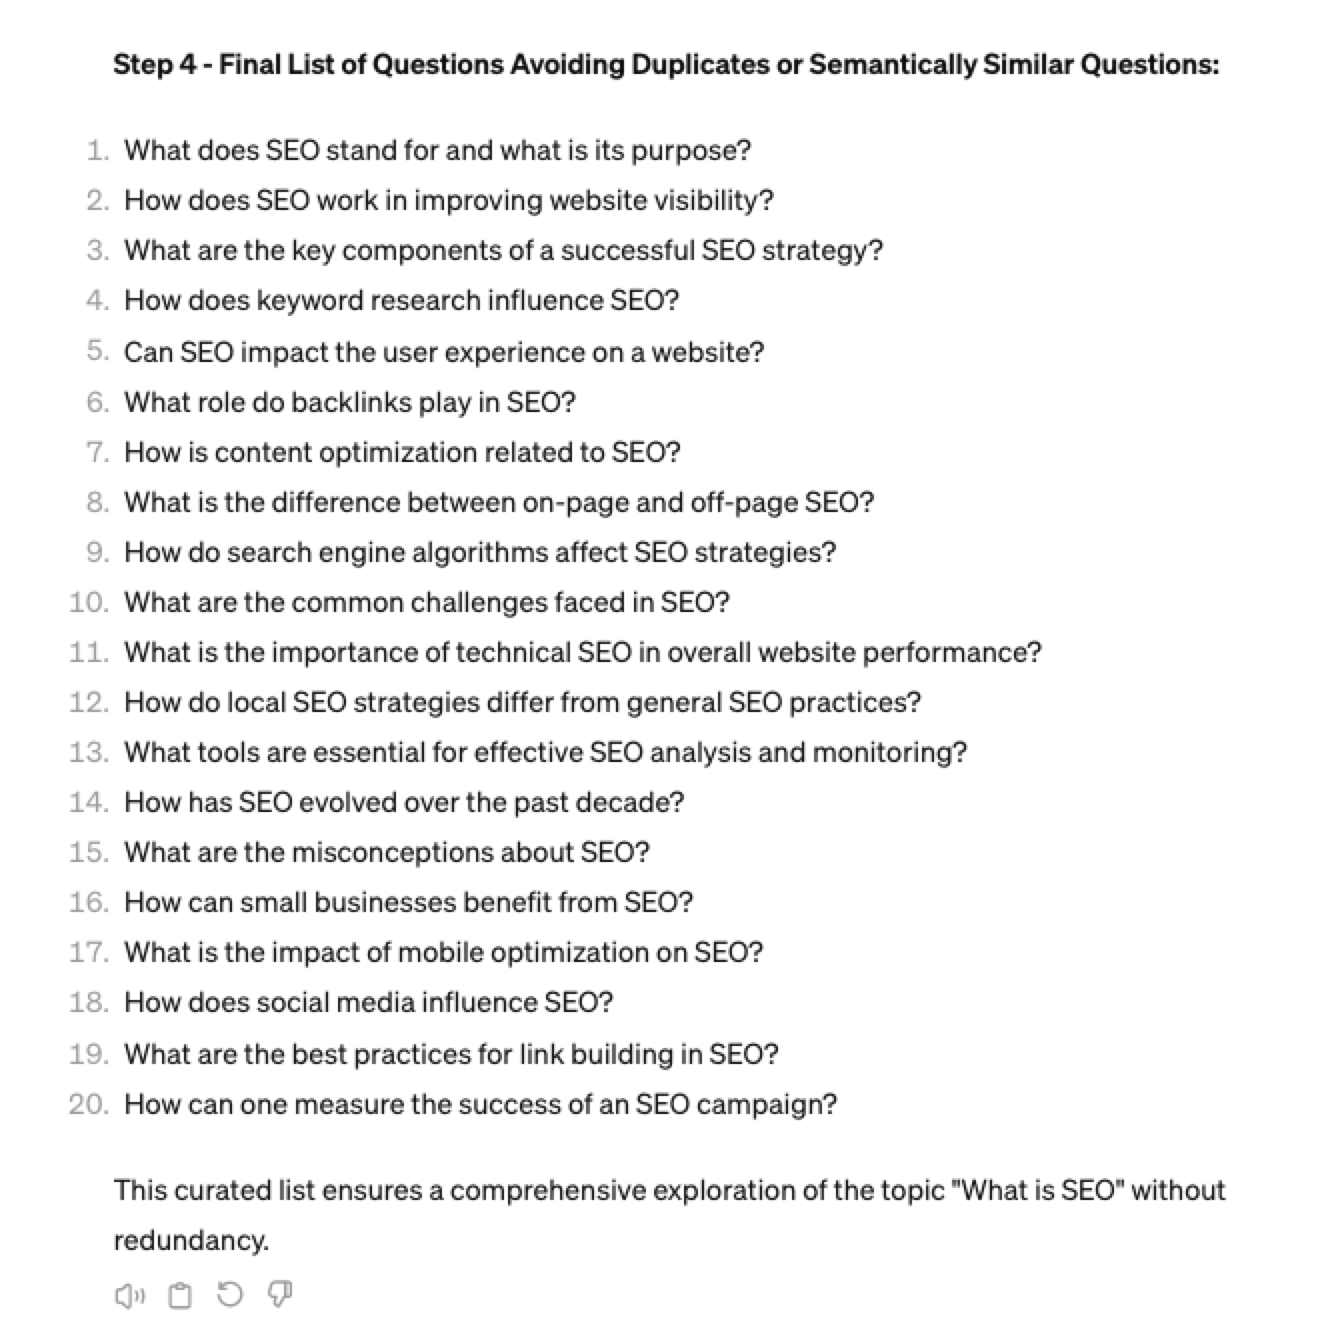 Screenshot ChatGPT 4, April 2024
Generating Keyword Ideas Using ChatGPT Based On The Alphabet Soup Method
One of my favorite methods, manually, without even using a keyword research tool, is to generate keyword research ideas from Google autocomplete, going from A to Z.
-
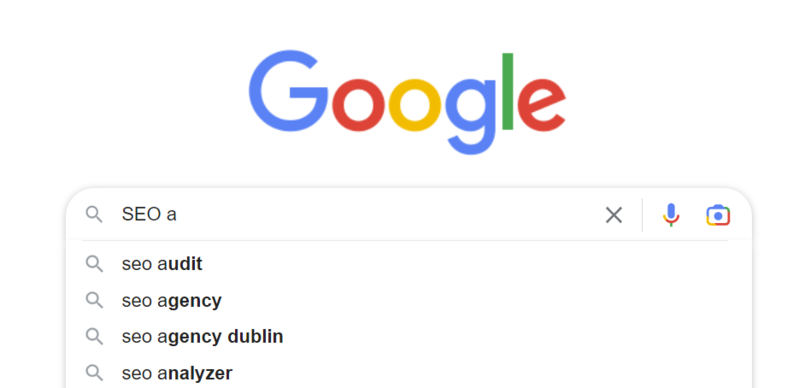 Screenshot from Google autocomplete, April 2024
You can also do this using ChatGPT.
Example prompt:
“give me popular keywords that includes the keyword “SEO”, and the next letter of the word starts with a”
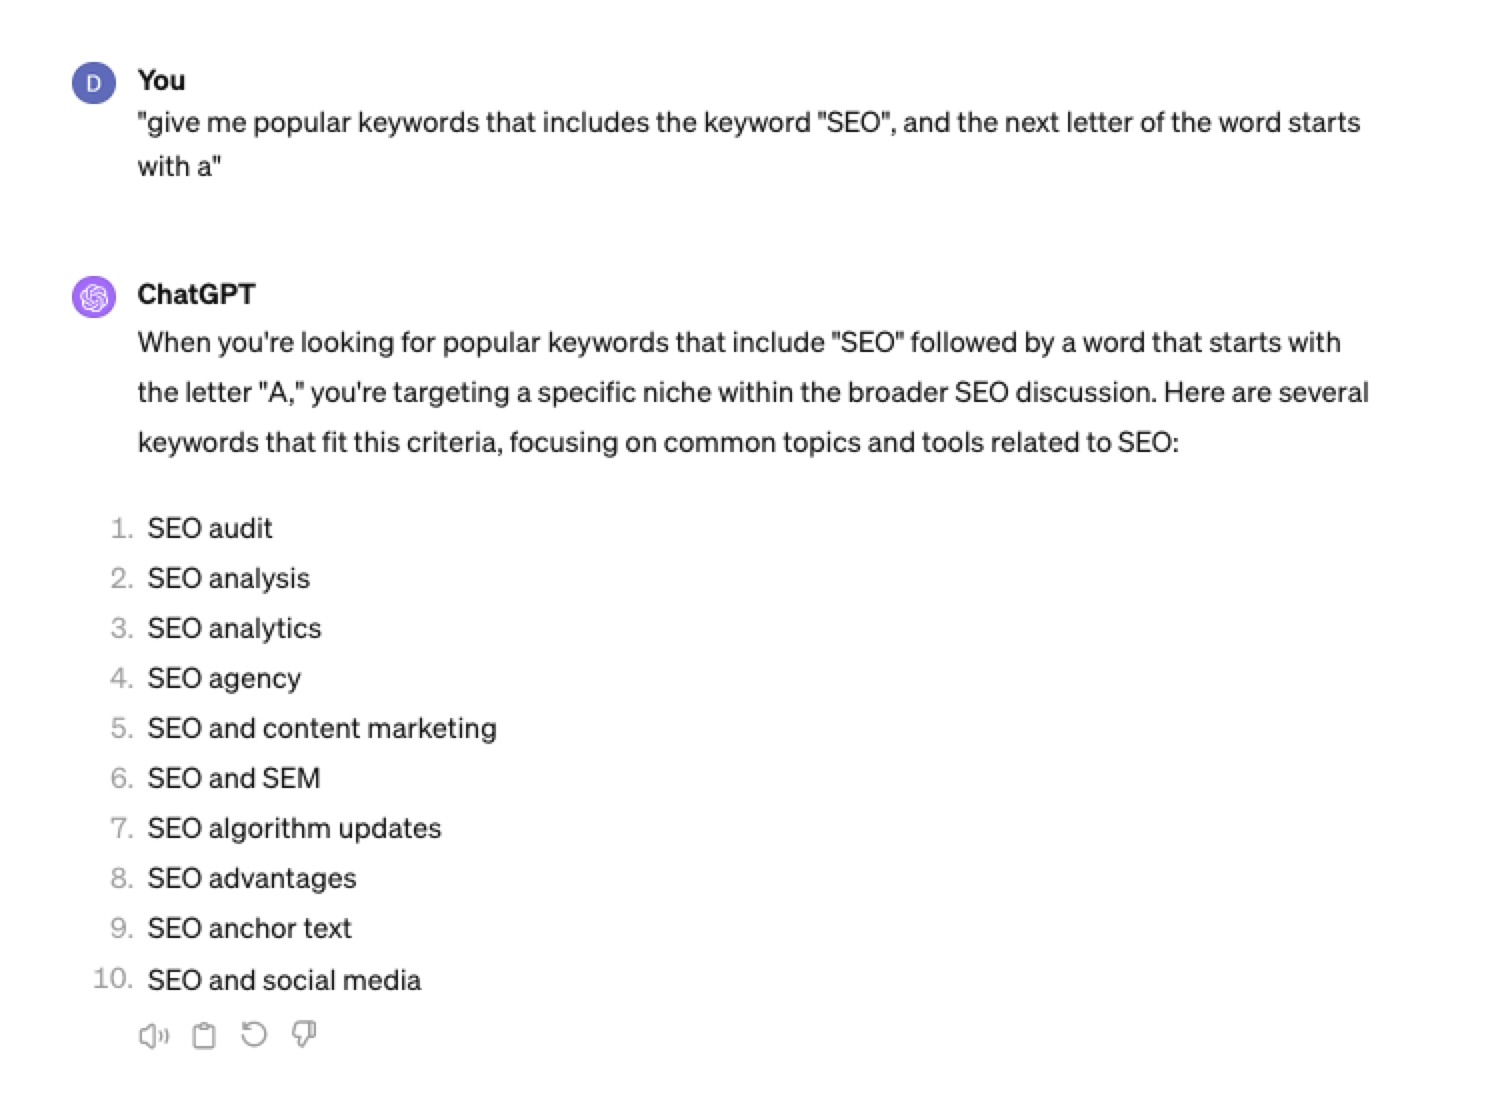 Screenshot from ChatGPT 4, April 2024
Tip: Using the onion prompting method above, we can combine all this in one prompt.
“Give me five popular keywords that include “SEO” in the word, and the following letter starts with a. Once the answer has been done, move on to giving five more popular keywords that include “SEO” for each letter of the alphabet b to z.”
Generating Keyword Ideas Based On User Personas
When it comes to keyword research, understanding user personas is essential for understanding your target audience and keeping your keyword research focused and targeted. ChatGPT may help you get an initial understanding of customer personas.
Example prompt:
“For the topic of “{Topic}” list 10 keywords each for the different types of user personas”
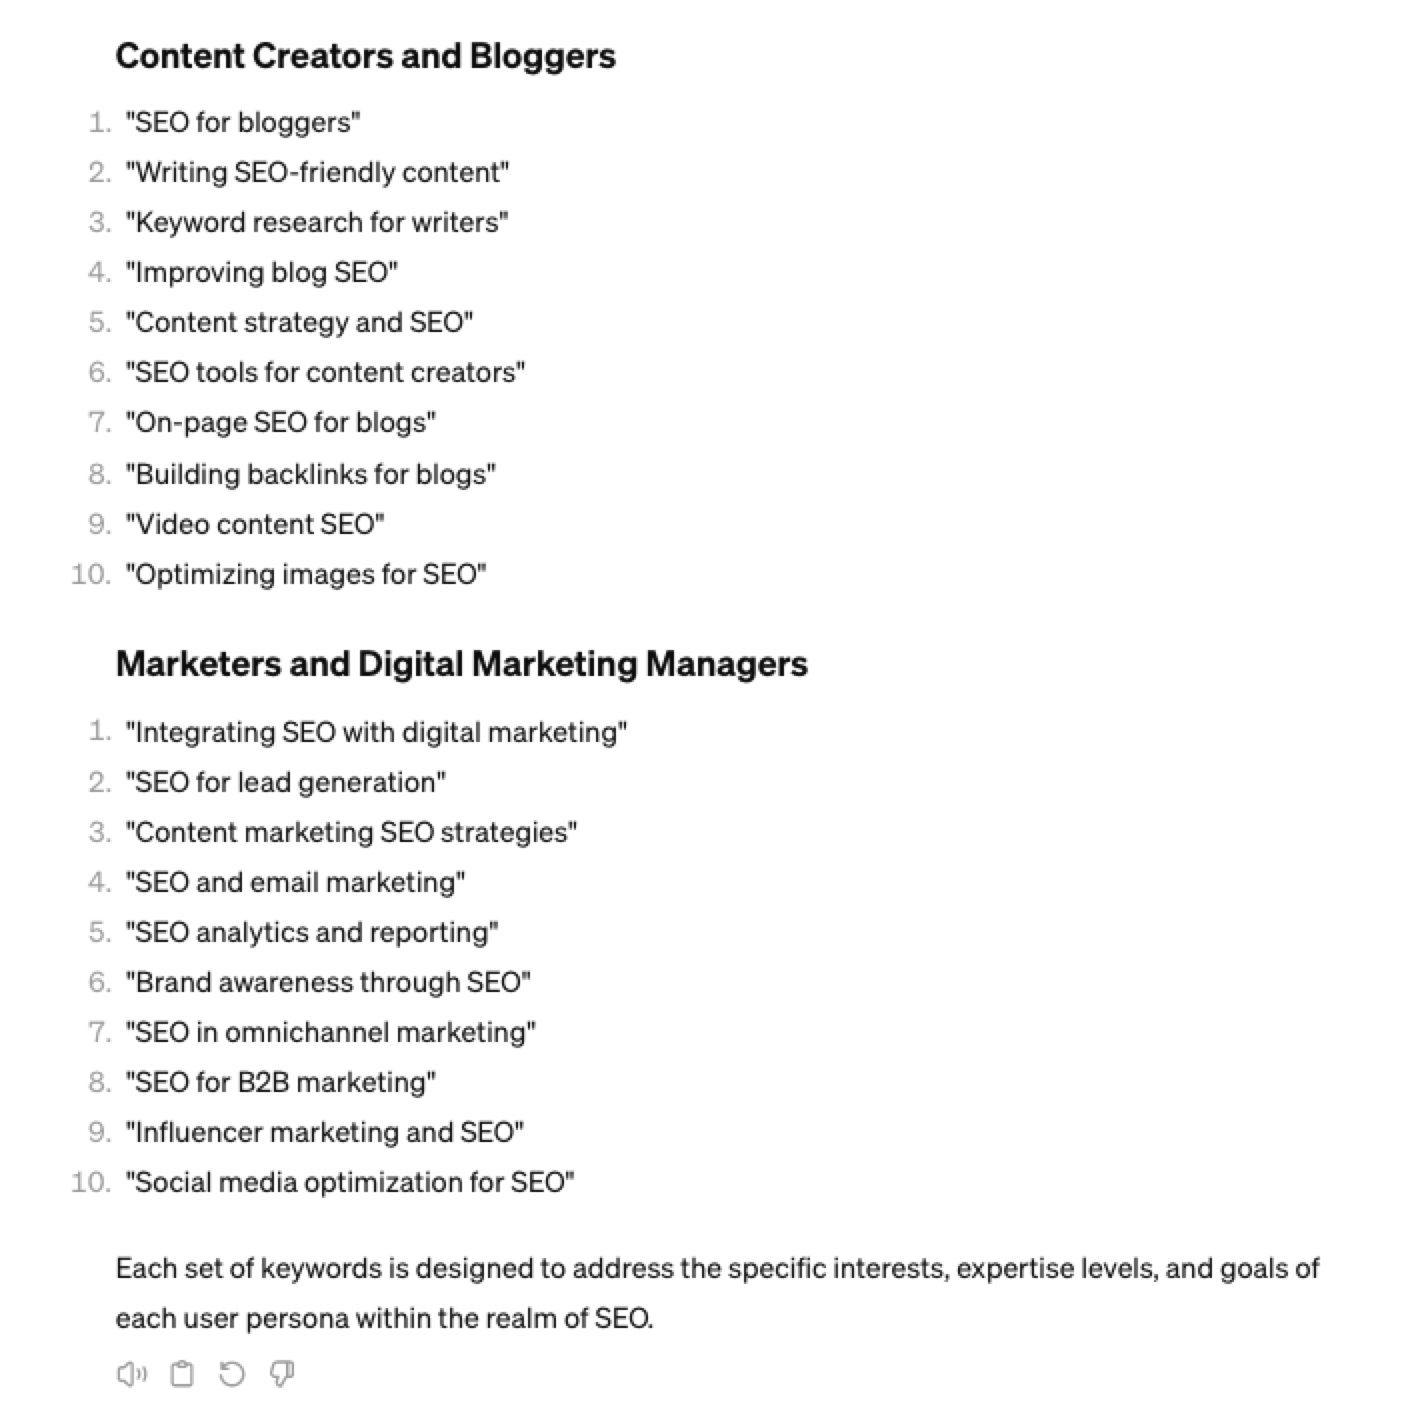 Screenshot from ChatGPT 4, April 2024
You could even go a step further and ask for questions based on those topics that those specific user personas may be searching for:
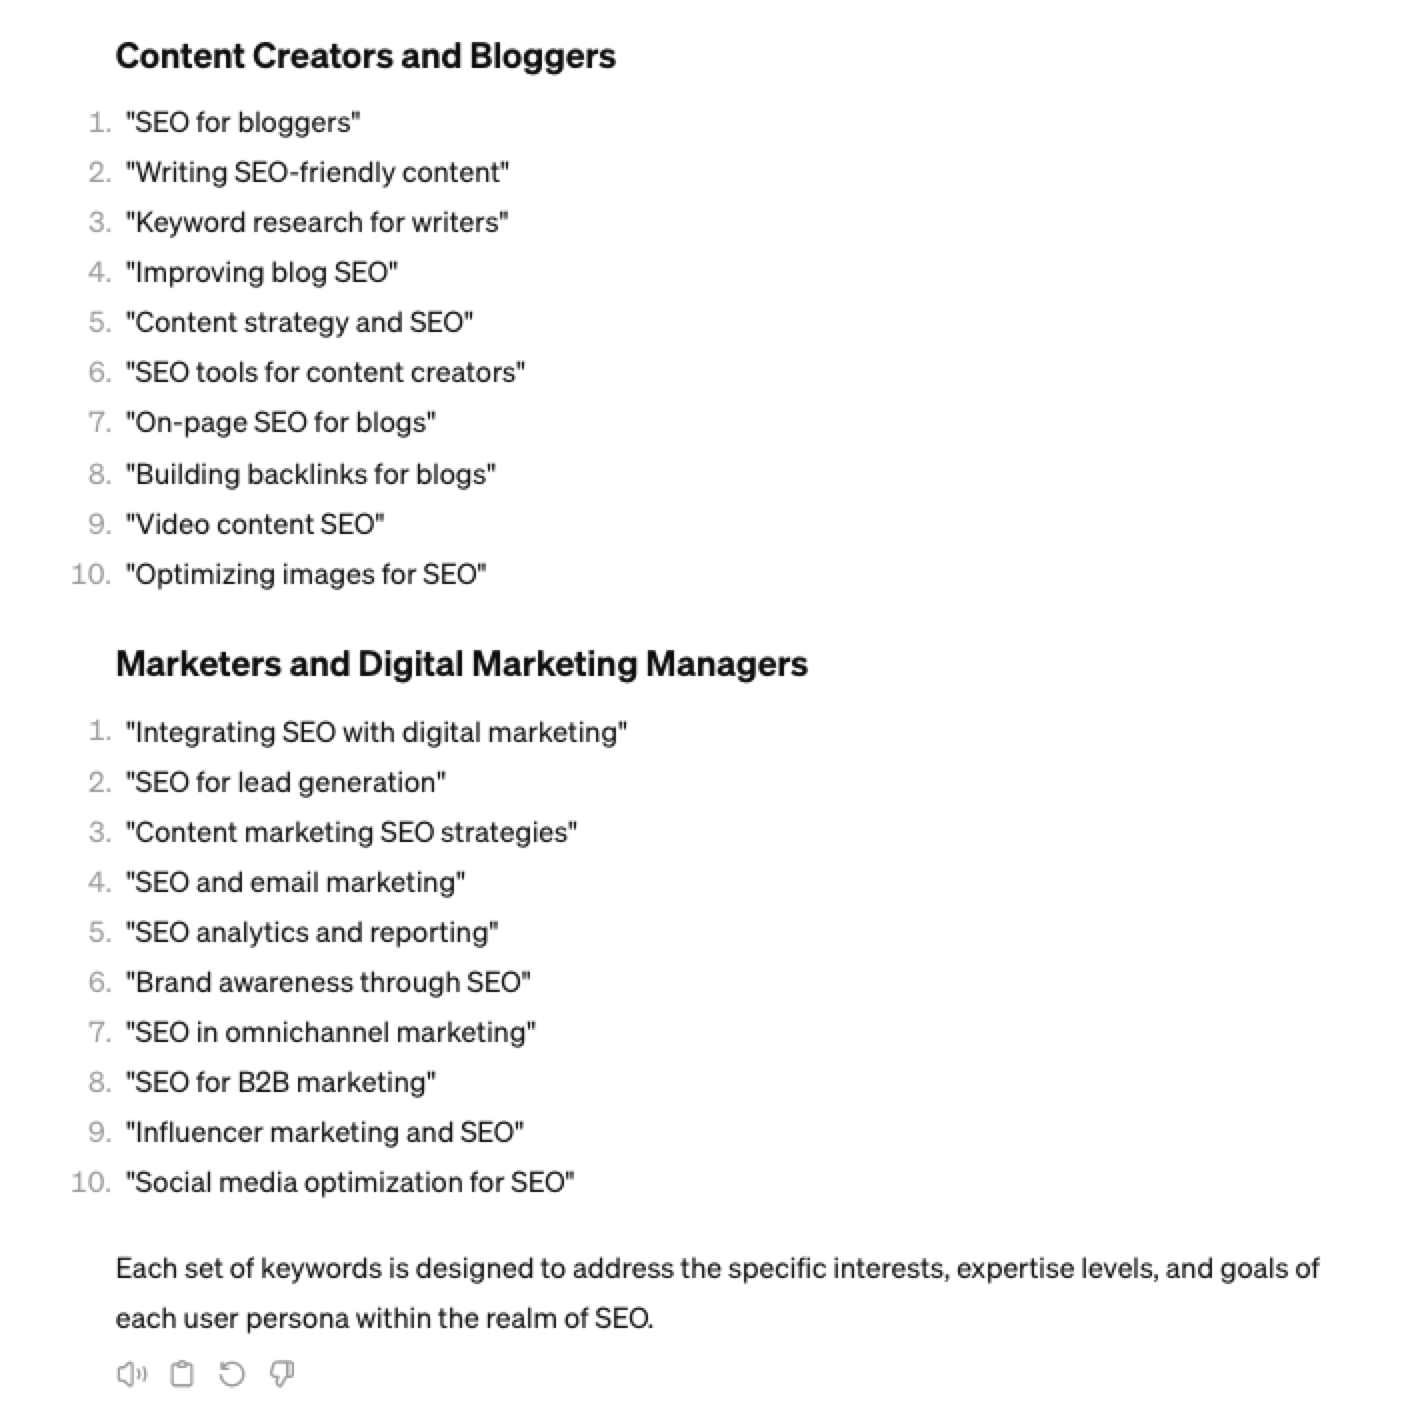 Screenshot ChatGPT 4, April 2024
As well as get the keywords to target based on those questions:
“For each question listed above for each persona, list the keywords, as well as the long-tail keywords to target, and put them in a table”
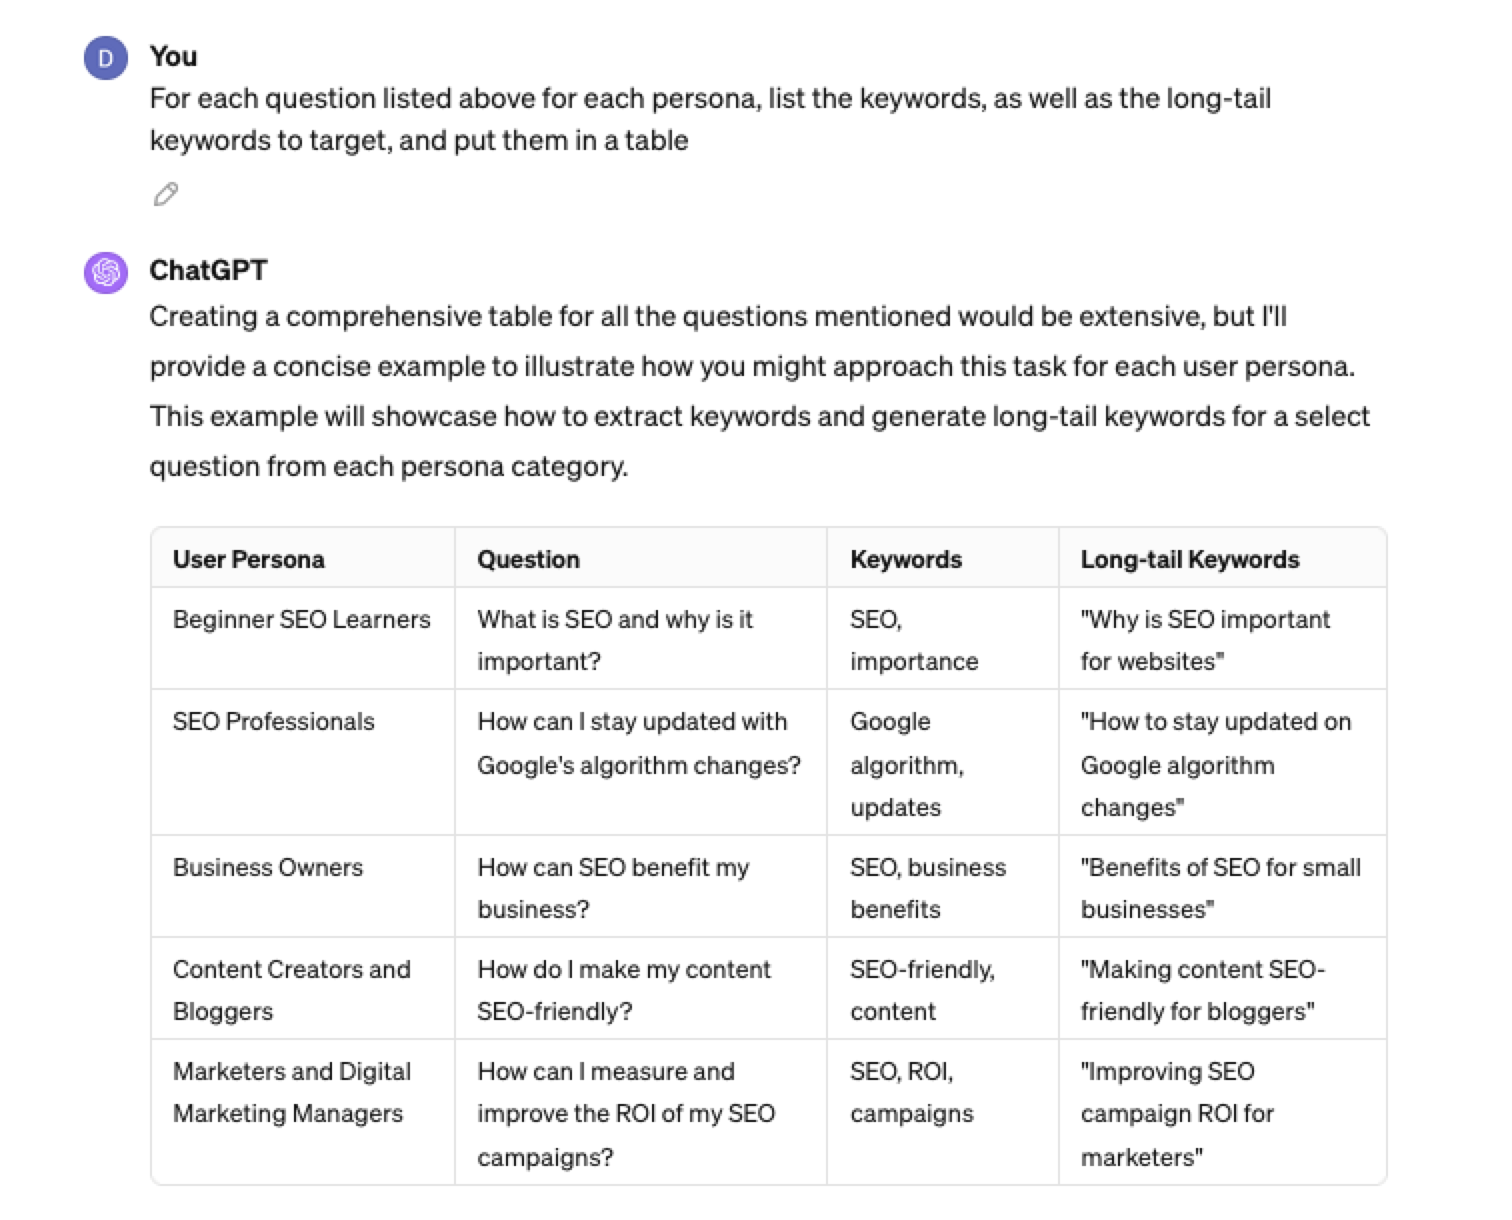 Screenshot from ChatGPT 4, April 2024
Generating Keyword Ideas Using ChatGPT Based On Searcher Intent And User Personas
Understanding the keywords your target persona may be searching is the first step to effective keyword research. The next step is to understand the search intent behind those keywords and which content format may work best.
For example, a business owner who is new to SEO or has just heard about it may be searching for “what is SEO.”
However, if they are further down the funnel and in the navigational stage, they may search for “top SEO firms.”
You can query ChatGPT to inspire you here based on any topic and your target user persona.
SEO Example:
“For the topic of “{Topic}” list 10 keywords each for the different types of searcher intent that a {Target Persona} would be searching for”
ChatGPT For Keyword Research Admin
Here is how you can best use ChatGPT for keyword research admin tasks.
Using ChatGPT As A Keyword Categorization Tool
One of the use cases for using ChatGPT is for keyword categorization.
In the past, I would have had to devise spreadsheet formulas to categorize keywords or even spend hours filtering and manually categorizing keywords.
ChatGPT can be a great companion for running a short version of this for you.
Let’s say you have done keyword research in a keyword research tool, have a list of keywords, and want to categorize them.
You could use the following prompt:
“Filter the below list of keywords into categories, target persona, searcher intent, search volume and add information to a six-column table: List of keywords – [LIST OF KEYWORDS], Keyword Search Volume [SEARCH VOLUMES] and Keyword Difficulties [KEYWORD DIFFICUTIES].”
-
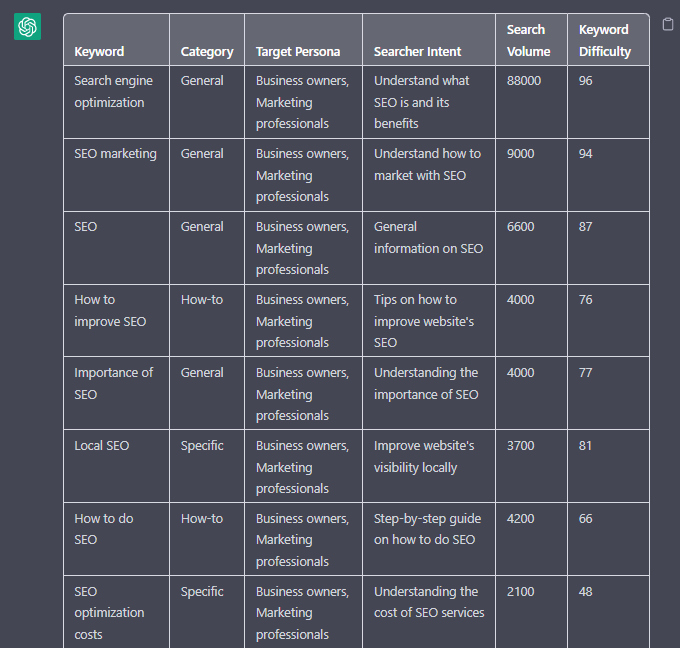 Screenshot from ChatGPT, April 2024
Tip: Add keyword metrics from the keyword research tools, as using the search volumes that a ChatGPT prompt may give you will be wildly inaccurate at best.
Using ChatGPT For Keyword Clustering
Another of ChatGPT’s use cases for keyword research is to help you cluster. Many keywords have the same intent, and by grouping related keywords, you may find that one piece of content can often target multiple keywords at once.
However, be careful not to rely only on LLM data for clustering. What ChatGPT may cluster as a similar keyword, the SERP or the user may not agree with. But it is a good starting point.
The big downside of using ChatGPT for keyword clustering is actually the amount of keyword data you can cluster based on the memory limits.
So, you may find a keyword clustering tool or script that is better for large keyword clustering tasks. But for small amounts of keywords, ChatGPT is actually quite good.
A great use small keyword clustering use case using ChatGPT is for grouping People Also Ask (PAA) questions.
Use the following prompt to group keywords based on their semantic relationships. For example:
“Organize the following keywords into groups based on their semantic relationships, and give a short name to each group: [LIST OF PAA], create a two-column table where each keyword sits on its own row.
-
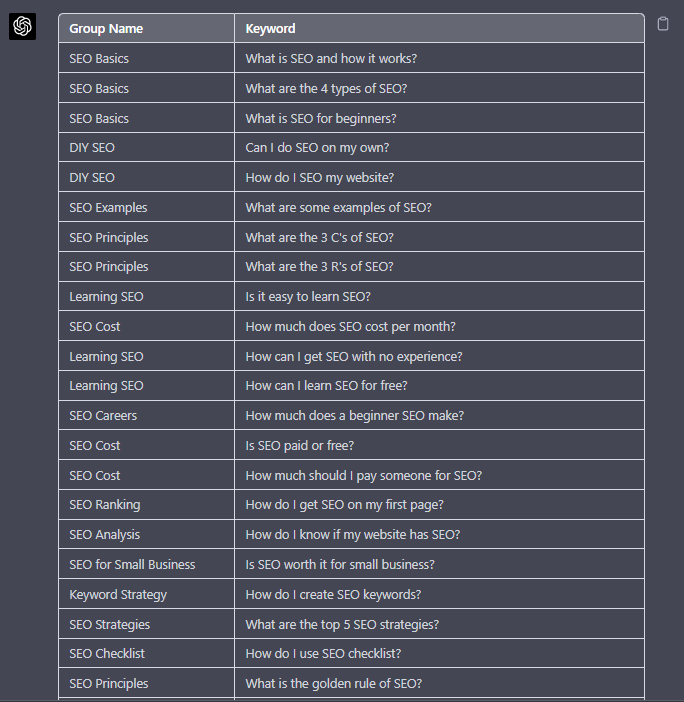 Screenshot from ChatGPT, April 2024
Using Chat GPT For Keyword Expansion By Patterns
One of my favorite methods of doing keyword research is pattern spotting.
Most seed keywords have a variable that can expand your target keywords.
Here are a few examples of patterns:
1. Question Patterns
(who, what, where, why, how, are, can, do, does, will)
“Generate [X] keywords for the topic “[Topic]” that contain any or all of the following “who, what, where, why, how, are, can, do, does, will”
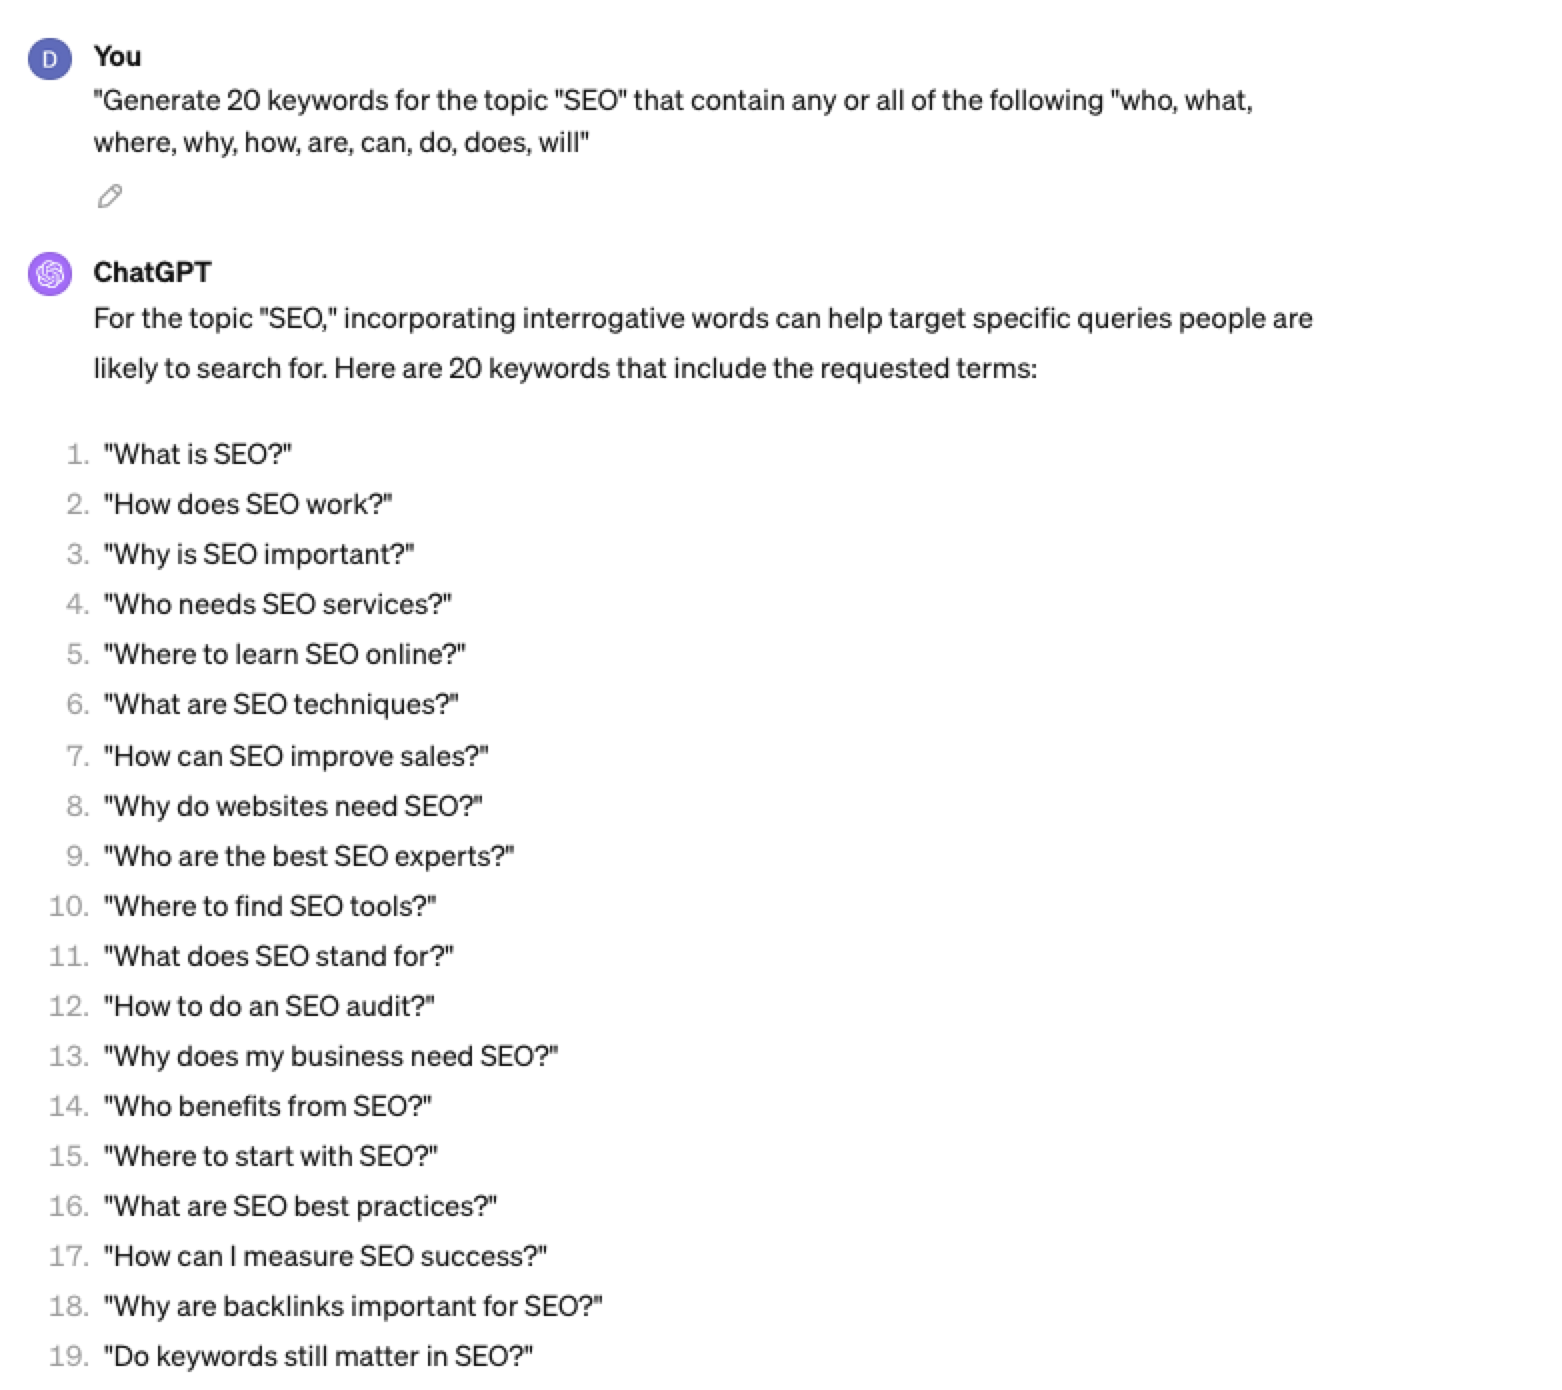 Screenshot ChatGPT 4, April 2024
2. Comparison Patterns
Example:
“Generate 50 keywords for the topic “{Topic}” that contain any or all of the following “for, vs, alternative, best, top, review”
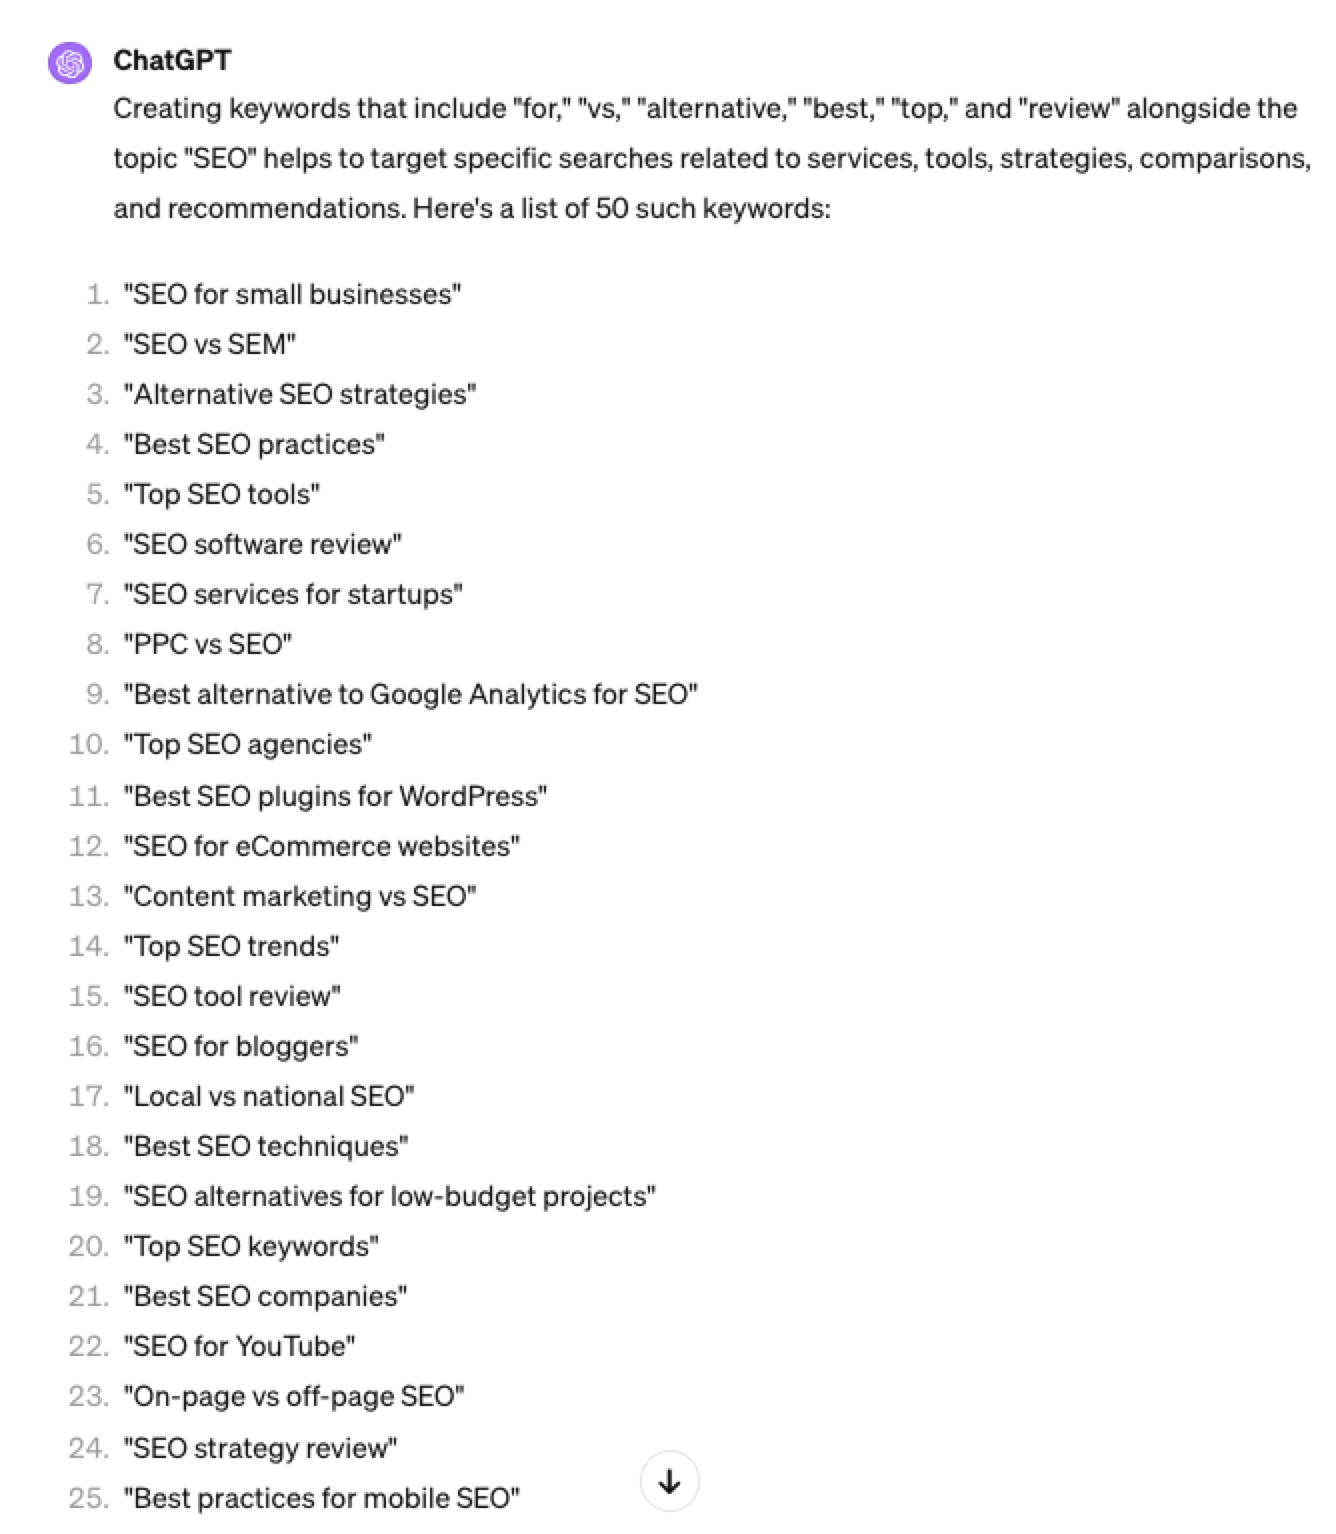 Screenshot ChatGPT 4, April 2024
3. Brand Patterns
Another one of my favorite modifiers is a keyword by brand.
We are probably all familiar with the most popular SEO brands; however, if you aren’t, you could ask your AI friend to do the heavy lifting.
Example prompt:
“For the top {Topic} brands what are the top “vs” keywords”
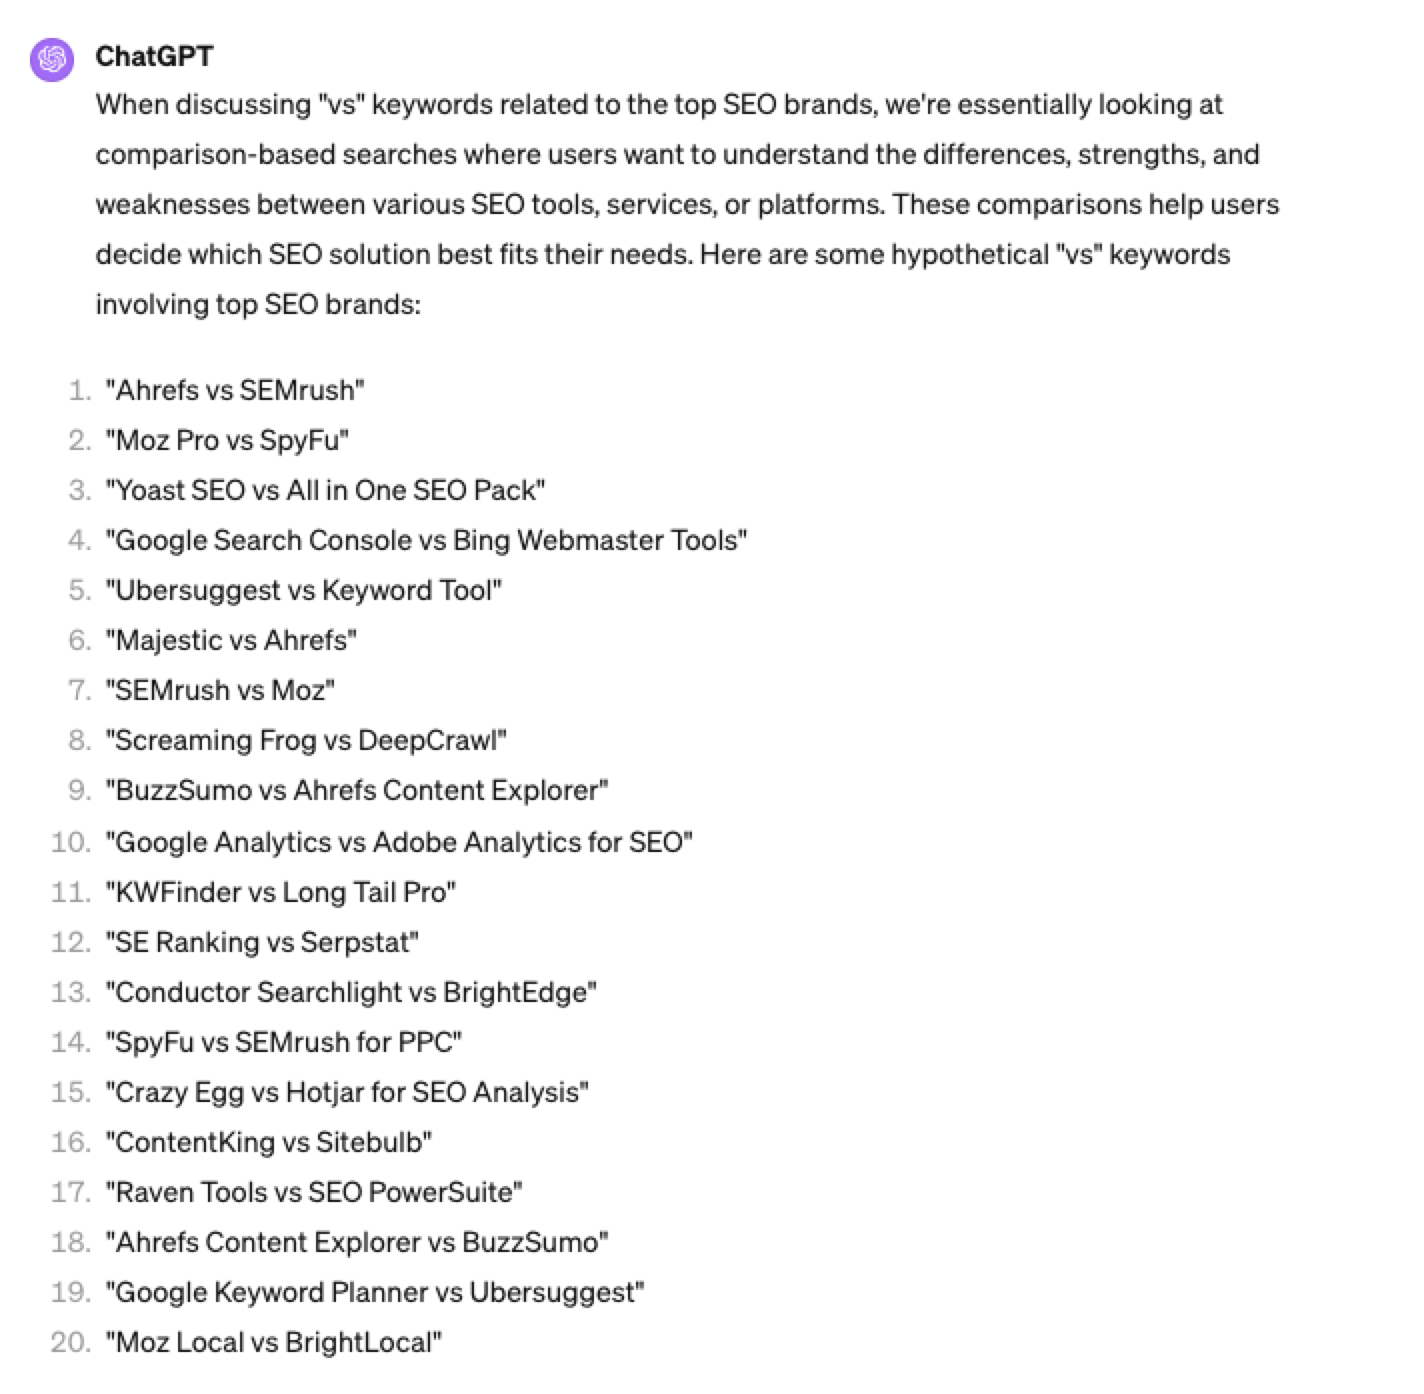 Screenshot ChatGPT 4, April 2024
4. Search Intent Patterns
One of the most common search intent patterns is “best.”
When someone is searching for a “best {topic}” keyword, they are generally searching for a comprehensive list or guide that highlights the top options, products, or services within that specific topic, along with their features, benefits, and potential drawbacks, to make an informed decision.
Example:
“For the topic of “[Topic]” what are the 20 top keywords that include “best”
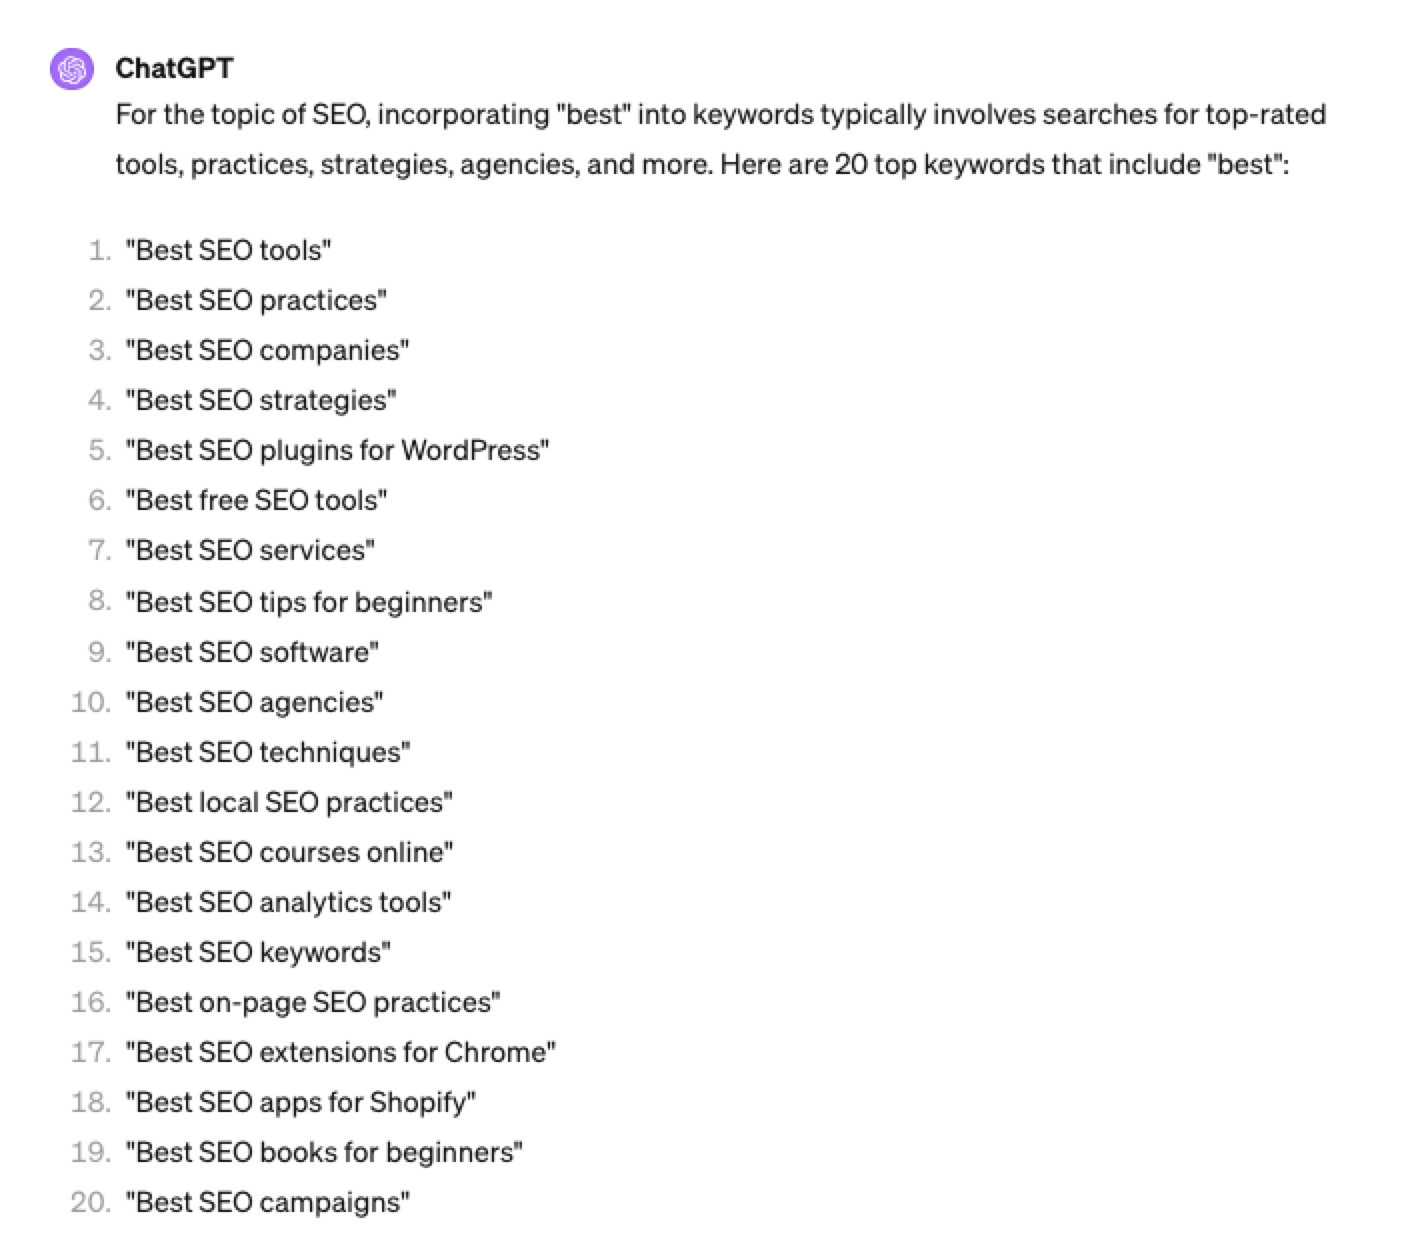 Screenshot ChatGPT 4, April 2024
Again, this guide to keyword research using ChatGPT has emphasized the ease of generating keyword research ideas by utilizing ChatGPT throughout the process.
Keyword Research Using ChatGPT Vs. Keyword Research Tools
Free Vs. Paid Keyword Research Tools
Like keyword research tools, ChatGPT has free and paid options.
However, one of the most significant drawbacks of using ChatGPT for keyword research alone is the absence of SEO metrics to help you make smarter decisions.
To improve accuracy, you could take the results it gives you and verify them with your classic keyword research tool – or vice versa, as shown above, uploading accurate data into the tool and then prompting.
However, you must consider how long it takes to type and fine-tune your prompt to get your desired data versus using the filters within popular keyword research tools.
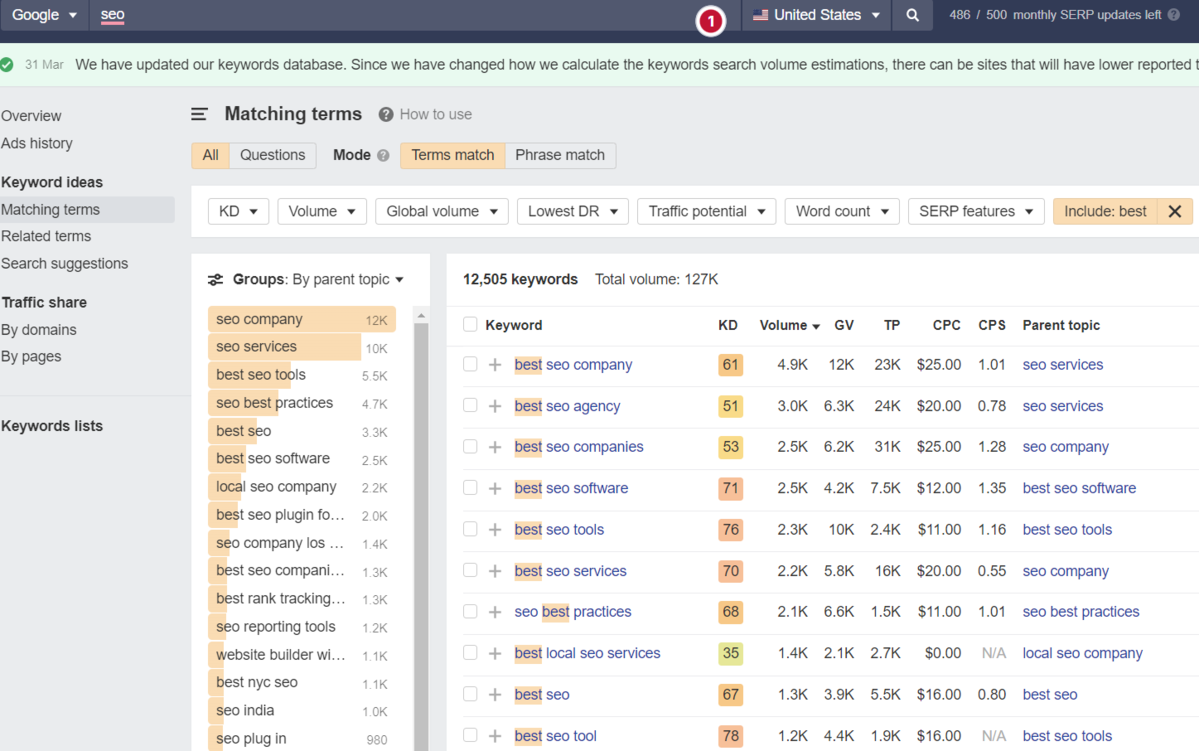
For example, if we use a popular keyword research tool using filters, you could have all of the “best” queries with all of their SEO metrics:
-
 Screenshot from Ahrefs Keyword Explorer, March 2024
And unlike ChatGPT, generally, there is no token limit; you can extract several hundred, if not thousands, of keywords at a time.
As I have mentioned multiple times throughout this piece, you cannot blindly trust the data or SEO metrics it may attempt to provide you with.
The key is to validate the keyword research with a keyword research tool.
ChatGPT For International SEO Keyword Research
ChatGPT can be a terrific multilingual keyword research assistant.
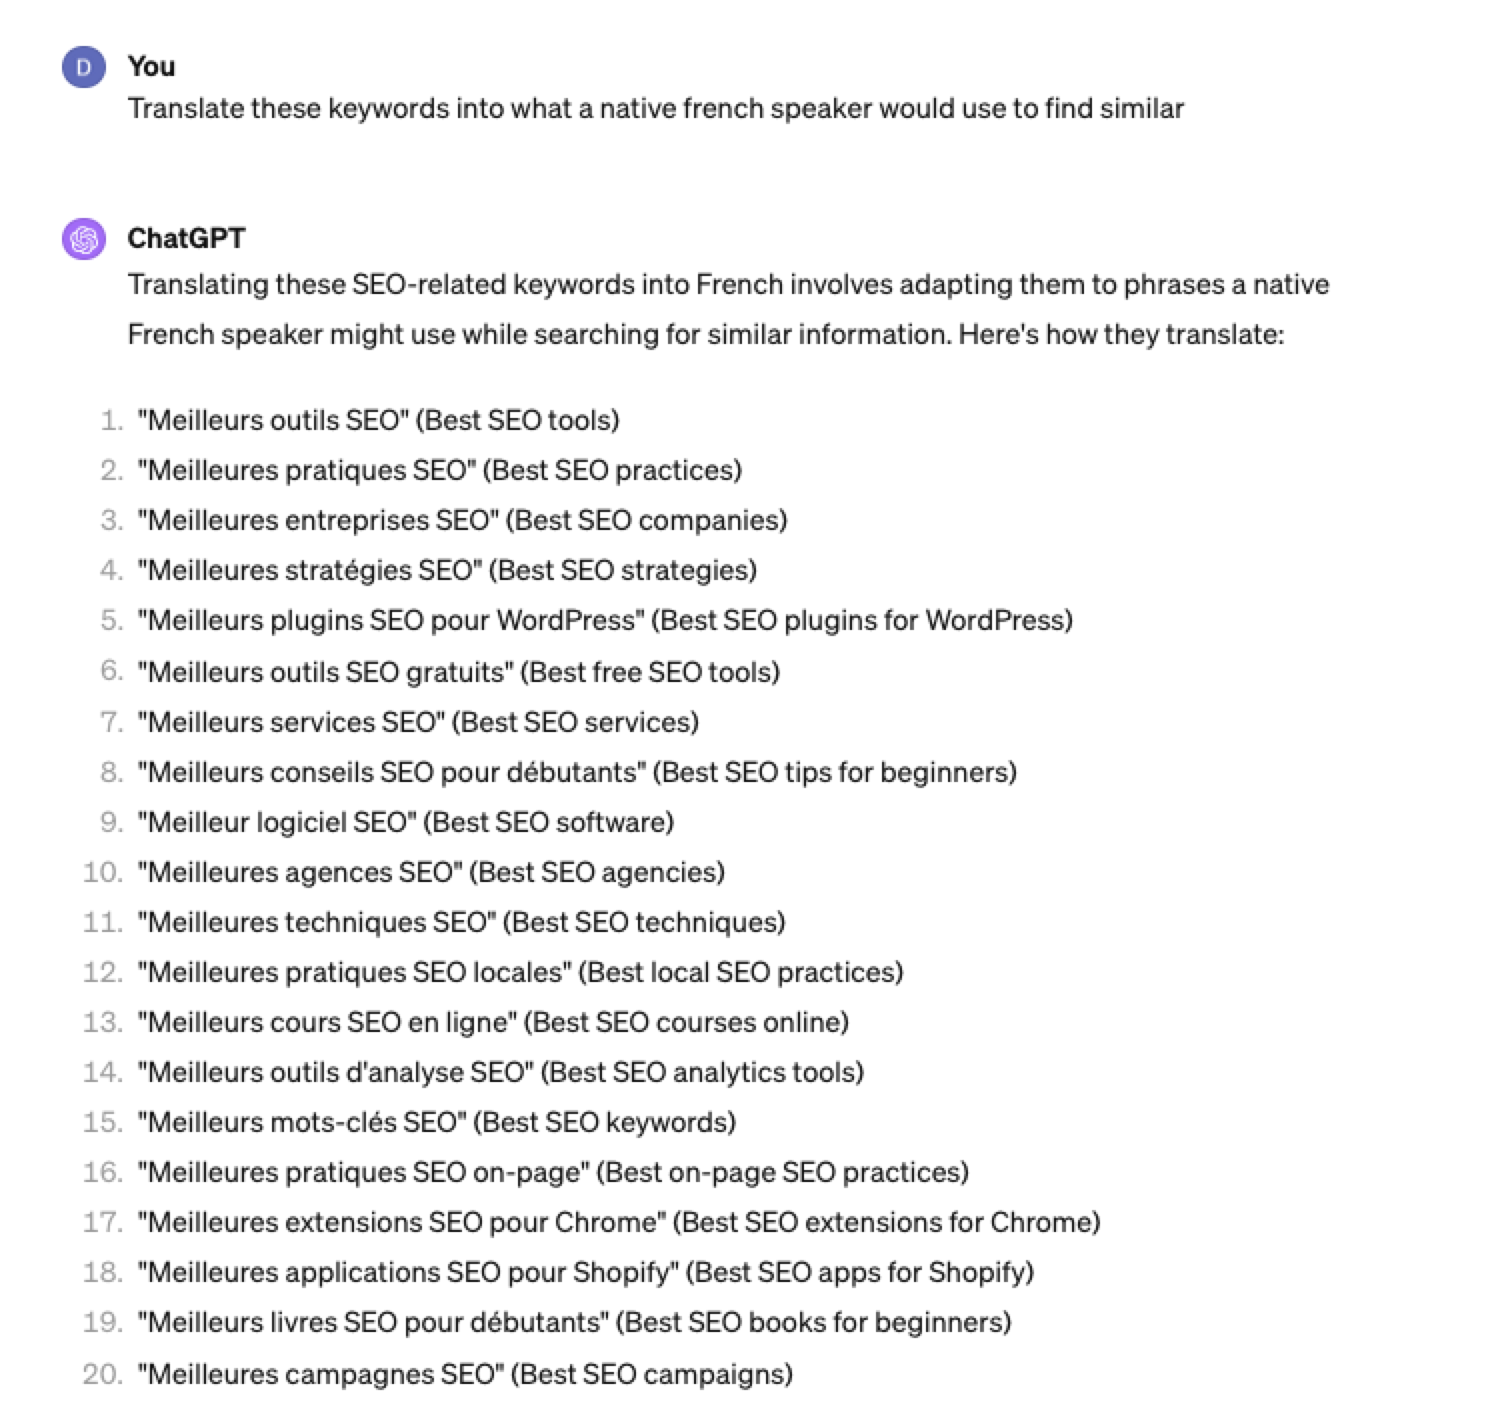
For example, if you wanted to research keywords in a foreign language such as French. You could ask ChatGPT to translate your English keywords;
 Screenshot ChatGPT 4, Apil 2024
- The key is to take the data above and paste it into a popular keyword research tool to verify.
- As you can see below, many of the keyword translations for the English keywords do not have any search volume for direct translations in French.
 Screenshot from Ahrefs Keyword Explorer, April 2024
But don’t worry, there is a workaround: If you have access to a competitor keyword research tool, you can see what webpage is ranking for that query – and then identify the top keyword for that page based on the ChatGPT translated keywords that do have search volume.
-
-
 Screenshot from Ahrefs Keyword Explorer, April 2024
Or, if you don’t have access to a paid keyword research tool, you could always take the top-performing result, extract the page copy, and then ask ChatGPT what the primary keyword for the page is.
Key Takeaway
-
ChatGPT can be an expert on any topic and an invaluable keyword research tool. However, it is another tool to add to your toolbox when doing keyword research; it does not replace traditional keyword research tools.
As shown throughout this tutorial, from making up keywords at the beginning to inaccuracies around data and translations, ChatGPT can make mistakes when used for keyword research.
You cannot blindly trust the data you get back from ChatGPT.
However, it can offer a shortcut to understanding any topic for which you need to do keyword research and, as a result, save you countless hours.
But the key is how you prompt.
The prompts I shared with you above will help you understand a topic in minutes instead of hours and allow you to better seed keywords using keyword research tools.
It can even replace mundane keyword clustering tasks that you used to do with formulas in spreadsheets or generate ideas based on keywords you give it.
Paired with traditional keyword research tools, ChatGPT for keyword research can be a powerful tool in your arsenal.
More resources:
Featured Image: Tatiana Shepeleva/Shutterstock
SEO
OpenAI Expected to Integrate Real-Time Data In ChatGPT

Sam Altman, CEO of OpenAI, dispelled rumors that a new search engine would be announced on Monday, May 13. Recent deals have raised the expectation that OpenAI will announce the integration of real-time content from English, Spanish, and French publications into ChatGPT, complete with links to the original sources.
OpenAI Search Is Not Happening
Many competing search engines have tried and failed to challenge Google as the leading search engine. A new wave of hybrid generative AI search engines is currently trying to knock Google from the top spot with arguably very little success.
Sam Altman is on record saying that creating a search engine to compete against Google is not a viable approach. He suggested that technological disruption was the way to replace Google by changing the search paradigm altogether. The speculation that Altman is going to announce a me-too search engine on Monday never made sense given his recent history of dismissing the concept as a non-starter.
So perhaps it’s not a surprise that he recently ended the speculation by explicitly saying that he will not be announcing a search engine on Monday.
He tweeted:
“not gpt-5, not a search engine, but we’ve been hard at work on some new stuff we think people will love! feels like magic to me.”
“New Stuff” May Be Iterative Improvement
It’s quite likely that what’s going to be announced is iterative which means it improves ChatGPT but not replaces it. This fits into how Altman recently expressed his approach with ChatGPT.
He remarked:
“And it does kind of suck to ship a product that you’re embarrassed about, but it’s much better than the alternative. And in this case in particular, where I think we really owe it to society to deploy iteratively.
There could totally be things in the future that would change where we think iterative deployment isn’t such a good strategy, but it does feel like the current best approach that we have and I think we’ve gained a lot from from doing this and… hopefully the larger world has gained something too.”
Improving ChatGPT iteratively is Sam Altman’s preference and recent clues point to what those changes may be.
Recent Deals Contain Clues
OpenAI has been making deals with news media and User Generated Content publishers since December 2023. Mainstream media has reported these deals as being about licensing content for training large language models. But they overlooked a a key detail that we reported on last month which is that these deals give OpenAI access to real-time information that they stated will be used to give attribution to that real-time data in the form of links.
That means that ChatGPT users will gain the ability to access real-time news and to use that information creatively within ChatGPT.
Dotdash Meredith Deal
Dotdash Meredith (DDM) is the publisher of big brand publications such as Better Homes & Gardens, FOOD & WINE, InStyle, Investopedia, and People magazine. The deal that was announced goes way beyond using the content as training data. The deal is explicitly about surfacing the Dotdash Meredith content itself in ChatGPT.
The announcement stated:
“As part of the agreement, OpenAI will display content and links attributed to DDM in relevant ChatGPT responses. …This deal is a testament to the great work OpenAI is doing on both fronts to partner with creators and publishers and ensure a healthy Internet for the future.
Over 200 million Americans each month trust our content to help them make decisions, solve problems, find inspiration, and live fuller lives. This partnership delivers the best, most relevant content right to the heart of ChatGPT.”
A statement from OpenAI gives credibility to the speculation that OpenAI intends to directly show licensed third-party content as part of ChatGPT answers.
OpenAI explained:
“We’re thrilled to partner with Dotdash Meredith to bring its trusted brands to ChatGPT and to explore new approaches in advancing the publishing and marketing industries.”
Something that DDM also gets out of this deal is that OpenAI will enhance DDM’s in-house ad targeting in order show more tightly focused contextual advertising.
Le Monde And Prisa Media Deals
In March 2024 OpenAI announced a deal with two global media companies, Le Monde and Prisa Media. Le Monde is a French news publication and Prisa Media is a Spanish language multimedia company. The interesting aspects of these two deals is that it gives OpenAI access to real-time data in French and Spanish.
Prisa Media is a global Spanish language media company based in Madrid, Spain that is comprised of magazines, newspapers, podcasts, radio stations, and television networks. It’s reach extends from Spain to America. American media companies include publications in the United States, Argentina, Bolivia, Chile, Colombia, Costa Rica, Ecuador, Mexico, and Panama. That is a massive amount of real-time information in addition to a massive audience of millions.
OpenAI explicitly announced that the purpose of this deal was to bring this content directly to ChatGPT users.
The announcement explained:
“We are continually making improvements to ChatGPT and are supporting the essential role of the news industry in delivering real-time, authoritative information to users. …Our partnerships will enable ChatGPT users to engage with Le Monde and Prisa Media’s high-quality content on recent events in ChatGPT, and their content will also contribute to the training of our models.”
That deal is not just about training data. It’s about bringing current events data to ChatGPT users.
The announcement elaborated in more detail:
“…our goal is to enable ChatGPT users around the world to connect with the news in new ways that are interactive and insightful.”
As noted in our April 30th article that revealed that OpenAI will show links in ChatGPT, OpenAI intends to show third party content with links to that content.
OpenAI commented on the purpose of the Le Monde and Prisa Media partnership:
“Over the coming months, ChatGPT users will be able to interact with relevant news content from these publishers through select summaries with attribution and enhanced links to the original articles, giving users the ability to access additional information or related articles from their news sites.”
There are additional deals with other groups like The Financial Times which also stress that this deal will result in a new ChatGPT feature that will allow users to interact with real-time news and current events .
OpenAI’s Monday May 13 Announcement
There are many clues that the announcement on Monday will be that ChatGPT users will gain the ability to interact with content about current events. This fits into the terms of recent deals with news media organizations. There may be other features announced as well but this part is something that there are many clues pointing to.
Watch Altman’s interview at Stanford University
Featured Image by Shutterstock/photosince
SEO
Google’s Strategies For Dealing With Content Decay

In the latest episode of the Search Off The Record podcast, Google Search Relations team members John Mueller and Lizzi Sassman did a deep dive into dealing with “content decay” on websites.
Outdated content is a natural issue all sites face over time, and Google has outlined strategies beyond just deleting old pages.
While removing stale content is sometimes necessary, Google recommends taking an intentional, format-specific approach to tackling content decay.
Archiving vs. Transitional Guides
Google advises against immediately removing content that becomes obsolete, like materials referencing discontinued products or services.
Removing content too soon could confuse readers and lead to a poor experience, Sassman explains:
“So, if I’m trying to find out like what happened, I almost need that first thing to know. Like, “What happened to you?” And, otherwise, it feels almost like an error. Like, “Did I click a wrong link or they redirect to the wrong thing?””
Sassman says you can avoid confusion by providing transitional “explainer” pages during deprecation periods.
A temporary transition guide informs readers of the outdated content while steering them toward updated resources.
Sassman continues:
“That could be like an intermediary step where maybe you don’t do that forever, but you do it during the transition period where, for like six months, you have them go funnel them to the explanation, and then after that, all right, call it a day. Like enough people know about it. Enough time has passed. We can just redirect right to the thing and people aren’t as confused anymore.”
When To Update Vs. When To Write New Content
For reference guides and content that provide authoritative overviews, Google suggests updating information to maintain accuracy and relevance.
However, for archival purposes, major updates may warrant creating a new piece instead of editing the original.
Sassman explains:
“I still want to retain the original piece of content as it was, in case we need to look back or refer to it, and to change it or rehabilitate it into a new thing would almost be worth republishing as a new blog post if we had that much additional things to say about it.”
Remove Potentially Harmful Content
Google recommends removing pages in cases where the outdated information is potentially harmful.
Sassman says she arrived at this conclusion when deciding what to do with a guide involving obsolete structured data:
“I think something that we deleted recently was the “How to Structure Data” documentation page, which I thought we should just get rid of it… it almost felt like that’s going to be more confusing to leave it up for a period of time.
And actually it would be negative if people are still adding markup, thinking they’re going to get something. So what we ended up doing was just delete the page and redirect to the changelog entry so that, if people clicked “How To Structure Data” still, if there was a link somewhere, they could still find out what happened to that feature.”
Internal Auditing Processes
To keep your content current, Google advises implementing a system for auditing aging content and flagging it for review.
Sassman says she sets automated alerts for pages that haven’t been checked in set periods:
“Oh, so we have a little robot to come and remind us, “Hey, you should come investigate this documentation page. It’s been x amount of time. Please come and look at it again to make sure that all of your links are still up to date, that it’s still fresh.””
Context Is Key
Google’s tips for dealing with content decay center around understanding the context of outdated materials.
You want to prevent visitors from stumbling across obsolete pages without clarity.
Additional Google-recommended tactics include:
- Prominent banners or notices clarifying a page’s dated nature
- Listing original publish dates
- Providing inline annotations explaining how older references or screenshots may be obsolete
How This Can Help You
Following Google’s recommendations for tackling content decay can benefit you in several ways:
- Improved user experience: By providing clear explanations, transition guides, and redirects, you can ensure that visitors don’t encounter confusing or broken pages.
- Maintained trust and credibility: Removing potentially harmful or inaccurate content and keeping your information up-to-date demonstrates your commitment to providing reliable and trustworthy resources.
- Better SEO: Regularly auditing and updating your pages can benefit your website’s search rankings and visibility.
- Archival purposes: By creating new content instead of editing older pieces, you can maintain a historical record of your website’s evolution.
- Streamlined content management: Implementing internal auditing processes makes it easier to identify and address outdated or problematic pages.
By proactively tackling content decay, you can keep your website a valuable resource, improve SEO, and maintain an organized content library.
Listen to the full episode of Google’s podcast below:
Featured Image: Stokkete/Shutterstock
-

 PPC5 days ago
How the TikTok Algorithm Works in 2024 (+9 Ways to Go Viral)
-

 MARKETING7 days ago
A Recap of Everything Marketers & Advertisers Need to Know
-

 SEO6 days ago
Blog Post Checklist: Check All Prior to Hitting “Publish”
-

 SEO4 days ago
How to Use Keywords for SEO: The Complete Beginner’s Guide
-

 MARKETING5 days ago
How To Protect Your People and Brand
-

 SEARCHENGINES6 days ago
Google Started Enforcing The Site Reputation Abuse Policy
-

 PPC6 days ago
How to Craft Compelling Google Ads for eCommerce
-

 MARKETING6 days ago
Elevating Women in SEO for a More Inclusive Industry


You must be logged in to post a comment Login